Chapter 2 - Displaying Data
1/28
There's no tags or description
Looks like no tags are added yet.
Name | Mastery | Learn | Test | Matching | Spaced |
|---|
No study sessions yet.
29 Terms
Survivorship Bias
Incomplete information due to removing "failures" from analysis -> look at groups that do what you want them to
Familiarity/Recall Bias
We overemphasize information we are familiar with
Gambler's Fallacy
An erroneous belief that probabilities "change"
Ex. even if a coin flips and is heads 10 times in a row, the next flip still has the same chance of being 50% heads or tails
Base Rate Fallacy
Focusing on individual cases to the detriment of the whole
Ex. one person got sick from covid, so someone only focuses on that, even though there is a higher rate of people who did not get sick
Levels of Measurement
Qualitative and Quantitative
Qualitative Levels of Measurement
Nominal and ordinal -> descriptors, categorical, generally described with words
Quantitative Levels of Measurement
Interval, ratio, and ordinal -> numeric things we can do math with, "true numbers"
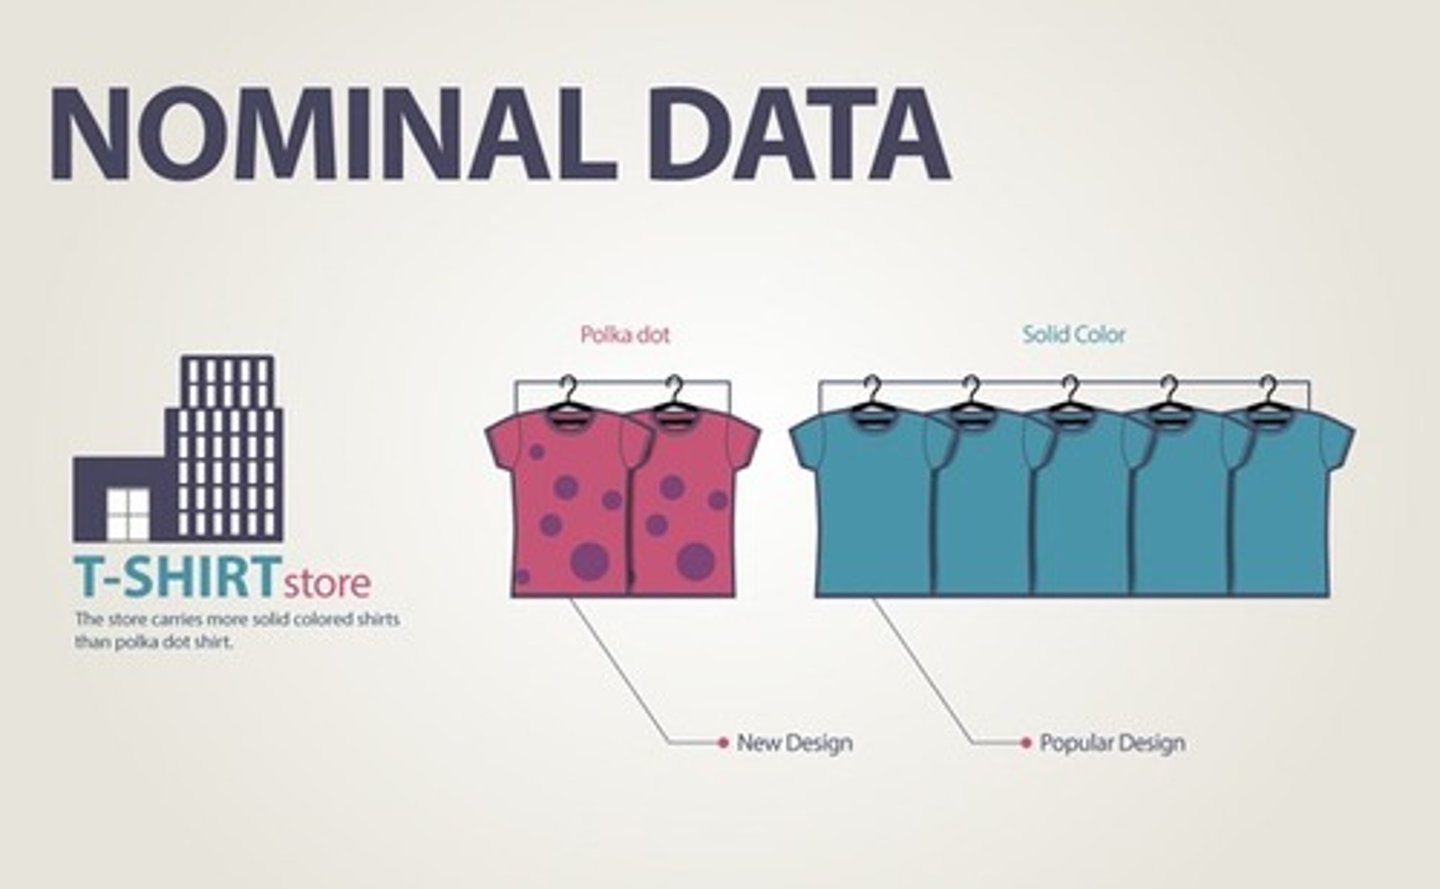
Nominal Data
-Name -> ex. brown hair, blue eyes
-Can't order in a meaningful way
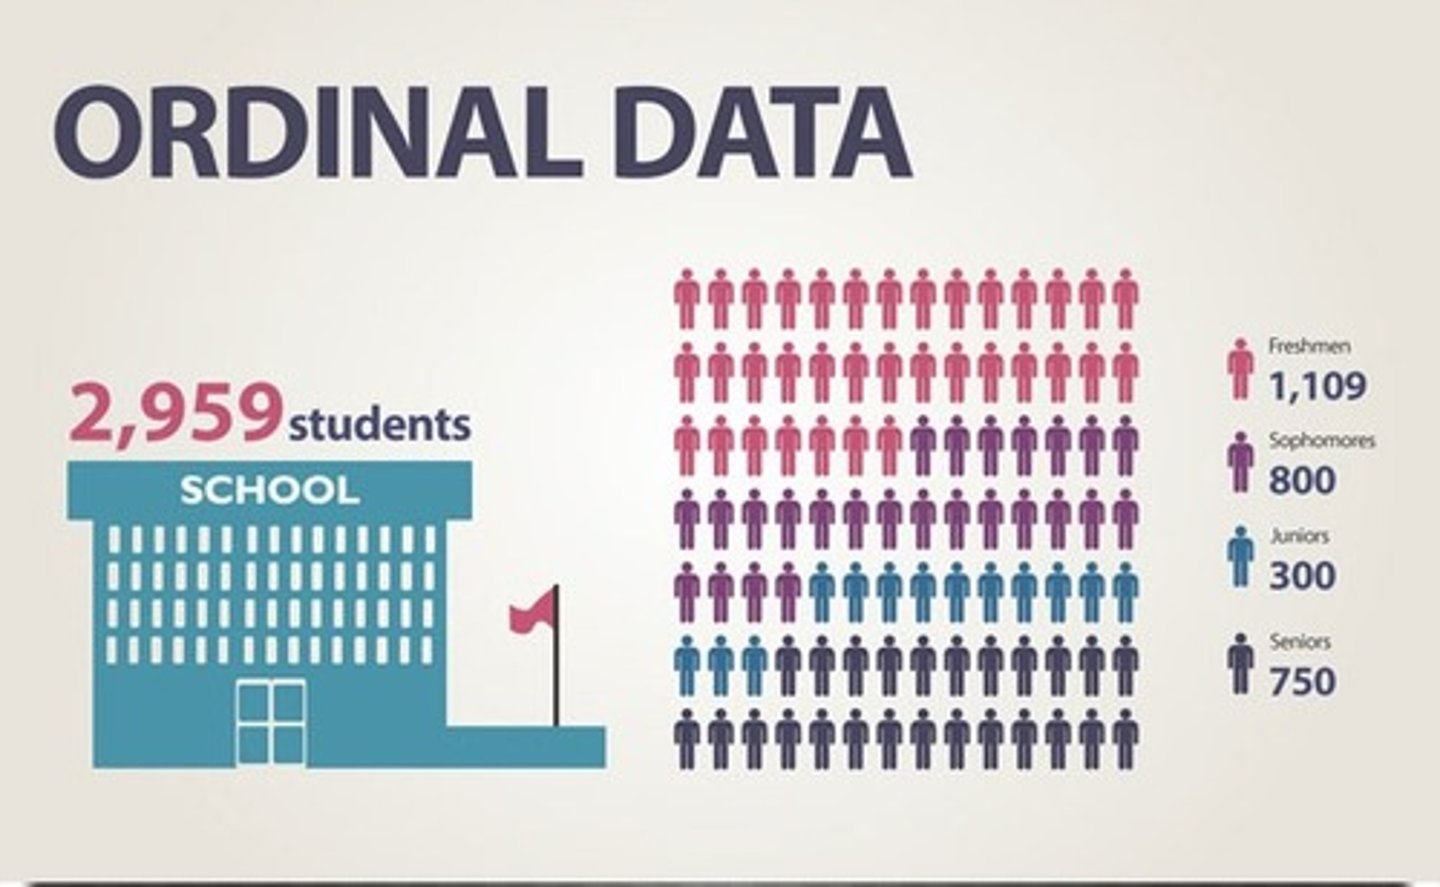
Ordinal Data
-Ordered/ranked -> doesn't need to be regular or clearly defined, can be numbers
-Can be ordered in some way, ex. women's clothing sizes, grades, and year in college
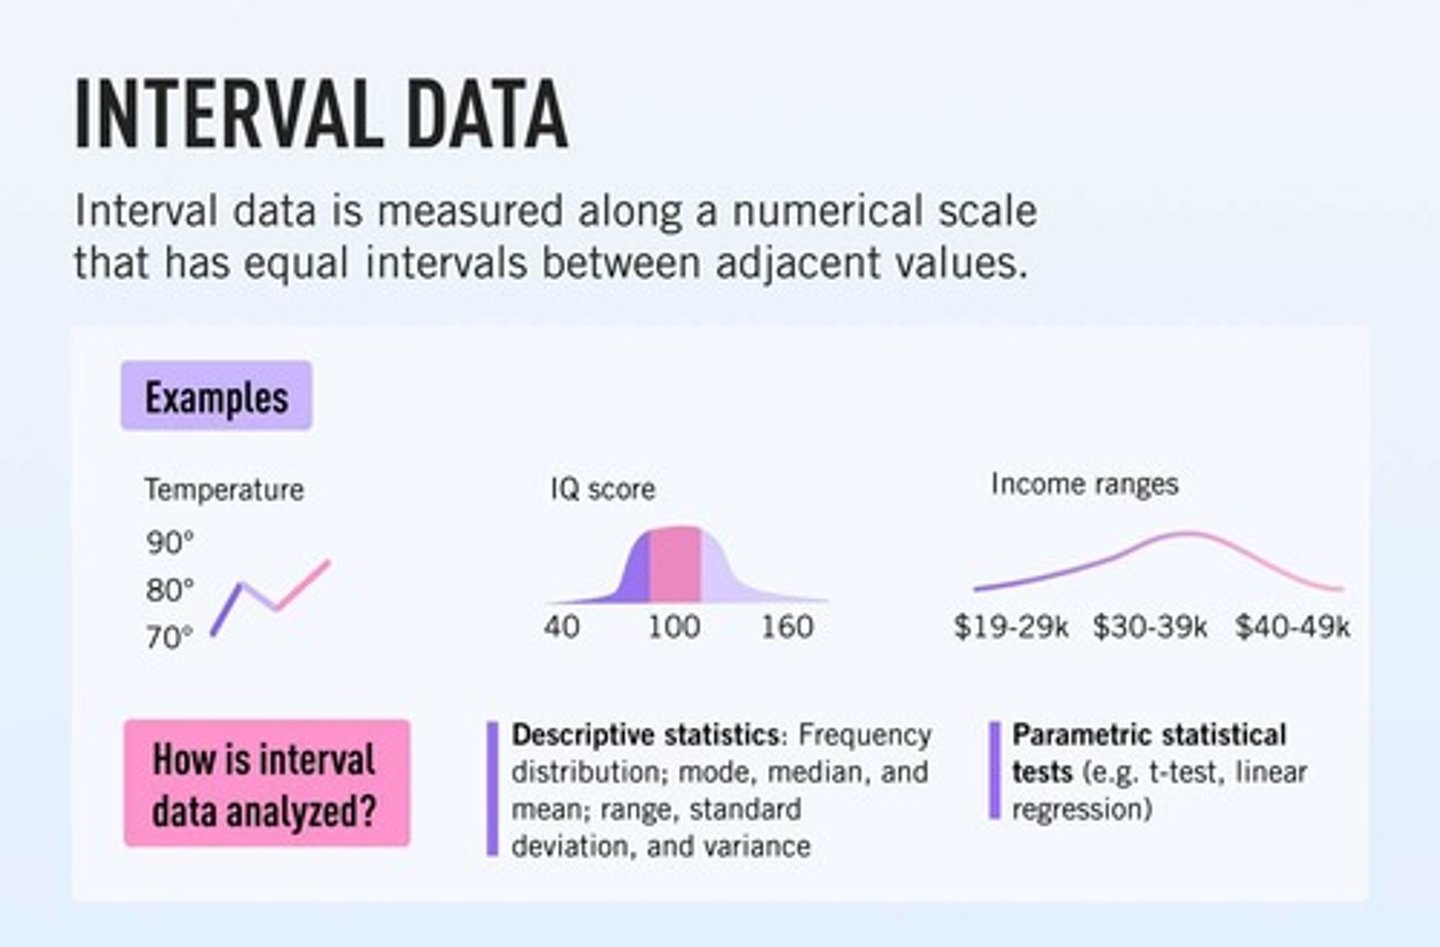
Interval Data
Measured variable has regular intervals and no true zero -> ex. ruler, temperature
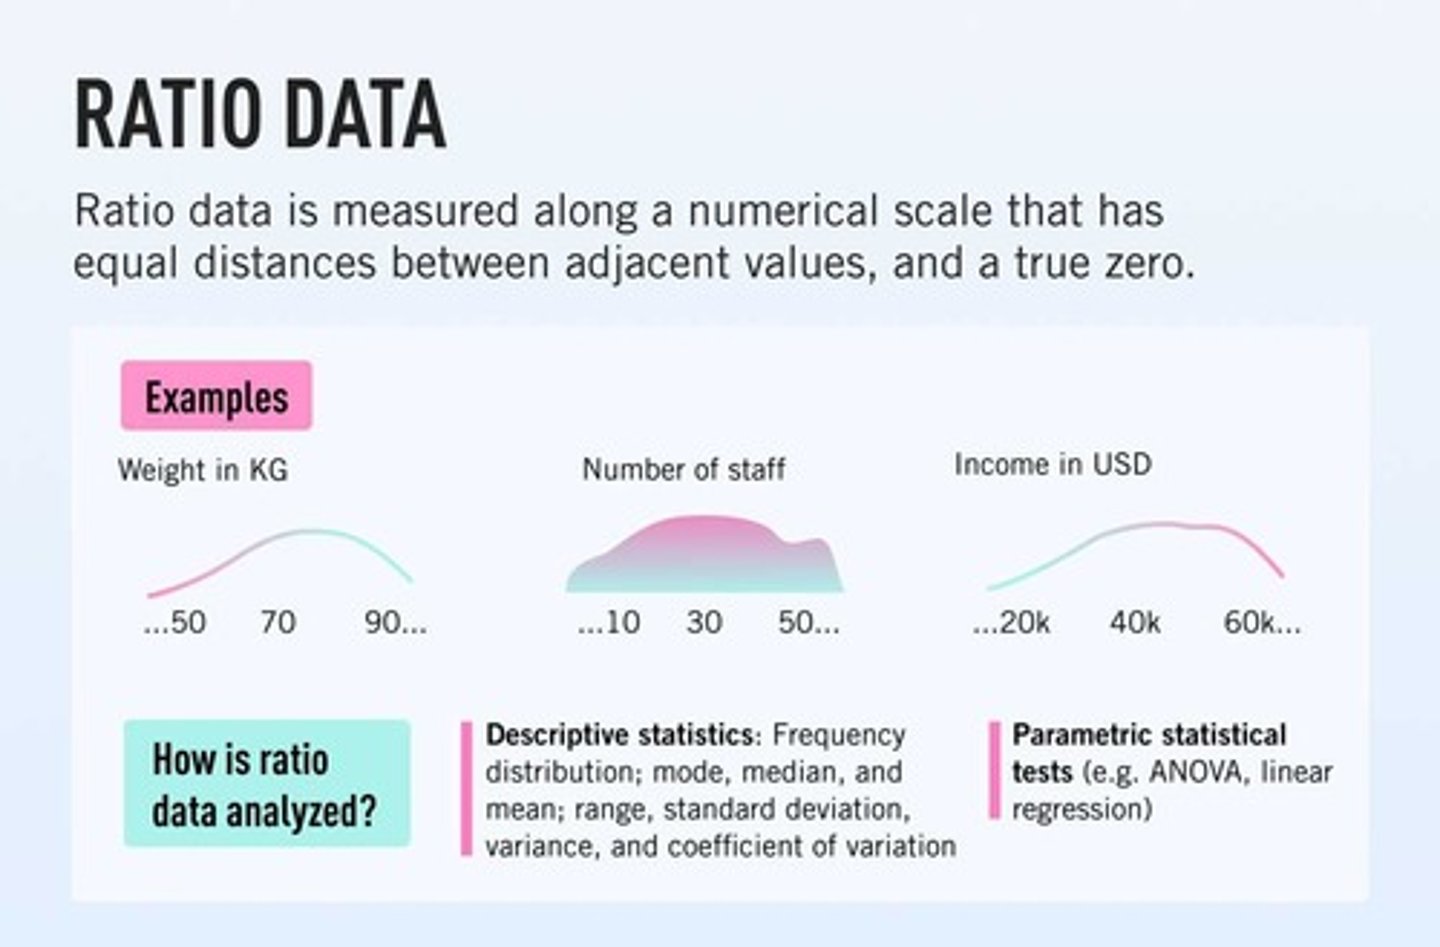
Ratio Data
Has a true zero -> nothing can go below -> ex. mass, age, Kelvin
How can we name or group things?
Nominal or qualitative data
How can we order or rank things?
Ordinal or ranked data
How can we put things on a logically spaced scale?
Interval data (no true zero)
Ratio data (true zero)
SPSS calls both of these "scale"
Can data be demoted or promoted?
Data can almost always be demoted, but it can never be promoted
nominal/qualitiative <- ordinal/ranked <- interval/ratio/quantitative
Frequency Data
How often a thing is observed
Frequency Data Measures
Sample, sample size, datum, frequency/count
Sample
The group of observations
Sample Size
n -> the number of observations
Datum
x -> one data point/occurrence (singular of data)
Frequency/Count
f -> the number of occurrences of same category
Bar Graph Styles
Cluster, stacked bar, pie
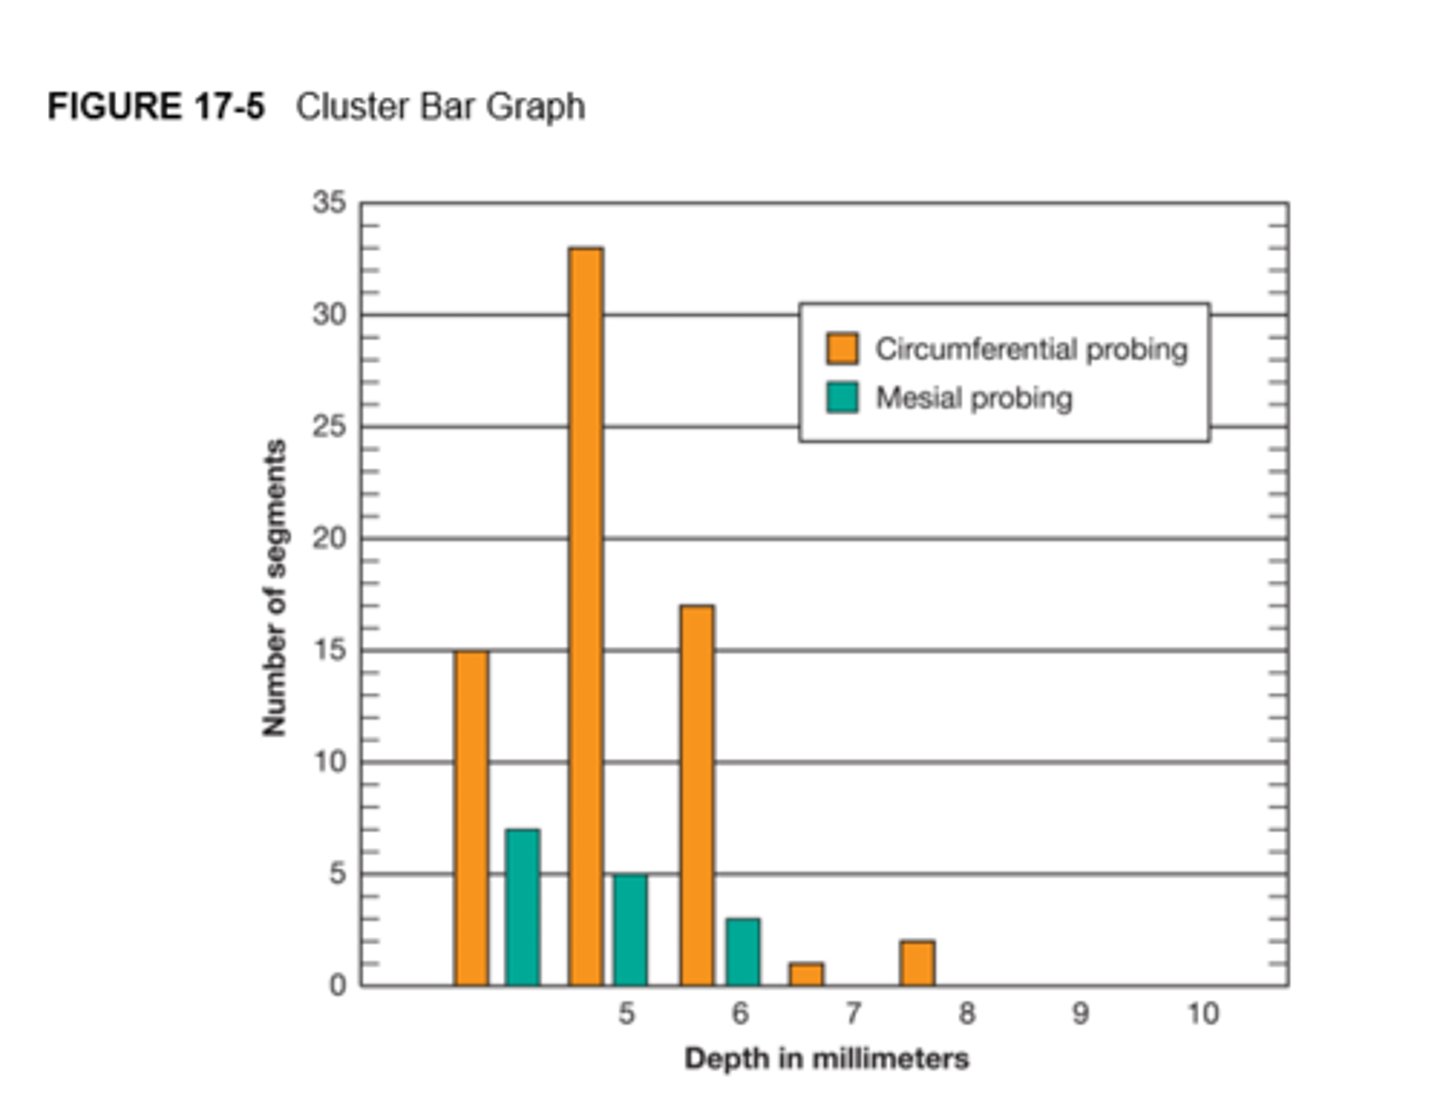
Cluster Graph
Subgroups -> a graph with dots not connected by lines in no specific order
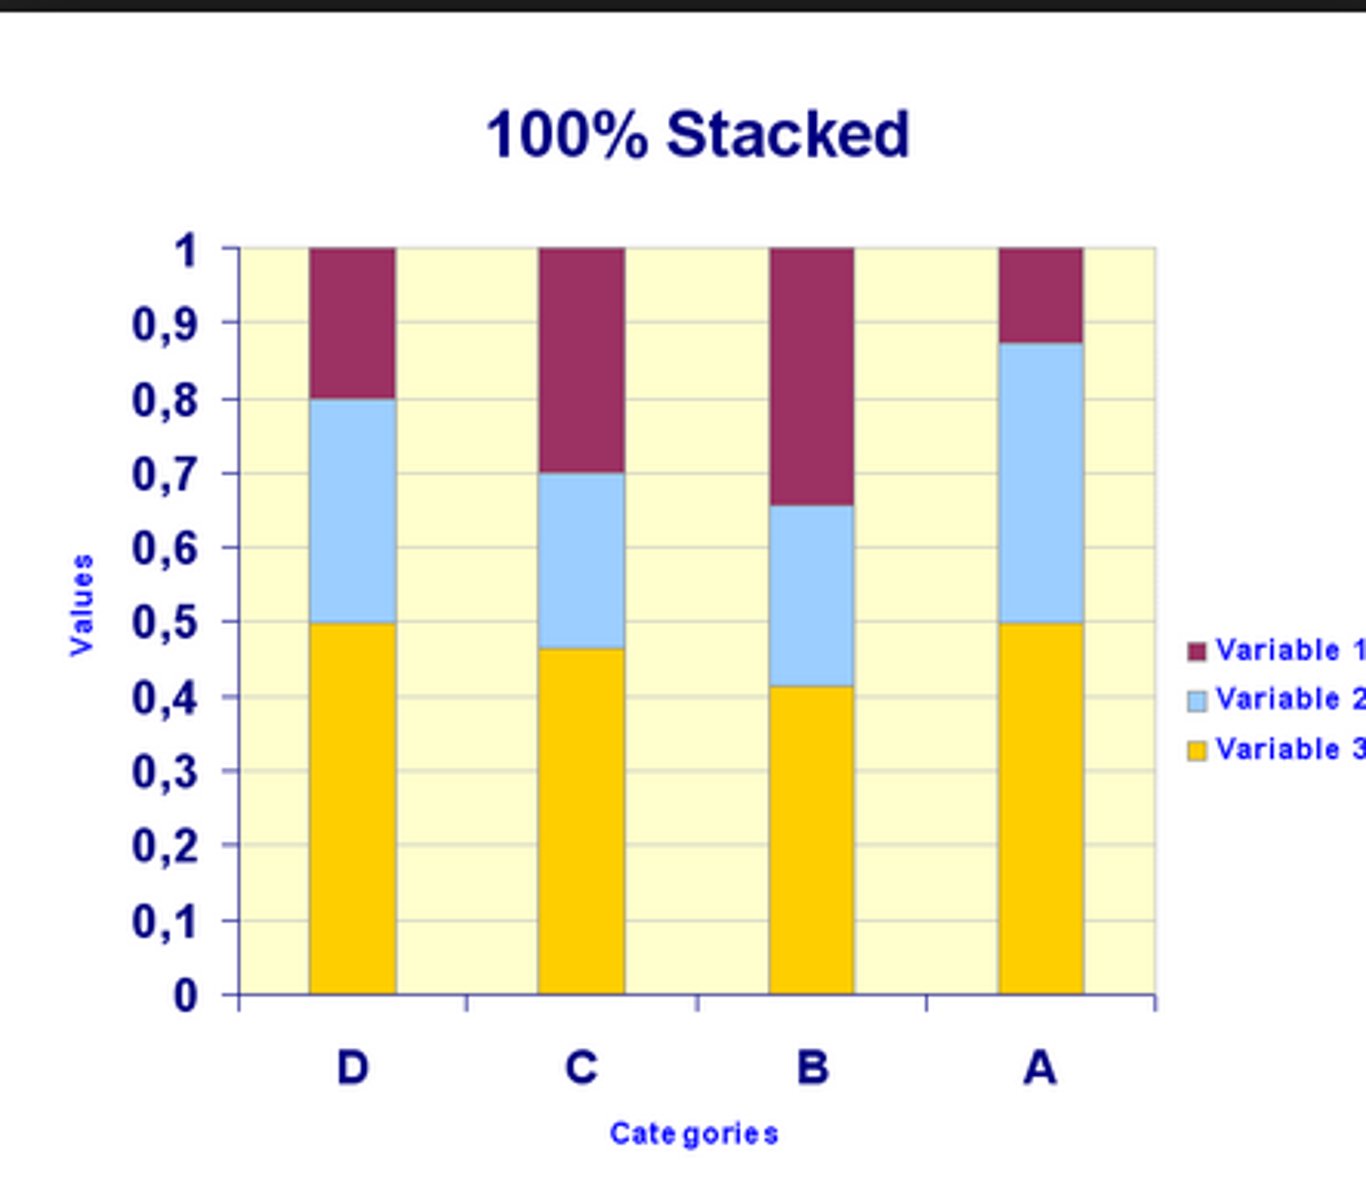
Stacked Bar Graph
A bar graph that compares the same categories for different groups and shows category totals
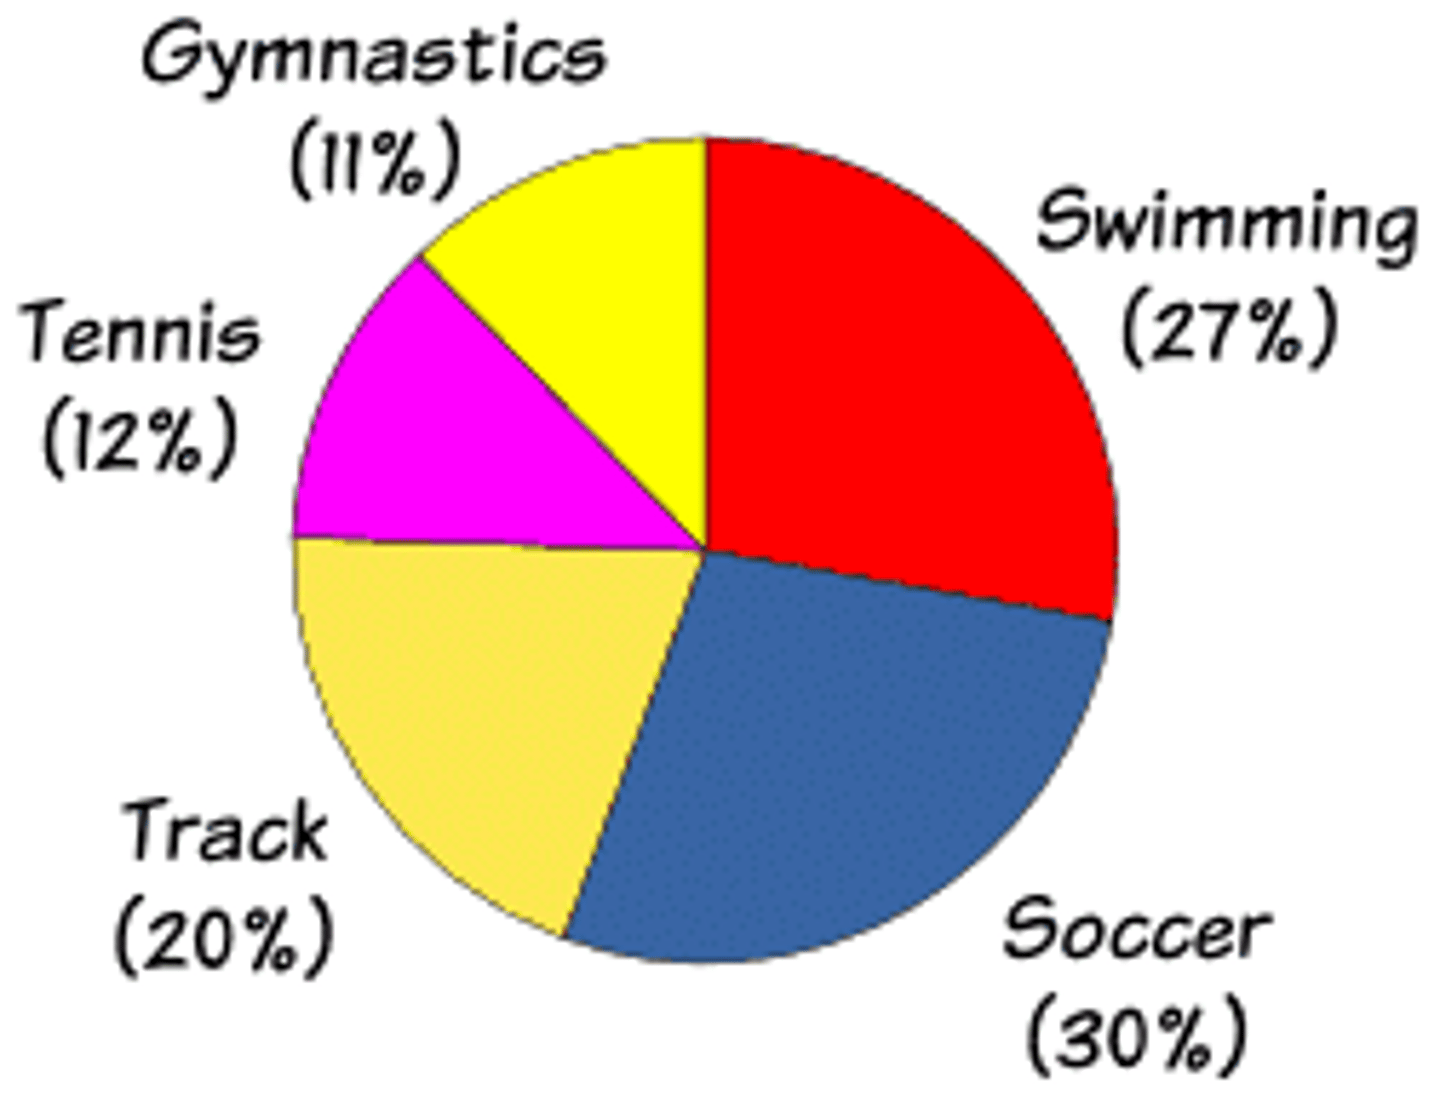
Pie Graph
A graph that highlights segments of a circle to show simple distribution patterns
Rules and Guidelines for Visual Data
-Axes should be labeled with units
-The lower end of the frequency scale should be set to 0, or indicated as broken with crossover lines
-Width of the bars should be regular
-The scales of the X and Y axis should be roughly similar
-Bars should touch for continuous data, and should be separate for categorical
-Y axis generally should increase up; X axis should generally increase right
What are bar and pie graphs good for?
Categories, counts, ordinal data
Binning Data
When it is impossible or impractical to have a category for every value in a data set, we bin (or group) the data into categories (bins), each covering a range of possible data values
Scalar -> Ordinal Data
-Taking individual data and grouping them into ranges
-Can always denote data, but never promote it
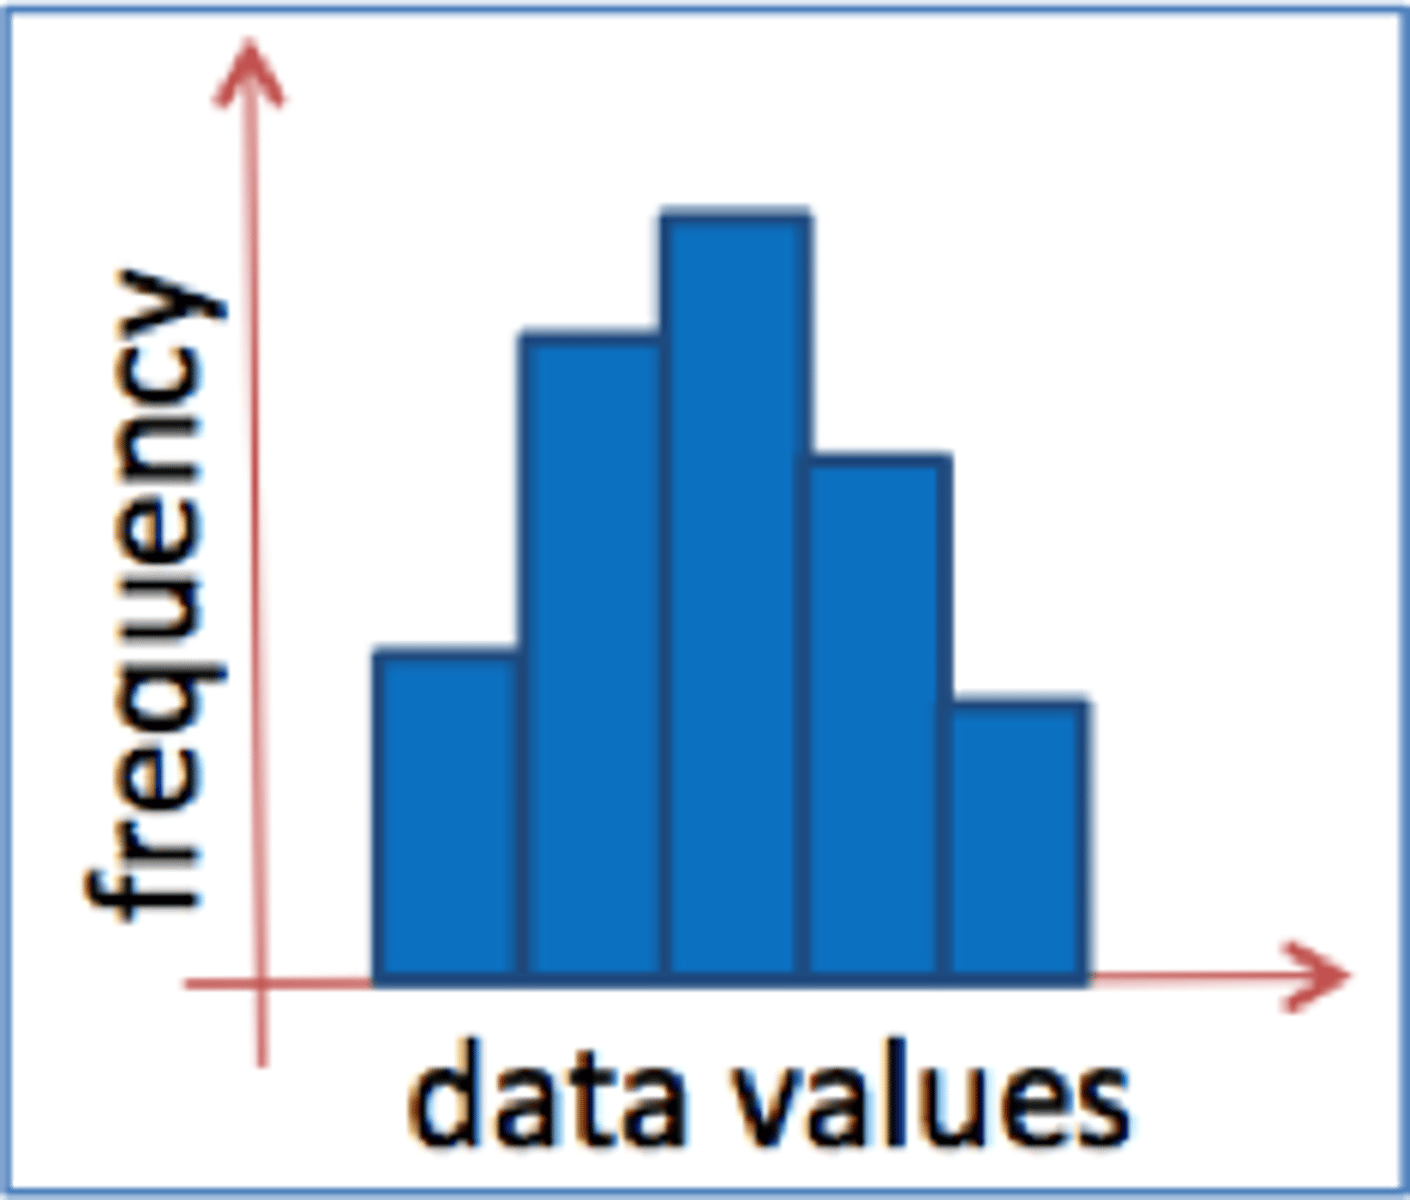
Histogram
-Displays frequency data
-Bars touching/contiguous (implies continuous distribution)
-X axis from left to right
-Y axis ascends from bottom to top (should index at 0)
-Bins should be uniform size, ~10 is good