AP Stats
1/75
There's no tags or description
Looks like no tags are added yet.
Name | Mastery | Learn | Test | Matching | Spaced | Call with Kai |
|---|
No study sessions yet.
76 Terms
Mean
average of all data values. Add them up and divide by how many there are.
Median
The middle value when data are ordered from least to greatest.
Mode
The value that appears most often.
Range
The difference between the maximum and minimum values.
5-Number Summary
Minimum, Q1, Median, Q3, Maximum. Used to make a boxplot
IQR (Interquartile Range):
Q3 – Q1. Measures the spread of the middle 50% of the data.
Variance
The average squared distance from the mean.
Standard Deviation
The typical distance a data point is from the mean.
Z-Score
Tells how many standard deviations a value is from the mean. Formula: (x - mean)/s
Residual
The difference between actual and predicted values. Actual - Predicted = ?
Outlier (1.5 × IQR Rule)
Smaller than Q1 - (1.5×IQR) or larger than Q3 + (1.5×IQR)
Undercoverage Bias
Some groups in the population are left out.
Nonresponse Bias
People chosen for the sample don’t respond.
Response Bias
People give inaccurate answers (lying, wording, etc.).
Wording Bias
Question wording influences responses
Voluntary Response Bias
People choose to respond, usually with strong opinions.
Convenience Sample
Sample chosen because it’s easy to reach.
Population
The entire group we want to study
Sample
The part of the population actually observed or surveyed
Parameter
A number that describes the population
Statistic
A number that describes a sample
Simple Random Sample (SRS)
Every individual has an equal chance of being selected.
Stratified Random Sample
Divide population into groups and take random samples from each.
Cluster Sample
Divide population into clusters, randomly choose a few clusters, and sample everyone in those.
Systematic Sample
Select every nth individual after a random start
Observational Study
Observes individuals but does not impose treatments
Experiment
Imposes a treatment to measure cause and effect
Confounding Variable
A hidden variable that affects both explanatory and response variables.
DUFS
Direction, Unusual Features, Form, Strength — used to describe scatterplots.
Correlation (r)
Measures direction and strength of a linear relationship (–1 ≤ r ≤ +1)
Coefficient of Determination (r²)
Percent of variation in y explained by the regression line.
Least Squares Regression Line (LSRL)
Line that minimizes the sum of squared residuals. ŷ = a + bx
Slope Interpretation
For each 1-unit increase in x, predicted y changes by b units
Y-Intercept Interpretation
Predicted value of y when x = 0.
Experiment
A study where the researcher actively imposes a treatment on subjects to measure cause and effect.
Observational Study
A study that observes individuals and records data without influencing the responses. no treatment imposed
Explanatory Variable (Input)
The variable that is changed or controlled to see if it causes an effect on the response variable.
Response Variable (Output)
The variable that measures the result or outcome of the study.
Treatment
A specific condition applied to individuals in an experiment, often a combination of explanatory variable levels.
Experimental Units
The individuals or objects on which treatments are imposed (called subjects if they’re people).
Placebo
A fake treatment that looks real but has no active ingredient; used to measure the effect of expectation.
Placebo Effect
When subjects show a response to a fake treatment simply because they believe it’s real.
Double-Blind Experiment
Neither the subjects nor the researchers who interact with them know which treatment each subject receives — helps prevent bias.
Blocks (Blocking)
Grouping experimental units that are similar in some important way before assigning treatments to reduce variation.
Matched Pairs Design
A special type of blocking with two very similar units, or one unit measured before and after a treatment.
Block Group
A group of similar experimental units formed to control for outside variables, with random assignment done within each block.
Random Assignment
Using chance to assign treatments to experimental units, helping to balance out unknown variables.
Control Group
The group that does not receive the treatment (or receives a placebo) and is used for comparison.
Randomized block design
a statistical method that groups subjects into blocks based on a shared characteristic to reduce variability and increase experimental precision
Randomized design
an experimental setup in statistics where subjects are randomly assigned to different treatment groups
Statistically significant
a measure that indicates a result is unlikely to have occurred due to random chance, meaning the outcome is likely real. (Less then 5%)
more then 0.05 means
it could happen by chance
less then 0.05 means
it could not happen by chance
Short run
unpredictable probability
Long run
More predictable probability
A ∩ B
The event that A AND B happen at the same time. (Overlap) (Multiply probabilities)
(A ∪ B)
The event that A happens OR B happens (or both).
Rule: Add the probabilities and subtract the overlap.
Mutually Exclusive
Two events that cannot happen together (no overlap).
Not Mutually Exclusive
Two events that can happen together — there is overlap.
Aᶜ
The event that A does NOT happen.
Conditional Probability
Probability of A given B has happened: P(A∣B)
Independent Events
Knowing one event happens does NOT change the probability of the other.
Binary
A single trial with only two possible outcomes called success and failure
Success
The outcome of interest in a trial (does not have to be a “good” outcome).
Failure
The outcome that is not the success in a trial.
n =
Number of Trials
p =
Probability of Success
x =
Number of Successes
Binomial Mean
μ=np
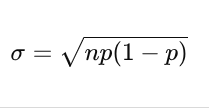
Binomial Standard Deviation
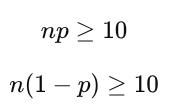
Large Counts Condition (Normal approximation)
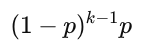
Geometric Probability (first success on trial k)
Geometric Expected Value

BINS (checking if it’s Binomial)
Binary outcomes
Independent trials
Number of trials fixed
Same probability of success
Geometric
count trials until first success
Binomial
fixed number of trials, count successes