Water and carbon
1/69
There's no tags or description
Looks like no tags are added yet.
Name | Mastery | Learn | Test | Matching | Spaced | Call with Kai |
|---|
No analytics yet
Send a link to your students to track their progress
70 Terms
Terms: inputs, outputs, flows, stores
inputs → where matter or energy is added to the system.
outputs → where matter or energy leaves the system.
flows → where matter or energy moves in the system.
stores → where matter or energy builds up in the system.
Terms: boundaries, open systems, closed systems
boundaries → limits to the systems e.g., watershed.
open systems → when systems receive inputs and transfer outputs of energy or matter with other systems.
on a local scale, the carbon and water cycles are both open systems.
closed systems → when energy inputs equal outputs.
on a global scale, they are both closed systems.
Terms: positive feedback, negative feedback, dynamic equilibrium
positive feedback → when a chain of events amplifies the impacts of the original event.
negative feedback → a chain of events that nullifies the impacts of the original event, leading to dynamic equilibrium.
dynamic equilibrium → when inputs equal outputs, despite changing conditions.
Global distribution of water
freshwater = 2.5% of all Earth's water.
approximately 1.6% of the freshwater is locked away:
68.7% as ice within the cryosphere.
the remaining 30.1% is groundwater.
in total, just 0.9% of the Earth's total freshwater, is accessible to humans.
Global distribution and size of major stores of water: lithosphere
Lithosphere → water stored as groundwater = 30.1%
the level of storage capacity is low as water can flow through the lithosphere into underground aquifers but this transfer may be relatively slow, often taking many years.
however, this store captures water for the longest periods of time as some water is stored within bedding planes, joints and pores in rocks and can remain there for hundreds of years.
Global distribution and size of major stores of water: hydrosphere
Hydrosphere → water stored as liquid = 1%
processes impacting the hydrosphere are runoff and precipitation – inputs water to the store and evaporation moves water from the ocean into the atmosphere.
these changes have minimal impact on the storage capacity – however long-term climatic change events e.g., ice ages, have the potential to lower the storage capacity significantly.
Global distribution and size of major stores of water: cryosphere
Cryosphere → water stored as ice = 68.7%
major stores include the Antarctic and Greenland ice sheets, polar sea ice and mountain glaciers.
annual changes to ice coverage have minimal impact upon storage capacity.
but during ice ages, cryospheric storage increases and during warmer inter-glacial periods, it reduces.
Global distribution and size of major stores of water: atmosphere
Atmosphere → water stored as water vapour = 0.2%
water is removed from water surfaces through evaporation and then stored temporarily as water vapour – then condenses before releasing back to earth as precipitation.
also, transpiration from plants releases water vapour into the atmosphere.
Processes driving change in the magnitude of these stores over time and space, including flows and transfers: evaporation
Evaporation → the process of turning liquid into gas.
occurs when energy from the sun hits the surface of water, increasing the amount of water stored in the atmosphere.
Temporal variation:
Evaporation rates vary by season – warmer seasons i.e., summer, with warm, dry air and lots of solar radiation means evaporation will be high.
Spatial variation:
Temperature of the air – warmer air can hold more water than cold air.
Amount of solar energy – more solar radiation = more evaporation.
Availability of water – more water available = more potential evaporation.
Processes driving change in the magnitude of these stores over time and space, including flows and transfers: condensation
Condensation → the conversion of water vapour/gas into liquid.
Occurs when air cool to its dew point, forming clouds or fog.
Temporal variation:
Often occurs at night when temperatures drop and there’s a lack of solar radiation.
Frequent in cooler months.
Spatial variation:
Common over cooler regions or high altitudes e.g., mountainous areas.
Frequent in coastal areas, where moist air cools quickly.
Processes driving change in the magnitude of these stores over time and space, including flows and transfers: cloud formation
Cloud formation → when water vapour condenses around tiny particles.
This can happen due to convection where warm air rises, it cools, forming cumulus clouds.
Temporal variation:
Seasonal patterns e.g., monsoon seasons in Asia – cloud formation increases this time.
In winter, frontal clouds more common in mid-latitudes due to the interaction of cold and warm air masses.
Spatial variation:
High level of convection in the tropics due to intense heat – frequent/tall cumulonimbus clouds.
Moist air from oceans in coastal areas cool quickly – forms clouds near shorelines.
Processes driving change in the magnitude of these stores over time and space, including flows and transfers: causes of precipitation
Precipitation → when water falls from the clouds towards the ground as rain, snow or hail etc.
Frontal rainfall → where warm and cold air meet, forcing the warm air to rise above the cool air, cooling as it rises. Eventually leads to cloud formation and rainfall.
Convectional rainfall → the sun heats the planet’s surface and the air above, providing the air with extra energy to rise upwards in thermals.
Relief rainfall → when air masses are pushed up over mountainous/upland areas, cooling the air to form clouds and rainfall (major method of precipitation in UK).
Orographic rainfall → rain associated with topography, when warm air meets mountains and is forced to rise and cool.
Temporal variation:
Precipitation increases during monsoon seasons e.g., Pakistan.
In temperate area, rainfall peaks in winter due to frequent frontal systems e.g., frontal uplift.
Climate change leads to shifting wind patterns, changing precipitation patterns.
Spatial variation:
Convectional rainfall dominates in the tropic due to strong solar heating and rapid cloud formation e.g., Amazon.
Frontal rainfall in mid-latitudes where warm and cold air masses meet e.g., Europe or North America.
Limited precipitation in polar regions due to low temperatures and reduced atmospheric moisture.
Processes driving change in the magnitude of these stores over time and space, including flows and transfers: cryospheric processes at hillslope
Cryospheric processes at hillslope → involve the movement, storage and melting of snow and ice in localised areas, such as slopes and valleys.
Key processes include:
Freeze-thaw weathering
Snow accumulation during colder months
Snowmelt – in warmer periods, leading to surface runoff and even slope instability.
Temporal variation:
Snow accumulation occurs in winter as snow build up, whilst snowmelt dominates in summer months.
Climate change – warmer climates may reduce snow cover and cause permafrost to thaw.
Spatial variation:
Polar or high-altitude areas see permanent or seasonal permafrost, while temperate regions experience freeze-thaw cycles.
South-facing slopes i.e., the Northern Hemisphere melt faster due to more sunlight, while north-facing slopes retain snow longer.
Drainage basins as open systems: inputs
Precipitation:
Precipitation → any water that falls to the surface of the earth from the atmosphere including rain, snow and hail.
Some of the water may be intercepted by plants and trees – later evaporates.
Some of the water travels as stemflow and either stores as puddles, flows over the ground, or infiltrates the soil.
Drainage basins as open systems: outputs
Evapotranspiration:
Evapotranspiration → comprised of evaporation and transpiration:
Evaporation → occurs when water is heated by the sun, causing it to become gas and rise into the atmosphere.
Transpiration → occurs in plants when they respire through their leaves, releasing water they absorb through their roots, which then evaporates due to heating by the sun.
ET accounts for nearly 100% of annual precipitation in arid areas & 75% in humid areas.
Transpiration varies with vegetation e.g.; broad leaves have higher rates than needle-shaped leaves as there is more surface area.
Transpiration varies with crop type e.g., grass-like crops like wheat have low rates.
Runoff:
Runoff → when water flows over the land as surface water.
The type of precipitation affects the amount of runoff – snow delays runoff, but increases once it melts.
The intensity of precipitation affects the amount of runoff – large amounts of rainfall in a short time (aka flash flooding) increases the amount of runoff.
Human activities, such as impermeable surfaces from infrastructure, increase runoff.
Drainage basins as open systems: stores
Interception:
Interception → water landing on plants on their branches and leaves before reaching the ground.
Type of precipitation affects the drainage basin – snowfall can store on plant surfaces until it melts, delaying water input to the system.
Areas with higher temperatures reduce interception storage – evaporation moves the position of water within the system.
It’s more significant during light rain or small showers – most of precipitation never reaches the soil and doesn’t exceed the capacity.
Surface storage:
Surface storage → the total volume of water stored in puddles, ponds and lakes.
Can be natural e.g., lakes, floodplains or man-made e.g., reservoirs, urban drainage systems.
Plays key role in regulating river discharge – stores excess precipitation, reducing flood risk.
Climate change is reducing ice caps and glaciers – decreases long-term water storage.
Soil water:
Soil water → the amount of water stored in the soil which is utilised for plant growth.
Capillary action → involves water being transmitted upwards towards the soil surface and atmosphere.
Or the water can be absorbed or held.
In fine-textured soils, there is a high proportion of small pores, holding the water at high suctions.
In coarse-textured soils, much of the water is held in fairly large pores at low suctions – very little is held in small pores.
Drainage basins as open systems: stores
Groundwater:
Groundwater → water that is stored in the pore spaces of permeable rock underground.
Groundwater accounts for 30.1% of all freshwater on earth.
Groundwater recharge → refilling of water in pores where water has dried up or been extracted by human activity.
Human activities have been depleting major groundwater stores e.g., the Ogallala aquifer in Texas has experienced a fall in the water table of 50m in under 50 years.
Channel storage:
Channel storage → water that is temporarily stored in a river channel.
Can be controlled by human factors such as dam construction – increased storage.
During dry seasons, channel storage decreases – some river experience intermittent flow or dry up completely.
Channel storage is influenced by land use – urbanisation increases runoff into rivers, increasing storage.
Drainage basins as open systems: flows
Stemflow:
Stemflow → the flow of intercepted water down the trunk or stem of a plant.
More significant in dense forest, where tree canopies intercept high rainfall.
Helps direct water to the base of trees – promotes deep infiltration & reduces surface runoff.
Varies depending on tree species – smooth-barked trees encourage stemflow e.g., beech.
Varies on the season – in deciduous forest, stemflow decreases in winter when leaves are absent.
Infiltration:
Infiltration → downward movement of water from the surface into the soil.
Water soaks into the soil through gravity as well as capillary action (the attraction of water molecules to soil particles).
Soil type affects the rate of infiltration – thin, frozen or already saturated soils have a lower infiltration capacity.
Trees can promote infiltration – the roots form pathways for water to percolate underground.
Drainage basins as open systems: flows
Overland flow (surface runoff):
Overland flow → the flow of water that occurs when excess stormwater, meltwater, or other sources flows over the earth's surface.
Water can flow over a large surface area (aka sheetflow) or into small channels (aka rills).
Not common in the UK – much of the land is covered by vegetation, so is absorbed.
Common in urban areas e.g., roads, where there are less permeable surfaces.
Channel flow (river discharge):
Channel flow → the movement of water within the river channel.
Low channel flow during a drought may result in river drying e.g., the Colorado River experiences reduced discharge due to overuse and climate change.
Geology affects flow – permeable rocks e.g., limestone allow infiltration, reducing direct channel flow.
Human activities can aid the flow – man-made dams and reservoirs control discharge levels.
Concept of water balance
Precipitation = total runoff + evapotranspiration +/- storage (change in)
The water balance → expresses the process of water storage and transfer in a drainage basin system.
The change in storage value could be positive or negative:
Negative → there are more outflows (runoff and evapotranspiration) than inflows (precipitation).
Positive → there are more inflows (precipitation) than outflows (runoff and evapotranspiration).
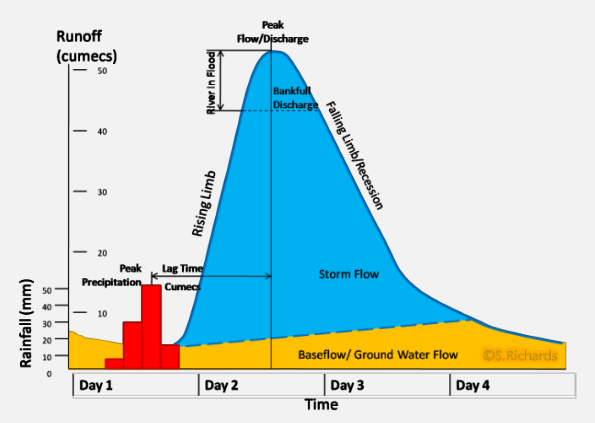
Runoff variation and the flood hydrograph
Flood hydrograph → represents rainfall for the drainage basin of a river and the discharge of the same river on a graph.
Discharge → the volume of water passing through a cross-sectional point of the river at any one point in time (measured in cumecs), made up of baseflow and stormflow.
Rising limb → the line on the graph that represents the discharge increasing.
Falling limb → the line of the graph that represents the discharge decreasing.
Lag time → the time between peak rainfall and peak discharge.
Baseflow → the level of groundwater flow.
Stormflow → comprised of overland flow and throughflow.
Bankfull discharge → the maximum capacity of the river – if discharge exceeds this then the river will burst its banks and be in flood.
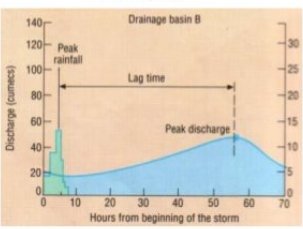
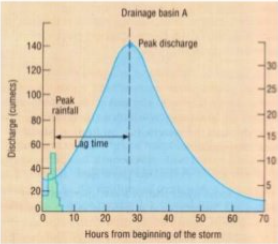
Flashy and subdued hydrographs
Flashy:
Short lag time
Steep rising and falling limb
Higher flood risk
High peak discharge
Subdued:
Long lag time
Gradually rising and falling limb
Lower flood risk
Low peak discharge
Changes in the water cycle over time to include natural variation including storm events, seasonal changes
Storm events:
Cause sudden increases in rainfall, leading to flooding and replenishment of some water stores – unlikely to cause long-term change.
Can overwhelm river channels → temporary increases in channel flow and discharge.
Increased surface runoff → reduced infiltration due to waterlogging.
Seasonal changes:
Less precipitation, more evapotranspiration in summer due to higher temperatures.
Reduced flows in the water cycle in winter as water is stored as ice.
Reduced interception in winter, when deciduous trees lose their leaves.
Increased evapotranspiration in summer, as deciduous trees have their leaves and there are higher temperatures.
Soil moisture and infiltration – soil may become impermeable if frozen.
Cryospheric processes:
In the past, glaciers and icecaps stored significant proportions of freshwater through the process of accumulation.
Currently, almost all of the world’s glaciers are shrinking, causing sea levels to rise.
If all the world’s glaciers and icecaps melted, sea levels would rise by around 60m.
Droughts:
Cause major stores to be depleted and the activity of flows within the water cycle to decrease – may cause long-term damage as they become more common due to climate change.
Changes in the water cycle over time to include human impact: farming practices
Farming practices:
Ploughing breaks up the surface, increasing infiltration – but exposes soil to erosion.
Arable farming (crops) can increase interception and evapotranspiration.
Pastoral farming (animals) compacts soil, reducing infiltration and increasing runoff.
Irrigation removes water from local rivers, decreasing their channel flow.
Use of fertilisers and pesticides can pollute water sources via runoff.
Changes in the water cycle over time to include human impact: land use change
Land use change:
Deforestation e.g., for farming, reduces interception and evapotranspiration. But infiltration increase as dead plant material in forests usually prevents infiltration.
Construction reduces infiltration due to more impermeable surfaces, but increases runoff.
Urbanisation causes storm drains accelerate flow to rivers – shorter lag times and higher flood peaks.
Green roofs and Sustainable Urban Drainage Systems (SUDS) → use grass and soil to reduce the amount of impermeable surfaces, helping to tackle urban flooding problems in some cities.
Changes in the water cycle over time to include human impact: water abstraction
Water abstraction → water removed from stores for human use e.g., agriculture:
Reduces the volume of water in surface stores e.g., lakes.
It can lower water tables and reduce base flow in rivers.
Water abstraction increases in dry seasons e.g., water needed for irrigation.
Human abstraction from aquifers as an output to meet water demands is often greater than inputs into the aquifer – decline in global long-term water stores.
Global distribution, and size of major stores of carbon: lithosphere
Amount → 99.983% of total carbon
Forms of carbon → the largest of the carbon stores, as sedimentary rocks contain carbon such as limestone (calcium carbonate), hydrocarbons (fossil fuels) and marine sediments from shells and marine skeletons.
Carbon is this store can be released by volcanic eruptions and combustion of fossil fuels.
Residence time → 240-300 million years.
Global distribution, and size of major stores of carbon: hydrosphere
Amount → 0.0076% of total carbon
Forms of carbon → 90% of oceanic carbon is dissolved as bicarbonate, with carbonate ions and dissolved CO2 also found in oceans, rivers and lakes.
Majorly found in the Pacific Ocean as it has the largest capacity.
Enters through diffusion from the atmosphere.
Residence time on the surface → 25 years.
Residence time in the deep → 1250 years.
Global distribution, and size of major stores of carbon: cryosphere
Amount → 0.0018% of total carbon
Forms of carbon → frozen ground (permafrost) of tundra and arctic regions contains plant material, as well as ice caps.
Residence time → 1000’s of years, but ice cores show millions of years.
But global warming is threatening the release of carbon from melting ice caps and glaciers around the world.
Global distribution, and size of major stores of carbon: biosphere
Amount → 0.0012% of total carbon
Forms of carbon → living plants and animals, including marine and aquatic life, as well as soils and dead organic matter.
Deforestation and land-use changes affect this store.
Residence time → 18 years – carbon constantly cycled via photosynthesis.
Global distribution, and size of major stores of carbon: atmosphere
Amount → 0.0015% of total carbon
Forms of carbon → mainly as carbon dioxide CO2 and methane CH4.
Concentrations vary due to seasons, emissions, vegetation cover.
Links to greenhouse effect – more atmospheric carbon → more trapped infrared radiation → warming.
Residence time → 6 years.
Photosynthesis
Photosynthesis → the process by which plants, algae, and some bacteria convert carbon dioxide (CO₂), water (H₂O), and sunlight into glucose (C₆H₁₂O₆) and oxygen (O₂).Its role is to remove CO₂ from the atmosphere, storing carbon in biomass.
In addition, it drives primary productivity, influencing carbon sequestration in ecosystems.
Photosynthesis at a seral scale (the stages of vegetation succession and can relate to specific environments)
Temporal variation:
Early seral (pioneer) stage → photosynthesis is low due to limited vegetation e.g., lichens, mosses.
Mid-seral stage → photosynthesis increases as grasses, shrubs and small trees establish.
Climax community → high and stable photosynthesis due to dense plant cover.
Spatial variation:
Hydrosere (water-based succession) → higher initial photosynthesis due to aquatic plants – increases and wetland forests develop.
Psammosere (sand dune succession) → low photosynthesis initially as sand is nutrient-poor – increases at organic matter accumulates.
Lithosere (rock succession) → very slow photosynthesis initially – increases as soil forms eventually.
Photosynthesis at a continental scale (the scale of an entire continent, including biomes, climates and ecosystems)
Temporal variation:
Temperate regions (Europe) → high photosynthesis in summer, low in winter – trees lose leaves in winter from deciduous trees, lowering rates.
Climate change → large scale deforestation e.g., Amazon, reduces continental scale photosynthesis.
Urbanisation → increased droughts in some areas e.g., the Sahel, reduce photosynthesis due to water stress.
Global warming → temperate regions are increasing in warmth, extending growing seasons and increasing photosynthesis.
Spatial variation:
Tropical biomes → highest photosynthesis rates – due to constant sunlight, warm temperatures and high precipitation.
Tundra and polar regions → extremely low photosynthesis due to cold temperatures and short growing seasons.
Altitude → higher elevations have limited photosynthesis – due to lower temperatures and reduces atmospheric CO2 available.
Respiration
Respiration → where organisms break down glucose (C₆H₁₂O₆) to release energy, producing carbon dioxide (CO₂) and water (H₂O) as by-products.
Respiration can occur aerobically which involves the requirement of oxygen and so releases more energy.
But, in low-oxygen environments anaerobic respiration occurs, producing less energy and sometimes methane.
Its role is to return CO₂ to the atmosphere and balance photosynthesis.
Respiration at a seral scale
Temporal variation:
Early seral stage → respiration is low due to limited biomass (few organisms present).
Mid-seral stage → respiration increases from plant growth – increases in organic matter lead to greater decomposition rates, increasing microbial respiration.
Climax community → respiration is high and stable from balanced carbon inputs from photosynthesis and outputs from respiration – as animals become present at this stage, animal respiration contributes significantly.
Spatial variation:
Hydrosere → low oxygen levels means dominant anaerobic respiration – shifts to aerobic as soil forms.
Psammosere → harsh conditions mean initial low respiration – but, increases as soil fertility improves.
Lithosere → slow biomass development limits respiration.
Microclimate effects → warmer, wetter areas within an ecosystem tend to have higher respiration rates.
Respiration at a continental scale
Temporal variation:
Occurrence → respiration occurs continuously as it’s a vital process for organisms – unlike photosynthesis which stops at night.
Daily cycles → respiration is often higher at night in plants – lack of photosynthesis doesn’t replace carbon levels.
Seasonal cycles → higher rates in summer from warmer temperatures and greater biological activity – low in winter as cold temperatures slow rate, especially in temperate and boreal regions.
Climate change → rising global temperatures increases respiration rates, leading to more CO2 release.
Spatial variation:
Tropical biomes → high respiration due to warm, moist conditions and rapid decomposition.
Polar and tundra regions → low respiration due to permafrost and limited biological activity.
Altitude → higher elevations have lower respiration due to cooler temperatures and thinner air.
Topography → valleys with more moisture and organic matter have higher rates.
Decomposition
Decomposition → a process by which dead organic material (plants, animals, and microorganisms) is broken down, releasing CO₂, methane, nutrients, and organic matter into the ecosystem.
Micro-organisms (bacteria & fungi) and detritivores (worms, insects) are key decomposers.
Its role is to return carbon stored in organic matter to the atmosphere – also releases nutrients into soils, supporting plant growth.
Decomposition at a seral scale
Temporal variation:
Early seral stage → decomposition rates are low due to minimal organic matter – decomposers begin to break down species like lichens and mosses when they die.
Mid-seral stage → organic matter accumulates and plant and animal biomass grows – increases decomposition rates.
Climax community → high rates from abundant organic material – thick leaf litter layers support fungal and bacterial decomposition.
Spatial variation:
Hydrosere → slower decomposition in anaerobic conditions e.g., wetland produce methane instead of CO2.
Psammosere → initially slow rates due to poor soil and low organic content – increases as humus accumulates.
Microclimate effects → wind-exposed sites may see slower rates due to drying out.
Decomposition at a continental scale
Temporal variation:
Diurnal cycles → decomposition is continuous but may slow at night – cooler temperatures.
Seasonal cycles → lower rates in winter as cold temperatures slow microbial processes – but high in summer where high microbial activity accelerates decomposition.
Climate change → melting permafrost releases stored organic carbon – increases microbial activity and methane emissions.
Spatial variation:
Tropical biomes → highest rates from constant warmth and high humidity.
Boreal and polar regions → very low due to permafrost and cold temperatures.
Deserts → very low rates from extreme dryness and low microbial activity.
Topography → wet, lowland areas e.g., peat bogs have anaerobic decomposition, leading to methane production.
Combustion
Combustion → the process of burning organic material (biomass or fossil fuels), releasing carbon dioxide (CO₂), water (H₂O), and energy into the atmosphere.
Combustion can be natural from wildfires or extreme heat – can also be anthropogenic from slash-and-burn agriculture or fossil fuel combustion.
Its role is to release stored carbon from vegetation.
Combustion at a seral scale
Temporal variation:
Early seral stage → low combustion risk from minimal vegetation cover – fires are also small-scale / rare due to little organic matter to burn.
Mid-seral stage → more shrubs and young trees provide fuel for wildfires – fires may reset succession, allowing fire-adapted species to thrive.
Climax community → high combustion risks depending on the ecosystem type – but large amounts of stored carbon mean intense fires can have major impacts.
Spatial variation:
Hydrosere → fires are rare due to high moisture – but, drying wetlands can experience intense, long-burning fires, releasing stored carbon.
Psammosere → low combustion risk due to sparse vegetation, but dry grasses can be flammable.
Lithosere → initial minimal fire risk – increase as soil and plant cover develop.
Microclimate effects → wind-exposed areas experience more frequent fires – but humid zones suppress combustion.
Combustion at a continental scale
Temporal variation:
Daily cycles → combustion risk is higher in the day from high temperatures and lower humidity – cooler temperatures at night.
Dry season → fire risk increases e.g., California wildfires in Summer and Autumn.
Climate change → melting permafrost can expose organic matter to combustion.
Human activity → deforestation fires release significant CO₂ into the atmosphere.
Spatial variation:
Tropical biomes → high combustion rates due to deforestation fires.
Boreal and polar regions → combustion risks increasing due to the environment warming and conditions becoming drier.
Altitude → mountainous regions may have variable fire risks – higher elevations being wetter and low elevations being drier.
Topography → coastal regions often have lower fire risk due to higher humidity levels
Carbon sequestration in oceans and sediments
Carbon sequestration → the process of capturing and storing atmospheric carbon dioxide (CO₂) in natural sinks, including oceans and sediments.
Types of carbon sequestration:
Biological sequestration → marine organisms absorb CO2 and convert it into organic material e.g., phytoplankton or corals.
Physical sequestration → CO₂ dissolves into ocean water and is transported to deep waters through thermohaline circulation.
Geological sequestration → over time, carbon accumulates in ocean sediments and is buried, forming carbonate rocks e.g., limestone.
Its role is to act as a carbon sink as oceans absorb 25-30% of global CO₂ emissions.
The role of sediment is to store carbon long-term, locking it away for millions of years.
Carbon sequestration in oceans and sediments at a seral scale
Temporal variation:
Early seral stage → low sequestration as marine productivity is low. And minimal biomass, so less carbon is stored in sediments.
Mid-seral stage → increased sequestration as ecosystems grow e.g., coral reefs, seagrass meadows.
Climax community → high rates from well-established food webs – coral reefs and deep-sea ecosystems store significant carbon – some of which is permanently buried in sediments, forming limestone over millions of years.
Spatial variation:
Coastal wetlands (mangroves, salt marshes) → very high sequestration rates due to dense vegetation and sediment trapping.
Deep ocean basins → capture sinking organic carbon – long-term burial.
Tropical vs polar waters → cold water absorbs more CO2, warm releases more.
Sediment composition → muddy sediment traps more carbon than sandy/rocky sea beds.
Carbon sequestration in oceans and sediments at a continental scale
Temporal variation:
Seasonal cycles → higher rate in spring/summer as more sunlight increases phytoplankton growth and carbon uptake – winters reduce biological activity.
Global warming → oceans warming reduces CO2 solubility, lowering sequestration efficiency.
Human activity → overfishing and habitat destruction reduce marine carbon storage capacity.
Spatial variation:
Tropical oceans → less CO2 uptake due to warm ocean temperatures, but coral reefs store carbon in calcium carbonate.
Continental shelves → high rate due to high productivity and sediment deposition.
Weathering
Weathering → the breakdown of rocks and minerals at or near the Earth’s surface due to physical, chemical, or biological processes
Its role is to remove atmospheric CO2 and store it in oceans and sediments.
Its role involves long-term storage – over millions of years, dissolved carbon is buried as limestone in oceans sediments.
Weathering at a seral scale
Temporal variation:
Early seral stage → limited weathering as exposed rock surface have little biological activity and growth – physical weathering dominates due to freeze-thaw cycles and wind erosion.
Mid-seral stage → chemical weathering increases due to increased organic acid production from decaying vegetation.
Climax community → high biological weathering as dense vegetation and plant roots break down rocks.
Spatial variation:
Hydrosere → high chemical weathering due to water-rock interactions.
Psammosere → low chemical weathering but high wind erosion.
Lithosere → initial slow weathering, but accelerates as vegetation establishes.
Microclimate → north-facing slopes are cooler and wetter = more chemical weathering – south-facing slopes are warmer and drier = favour physical weathering.
Weathering at a continental scale
Temporal variation:
Daily cycles → physical weathering e.g., freeze-thaw is more active in areas with significant day-night temperature fluctuations.
Seasonal cycles → higher physical weathering in winter and more chemical weathering in wet seasons due to increased rainfall and acid formation.
Climate change → glacial retreat exposes fresh rock surfaces, increasing rates.
Spatial variation:
Tropical regions → high biological weathering due to warm, humid conditions.
Glacial areas → high freeze-thaw weathering when glaciers retreat.
Limestone regions → extreme carbonation weathering – leads to features like caves and sinkholes.
Changes in the carbon cycle over time, to include natural variation: wildfires
Wildfires transfers carbon from biosphere to atmosphere as CO2 is released as burning – wildfires can clear a lot of vegetation.
Short-term impacts on the carbon cycle:
Burning biomass and organic matter leads to rapid releases of CO2.
Loss of vegetation reduces photosynthesis, leading to less carbon sequestration.
Soot and ash can darken ice surfaces – reduces albedo and contributes to global warming.
Long-term impacts on the carbon cycle:
Fire-adapted ecosystems e.g., savanna & boreal forests, regrow quickly, reabsorbing CO2.
Charcoal (biochar) can store carbon in soils for centuries, acting as a long-term sink.
Changes in the carbon cycle over time, to include natural variation: volcanic activity
Volcanic eruptions are a long-term carbon source, but are minor contributors compared to human activity.
Short-term impacts on the carbon cycle:
Volcanic eruptions release CO2 and SO₂ (sulphur dioxide) into the atmosphere.
Ash clouds can cool the climate temporarily by reflecting solar radiation e.g., Mount Pinatubo, 1991.
Long-term impacts on the carbon cycle:
Tectonic uplift exposes new rock surfaces, increasing chemical weathering, which removes CO2.
Over millions of years, volcanic activity replenishes atmospheric CO2, maintaining the balance of the carbon cycle.
Changes in the carbon cycle over time, to include human impact: hydrocarbon fuel extraction and burning
The burning of fossil fuels is the largest contributor to anthropogenic CO2 emissions.
Short-term impacts on the carbon cycle:
Releases large amounts of CO2 that were previously locked in geological stores (coal, oil, gas) – higher atmospheric CO2 concentration disrupts the natural balance.
Long-term impacts on the carbon cycle:
CO2 remains in the atmosphere for hundreds to thousands of years, enhancing the greenhouse effect.
More CO2 acidifies oceans – reduces efficiency of oceanic carbon sequestration.
Changes in the carbon cycle over time, to include human impact: farming practices
Agriculture disrupts carbon storage in soils and increases greenhouse gas emissions.
Impacts on the carbon cycle:
Ploughing and soil degradation release stored soil carbon (humus) into the atmosphere.
Overgrazing and monoculture farming reduce carbon storage capacity in soils.
Cattle farming produces methane, a greenhouse gas 25x more potent than CO2.
Use of nitrogen-based fertilizers increases soil respiration and enhances CO₂ release.
Changes in the carbon cycle over time, to include human impact: deforestation
Deforestation reduces the planet’s ability to absorb CO2, contributing to carbon cycle imbalance.
Short-term impacts on the carbon cycle:
Burning or clearing forests releases massive amounts of CO2 into the atmosphere – loss of vegetation reduces carbon uptake through photosynthesis.
Long-term impacts on the carbon cycle:
Permanent deforestation e.g., Amazon lowers carbon sequestrations.
Soil carbon is lost due to erosion and degradation – increasing emissions.
Changes in the carbon cycle over time, to include human impact: land use changes
Expanding cities and industries contribute to carbon emissions and reduce sequestration.
Impacts on the carbon cycle:
Urbanisation replaces carbon-absorbing vegetation with concrete and asphalt.
Cement manufacturing releases CO2 as limestone (CaCO₃) is heated to form lime (CaO).
Transport and energy demands in cities increase fossil fuel combustion.
The carbon budget
The carbon budget → the amount of carbon stored and transferred within the carbon cycle on a global or local scale
The budget includes carbon emissions by various processes e.g., burning fossil fuels, against natural or human sequestration.
Calculated using a carbon footprint calculator and is expressed in gigatonnes of carbon dioxide equivalent per year (GtC/yr).
One GtC is a billion (1,000,000,000) tonnes.
The IPCC has estimated the carbon budget that would hold the global average temperature at 2°C above pre-industrial levels is approx. 800 billion tonnes of carbon.
Factors affecting the carbon budget:
The amount of carbon sinks → e.g., forests, oceans and soils absorb more carbon than they release.
Human activities → e.g., deforestation, burning fossil fuels, impact the budget by increasing emissions and reducing the capacity of natural systems to act as sinks.
Natural processes → e.g., photosynthesis, respiration and decomposition play a role and also have variations in carbon absorption and release.
Impacts of the carbon cycle on land
Soil is made from organic matter and cycled through the carbon system – brings important trace nutrients to assist in further vegetation growth.
Carbon stored in grass provides food for animals e.g., hay, silage etc.
Carbon provides energy in the form of fossil fuels (hydrocarbons) and wood.
Carbon provides a valuable resource in charcoal, diamonds and graphite.
Impacts of the carbon cycle on oceans
Calcium carbonate is derived from carbon – utilised by marine animals to build shells and skeletons.
Plant and animal remains are dropped to the ocean floor and compress into sedimentary rock and hydrocarbons, effectively locking carbon in a long-term cycle.
Phytoplankton utilise CO2 during photosynthesis, which is then transferred along the marine food chain.
Increased levels of CO2 and warming of the oceans has led to algal blooms and blocking of sunlight for photosynthesis by phytoplankton.
Impacts of the carbon cycle on the atmosphere
CO2 in the atmosphere warms the Earth through the natural greenhouse effect.
Increases in carbon emissions has led to the enhanced greenhouse effect – threatens the delicate atmospheric balance.
Carbon is stored by vegetation and act as carbon sinks in the short-term – wildfires and deliberate burning, releases carbon quickly into the atmosphere.
Deforestation disturbs the balance between length and capability of trees to store carbon – removal of trees not only releases carbon, but also reduces the availability of oxygen and water.
The water and carbon cycles stores and cycles are essential for life
Carbon is a fundamental building block of life – all living things contain carbon.
Water is also essential for life – all living things need water to survive.
How the water cycle supports climate and life on earth
Regulation of global temperatures:
Water has a high heat capacity, absorbing and releasing heat slowly, moderating temperature extremes.
Evaporation and condensation transfer heat globally, influencing regional climates.
Precipitation patterns and biome distribution:
High precipitation areas e.g., Amazon, Congo = lush forests (high biodiversity and carbon sequestration).
Low precipitation areas e.g., Sahara, Australian Outback = deserts (dry, low biomass).
Influence on weather systems and extreme events:
More water vapour in the atmosphere increases storm intensity e.g., hurricanes, monsoons.
Droughts and desertification occur when precipitation decreases, reducing agricultural productivity.
Supporting and ecosystem and food production:
Soil moisture and groundwater are essential for plant growth and agriculture.
Oceans and freshwater sources sustain aquatic life and fisheries.
How the carbon cycle supports climate and life on earth
The greenhouse effect and climate stability:
CO₂ and CH₄ trap heat in the atmosphere, keeping Earth at an average temperature of 15°C – without greenhouse gases, Earth would be 33°C colder, making it largely uninhabitable.
Carbon sequestration and climate regulation:
Oceans absorb 30% of human CO₂ emissions, reducing atmospheric CO₂ but leading to ocean acidification.
Forests and soils act as carbon sinks, storing carbon through photosynthesis and organic matter accumulation.
Photosynthesis and primary productivity:
Plants remove CO₂ from the atmosphere and convert it into glucose, supporting food chains.
Carbon is transferred through trophic levels, sustaining herbivores and predators.
Role in soil fertility and agriculture:
Organic carbon in soils improves fertility, supporting crop growth and food security.
Soil carbon storage mitigates climate change, preventing excess CO₂ in the atmosphere.
How Milankovitch cycles supports climate and life on earth
Eccentricity:
If the earth’s orbit is more circular, then the seasonal difference is not a great and this results in a cooler planet.
If the earth’s orbit is elliptical, it creates more seasonal variations leading to climatic extremes of warming or cooling.
Precession and axial tilt:
The greater the precession (wobble) and axial tilt, the greater the climatic extreme of hot or cold.
The relationship between the water cycle and carbon cycle in the atmosphere
Similarities:
An increase in atmospheric CO2 levels can cause higher rates of evapotranspiration from the warming effect on the planet – increases rate of precipitation.
Decomposition releases CO2 and requires the presence of water.
Water can transfer CO2 from atmosphere to lithosphere/hydrosphere (oceans) through precipitation in the form of acid rain – then becomes carbonic acid.
Amazon Rainforest → trees intercept 75% of rainfall and send it back to the atmosphere; they also absorb large amounts of CO2 and store it.
Differences:
Changes in temperatures have different effects - CO2 in atmosphere warms the planet - but increased temperatures effect the processes of the water cycle e.g., evaporation
Positive and negative feedback examples
Positive feedback:
Water cycle: Warmer temperatures → increase evaporation → more water vapour in the atmosphere → enhanced greenhouse effect → further warming.
Carbon cycle: Warmer oceans → reduced CO2 absorption by oceans (due to decreased solubility) → more CO2 remains in the atmosphere → further warming.
Negative feedback:
Water cycle: Higher temperatures → more evaporation → more cloud cover → increased reflection of solar radiation (higher albedo) → cooling effect.
Carbon cycle: Higher CO2 levels → increased plant growth (CO2 fertilisation effect) → more CO2 absorbed by vegetation → reduction in atmospheric CO2.
The role of feedbacks within and between cycles and their link to climate change
Many of these feedbacks amplify global warming (especially positive feedbacks), increasing:
Frequency of extreme weather events.
Changes in precipitation patterns.
Ice melt and sea level rise.
The role of feedbacks within and between cycles and their implications for life on Earth
Desertification:
Desertification → degradation of drylands due to CC and human pressures.
Reduces agricultural productivity → worsens food insecurity e.g., Sahel region.
Positive feedback → loss of vegetation = more warming = more desertification.
Coral bleaching:
Coral bleaching → breakdown of the symbiotic relationship between coral and algae due to ocean warming.
Coral reefs support 25% of all marine life – bleaching leads to ecosystem collapse and tourism loss e.g., the Great Barrier Reef.
Marine biodiversity decline reduces potential for future medicine and science.
Coastal protection lost → higher vulnerability to coastal erosion and storm surges.
Ocean acidification:
Ocean acidification → excess CO₂ dissolving into oceans, forming carbonic acid.
Threatens livelihoods of millions who depend on fishing e.g., SE Asia.
Reduces carbon sequestration efficiency of the ocean – weakened biological pump.
Impacts entire marine food web, starting with plankton and shellfish.
Human interventions in the carbon cycle designed to influence carbon transfers and mitigate the impacts of climate change: renewable energies and changing rural land use
Renewable energies:
Wind farms → create energy from renewable energy flow.
Hybrid car engine → greatly increases the mpg of the vehicle and reduces CO2 emissions.
Decreases atmospheric CO₂ by replacing coal, oil, and gas in power generation → contribute to long-term decarbonisation of national energy supplies.
E.g., 75% Sweden’s electricity was powered by oil in the 1970s – now only 20%.
But, high initial investment, intermittency (e.g. windless or cloudy days), and land use conflicts.
Changing rural land use:
Afforestation → creates a natural carbon sink and helps increase biomass density and therefore carbon density, above and below ground.
Protection → protecting existing forests will preserve current soil carbon stocks.
Avoidance of overstocking of grazing animals → e.g., cows farting increase CO2.
Using improved crop varieties → increases productivity above and below ground, as well as increasing crop residues, thereby enhancing SOC (soil organic carbon).
But, needs long-term land use change, funding, and farmer incentives.
Human interventions in the carbon cycle designed to influence carbon transfers and mitigate the impacts of climate change: carbon capture and storage and political initiatives
Carbon capture and storage:
CCS → CO2 is sequestered from the atmosphere using giant scrubbers and then liquefied.
Liquid CO2 is then pumped back into the geological reservoir e.g., a depleted oilfield – then this carbon is securely stored underground.
CCS could make an enormous difference to emission from coal/oil/gas fired power stations – up to 90% reduction.
Helps decarbonise existing fossil fuel infrastructure.
But, expensive, energy-intensive, and not yet widely deployed at scale.
Political initiatives:
Political initiatives such as COP21 → trying to ensure that nations work together to reduce carbon emissions.
Global treaties e.g., Paris Agreement (2015) → aim to limit global warming to well below 2°C.
Cap-and-trade schemes e.g., the EU ETS → set limits on emissions and allow trading of carbon credits.
National and regional policies e.g., UK's net zero by 2050 target → promote long-term planning.
But, enforcement, international cooperation, and political will vary widely.
Human interventions in the carbon cycle designed to influence carbon transfers and mitigate the impacts of climate change: improved aviation practices
Improved aviation practices:
According to the Air Transport Action Group, in 2019 the global aviation industry carried 4.5 billion passengers, producing 915 million tonnes of CO2.
Maximising the number of seats per aircraft → reduces the number of trips needed to transfer passengers.
Increased engine efficiency and lighter aircraft development → reduce the fuel consumption per trip.
Operational changes → direct flight paths, reduced taxiing, better air traffic control.
Shift toward sustainable aviation fuels e.g., biofuels, synthetic fuels.
But air travel demand is rising globally; sustainable fuels are still costly and not widely available.