finding and appraising systematic reviews and meta-analyses
1/47
There's no tags or description
Looks like no tags are added yet.
Name | Mastery | Learn | Test | Matching | Spaced | Call with Kai |
|---|
No study sessions yet.
48 Terms
umbrella review
review of reviews
systematic review ± meta-analysis
in depth review of primary studies and quantitative combination of results
scoping review
review of primary studies in an evolving field of knowledge
explores breath vs depth
narrative/literature review
selective summation of evidence with less rigor
rapid review
type of systematic review with streamlined methods and shorter time for exigencies
critical review
often focused on methodology; critique of existing research
qualitative systematic review
synthesize qualitative studies
mixed methods review
combines the synthesis of quantitative and qualitative studies
a good SR w/w/o MA
represents a high level of evidence for treatment interventions
provides thorough review, few biases, few threats to internal validity
produces a more powerful and informative result than any single study
gold standard for best scientific evidence
poor/bad systematic review
flaws in analysis and conclusion, not reliable
why combine study results in SR/MA
limitations of a single study (low statistical power, reduced precision, reduced external validity)
recruiting a large sample in a single study is expensive and difficult
combining similar small studies in a meta-analysis may provide greater confidence in determining if a treatment is effective or not—improve credibility, generalizability, reduce uncertainty
finding SRs
pubmed for more extensive and effective search
pedro for quick, less extensive, but effective search
GS when you need a quick check
pubmed GPT when extremely busy
boolean operators for pubmed and GS
conjunction words used to connected keywords when implementing search
used to broaden or narrow searches
or, and
not boolean operators
parenthesis to nest keywords that are synonyms within same concept
use commas to search for exact phrase in GS, * for wildcards to include variations of same word stem (GS)
things to look out for in a SR abstract
applicability: focused questions asked, condition focused
confidence: identified databases, quality of included studies is assessed
clinical meaningfulness: CIs of results
google scholar search
reliability of citations not on same level with other databases like pubmed and pedro
pubmed gpt
does not use keywords
need focused and well-crafted statement
be explicit with prompts (all PICO keywords included) and add filters as necessary
were the SR review methods (inclusion/exclusion criteria) determined prior to conducting review and is this publicly available, including subsequent changes in the protocol?
addresses transparency of methods & results
did the investigators provide details regarding their search and study selection methods?
extensive database search?
PRISMA flow diagram?
addresses potential for selection bias
did the investigators describe the methods/processes and tools used to assess the quality of individual studies?
peer reviewed? did more than 1 author evaluate the retrieved citations for eligibility criteria, data extraction, SB, PB, ROB?
validity of tools
did the investigators provide details about the studies included in the review?
addresses ned to interpret review’s results in the context of individual studies and their quality ratings
study characteristics ex. publication year, sample sizes, design etc
individual study results relevant to overall estimates
did the authors address publication bias? (non reporting/reporting bias)
addresses need to interpret review’s results in the context of the potential problem of publication bias (inherent research problem where significant/favorable findings are more likely to be published)
reporting bias vs publication bias
author based vs journal/publisher based
how do researches evaluate/mitigate publication bias
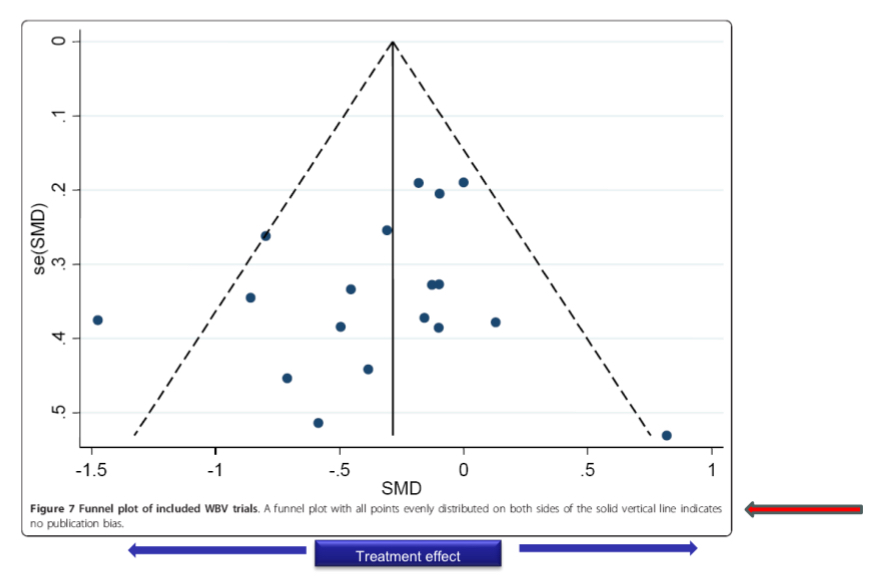
funnel plots, statistical tests, mitigation
funnel plots
graphical eval of publication bias
asymmetrical plot=potential bias
statistical tests
statistical eval
egger’s test
begg’s test
stats eval of asymmetry in funnel plots
mitigation
grey literature: use of non peer reviewed studies to extensively explore unpublished data
conference abstracts, thesis/dissertations and pre-prints
meta analysis
statistical synthesis of the data from multiple studies that address the same question
results in a pooled result from combined studies: quantitative statistical analysis
compares 1 intervention to another to see which is better (standardized mean difference/effect size, relative risk)
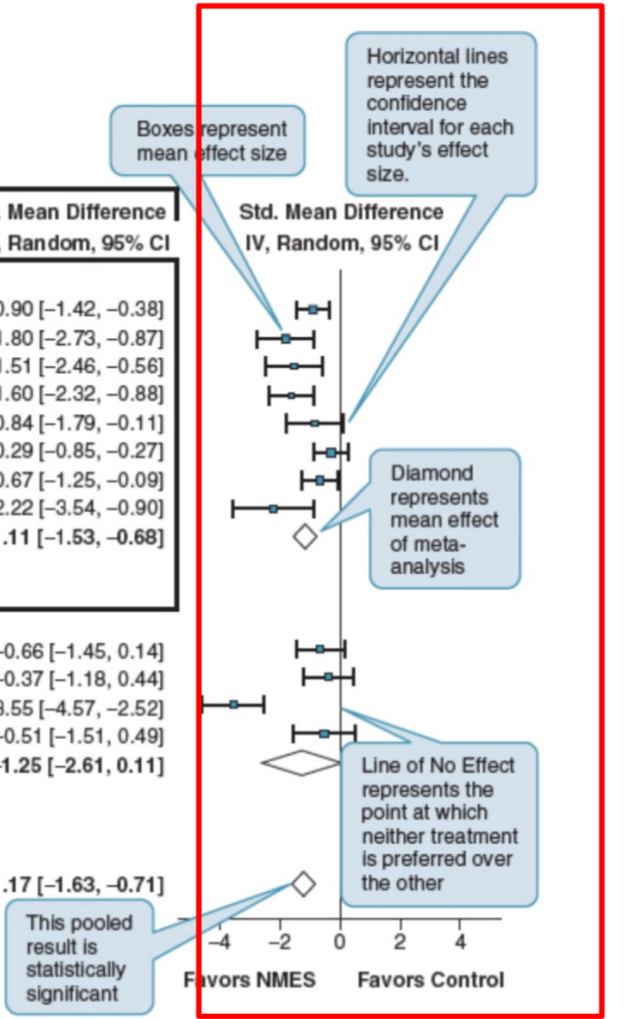
commonly presented as forest plot
fixed effect meta anlysis model
minimal statistical heterogeneity presumed prior
random effect meta analysis model
high/significant stat heterogeneity presumed (or regardles) a more conservative/rigorous modeling to pool standardized effect estimate
standardized mean difference/effect size
continuous data
often used but may also be calculated as weighted mean diference of correlation c oefficient
does the CI range include the value which indicates no change (line of no effect)?

interpreting standardized effect size results for continuous data
general classification for standardized ES (cohen’s d)
>0.8=large
0.5-0.8=moderate
0.2-0.49=small
<0.2=none/trivial
correlation coefficient
similar interpretation for general correlations ranging from -1 to +1
relative risk effect size (dichotomous data)
risk ratio
compares rate of an event in one group to another
ORs may be u sed in some reviews
des the Ci range include the value which indicates no change?

meta analysis & effect sizes
not based on a count of statistically significant results
combines ES from individual studies rather than looking at p-values
heterogeneity
are the studies too dissimilar to be combined?
homogeneity
are the studies similar enough to be combined?
test of heterogeneity
sources: clinical, methodological, statistical
statistical heterogeneity=heterogeneity
follow common sense/qualitative test
does pooling of studies make sense considering invention and outcomes?
ways to check for statistical heterogeneity among study results
visual: examine forest plots
statistical
visual evaluation of heterogeneity
forest plots
are study results similar in direction and magnitude?
do CIs of study overlap more closely with each other and the pooled estimate?
statistical evaluation of heterogeneity
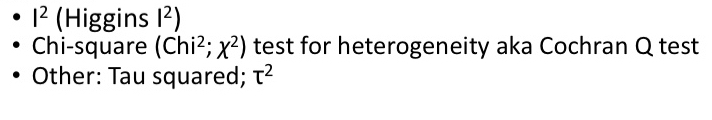

uses proportions to quantify heterogeneity
0-25%: low heterogeneity; variability among studies likelly due to chance (desired)
25-75%: moderate; suggests some variability; validity of pooled estimate questionable but may be fair and acceptable if ~50% and appraised in context of other factors
75-100%: high; considerable enough to invalidate pooled estimate, need for caution w/ pooled results
chi square
does not quantify heterogeneity
uses p value
statistically significant p value of <0.05/0.01 may be used to suggest presence of heterogeneity
>/=0.05 is :)
vote counting
non statistical summary of study results
qualitative summary
sensitivity analysis/testing
secondary analysis with poor quality (suspect) studies removed or added
look to see if pooled result changes
if pooled result changes=less valid results
subgroup analysis
aka moderation analysis (not sensitivity analysis)
see if pooled result changes based on specific variables of interest; esp prog variables of clinical relevance (sex, age group, pre existing conditions)
doesn’t validate/invalidate overall pooled ES, but customizes findings to fit context
pooled effects may vary by sex, INT effects may be less/not significant for certain groups
fixed effect model
applies when studies in SR based on same population
any interference from MA is to this 1 population
assumes that true effect of tx=same value in each study (fixed)
differences among studies solely due to random variability w/in study variation and studies are fxlly equivalent, no statistical heterogeneity
ignores statistical heterogeneity
studies w/ larger sample sizes given more weight in calculation of MA
random effects model
applies when studies in SR represent larger universe of comparable studies
assumes tx effects vary around overall avg tx effect
differences among studies due to heterogeneity and random variability (w/in study variation)
interference from MA is to comparable populations
when heterogeneity exists, relatively more weight given to smaller studies in calc of MA
most appropriate when studies pulled from literature