ch. 3, descriptive stats
1/14
There's no tags or description
Looks like no tags are added yet.
Name | Mastery | Learn | Test | Matching | Spaced |
|---|
No study sessions yet.
15 Terms
central tendency
a single score that defines the centre of a distribution
this measure is intended to be the most representative score for your group
list 3 measures of central tendency
mean
median
mode
mean
average score of the group. add all the scores divided by the number of scores
mean is best used for
interval/ration data - because each score contributes to the mean
when is mean not useful
in data sets with extreme scores
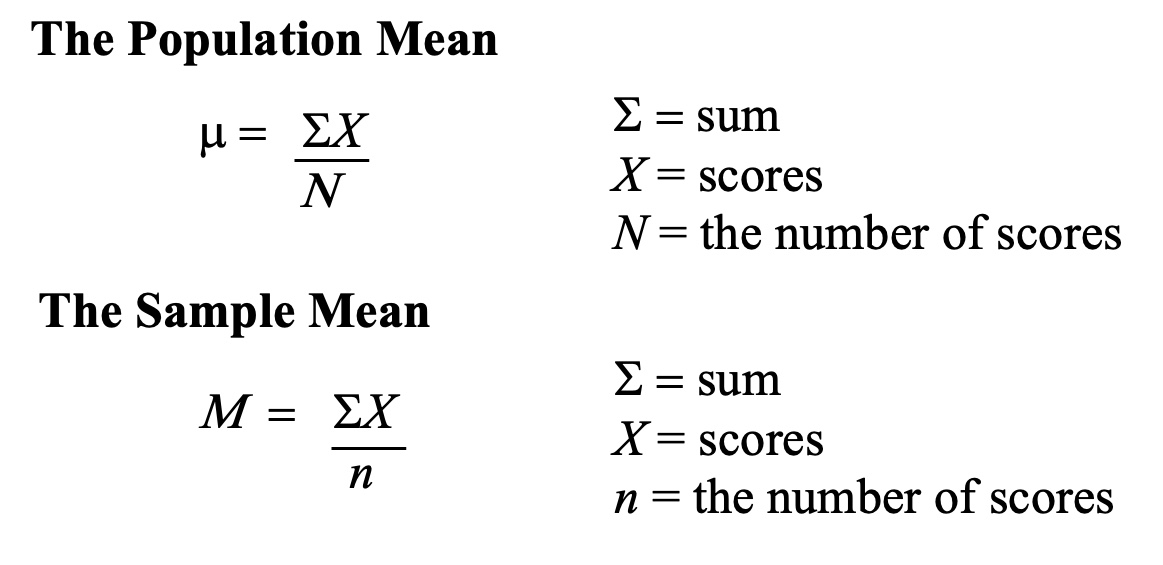
2 symbols for means
M or x̄ = used for sample data
μ = used for population means
how do we calculate the mean?
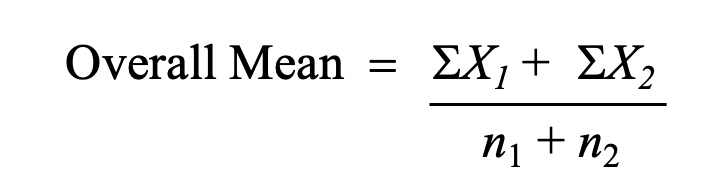
calculation for weighted mean
median
the middle score/ mid point. it divides the scores into 2 equally sized groups
4 things median is used for
extreme scores
undetermined values (such as participants who cannot finish a task in the time alloted)
open ended scores
ordinal scales
calculating media for even and odd scores
calculating for odd scores: order the scores from smallest → largest, the middle score is the median
calculating for even # of scores: find the two middle scores & take the average (add then divide by 2)
mode
the score or category that has the highest frequency (most frequent score)
mode is often used for
nominal scales
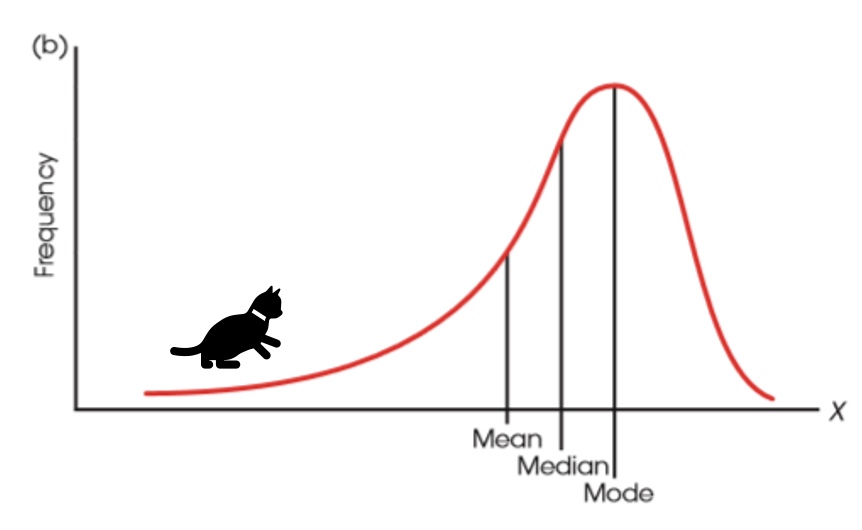
draw the curve for positively skewed data
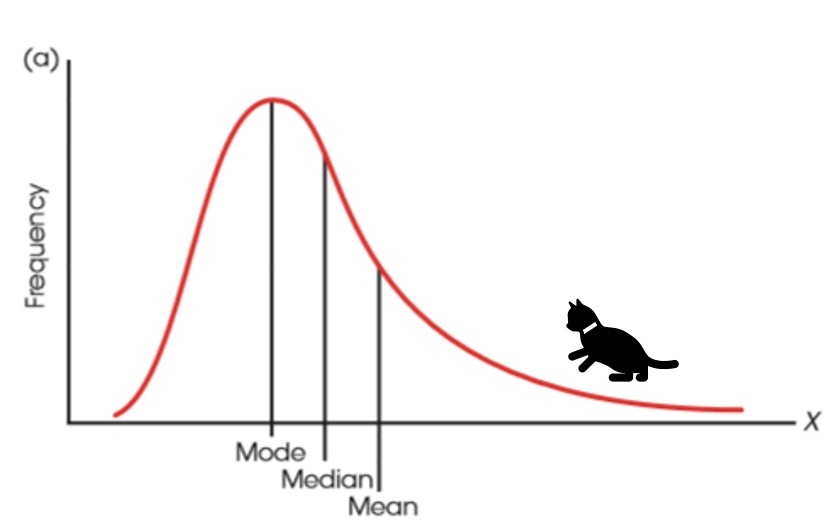
draw the curve for negatively skewed data