AP Unit 1-Exploring One Variable Data Vocabulary
1/60
There's no tags or description
Looks like no tags are added yet.
Name | Mastery | Learn | Test | Matching | Spaced | Call with Kai |
|---|
No study sessions yet.
61 Terms
Variable
a characteristic that changes from one individual to another
categorical variable
takes on values that are category names or group labels
quantitative variable
one that takes on numerical values for a measured or counted quantity
How to represent categorical data?
use frequency or relative frequency tables
Frequency table
gives the number of cases falling into each category
relative frequency table
gives the proportion of cases falling into each category.
Describe categorical data represented in frequency or relative tables.
Percentages, relative frequencies, and rates all provide the same information as proportions.
What can represent categorical data graphically
Bar charts, bar graphs
Classify types of quantitative variables
A discrete variable and a continuous variable can take on a countable number of values. The number of values may be finite or countably infinite, as with the counting numbers.
discrete variable
can take on a countable number of values. The number of values may be finite or countably infinite, as with the counting numbers.
continuous variable
can take on infinitely many values, but those values cannot be counted. No matter how small the interval between two values of a continuous variable, it is always possible to determine another value between them.
What Represent quantitative data graphically?
histograms, stem and leaf plot, dot-lot
Describe the characteristics of quantitative data distributions.
shape, center, and variability (spread), outliers, gaps, clusters, or multiple peaks.
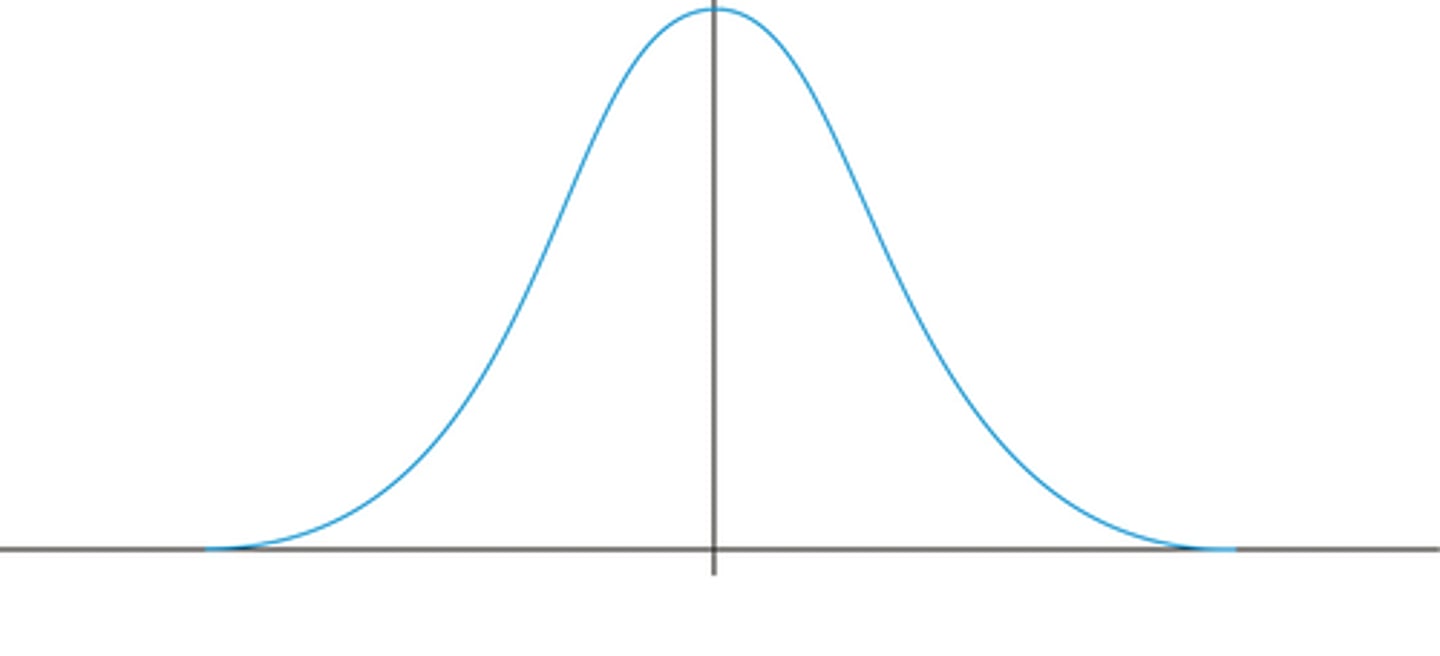
unimodal
one main peak
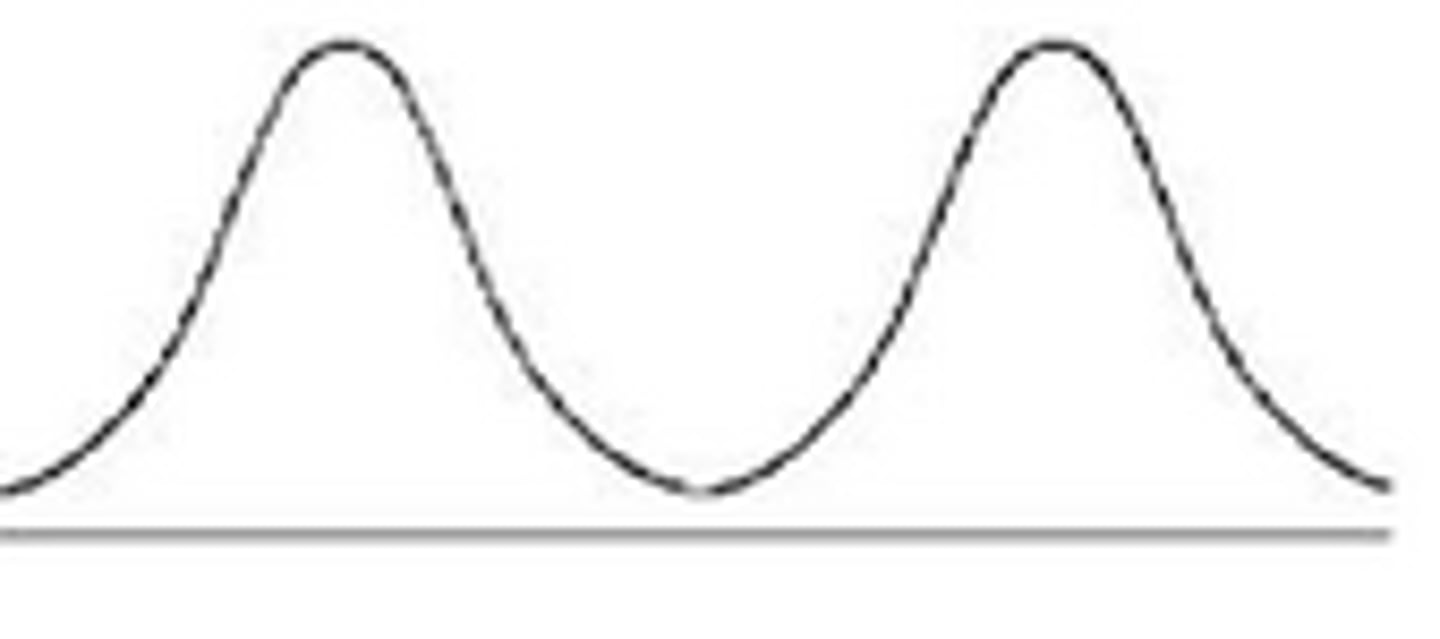
bimodal
two peaks
Statisitcs
a numerical summary of sample data
What are the three common measures of variability or spread in a distribution?
range, interquartile range, and standard deviation.
How to find IQR
Q3-Q1
What is s^2?
sample variance
What are two ways to find outliers?
Q1-1.5(IQR)
Q3+1.5(IQR)
An outlier is a value located 2 or more standard deviations above, or below, the mean.
Why are the mean, standard deviation, and range considered nonresistant?
they are influenced by outliers
Why are the median and IQR are considered resistant?
outliers do not greatly (if at all) affect their value
What do the outliers affect?
the mean, standard deviation, and range
What do the outliers not affect the values?
median and IQR
What is the five number summary?
minimum, Q1, median, Q3, maximum
If the distribution is relatively symmetric, then the mean and median are what?
close to each other
If a distribution is skewed right, then the mean is usually what?
to the right of the median.
If the distribution is skewed left, then the mean is usually to the what?
the left of the median.
What can be used to compare two or more independent samples on center, variability, clusters, gaps, outliers, and other features
histograms, side-by-side boxplots
parameter
a numerical summary of a population
normal distribution
A function that represents the distribution of variables as a symmetrical bell-shaped graph.
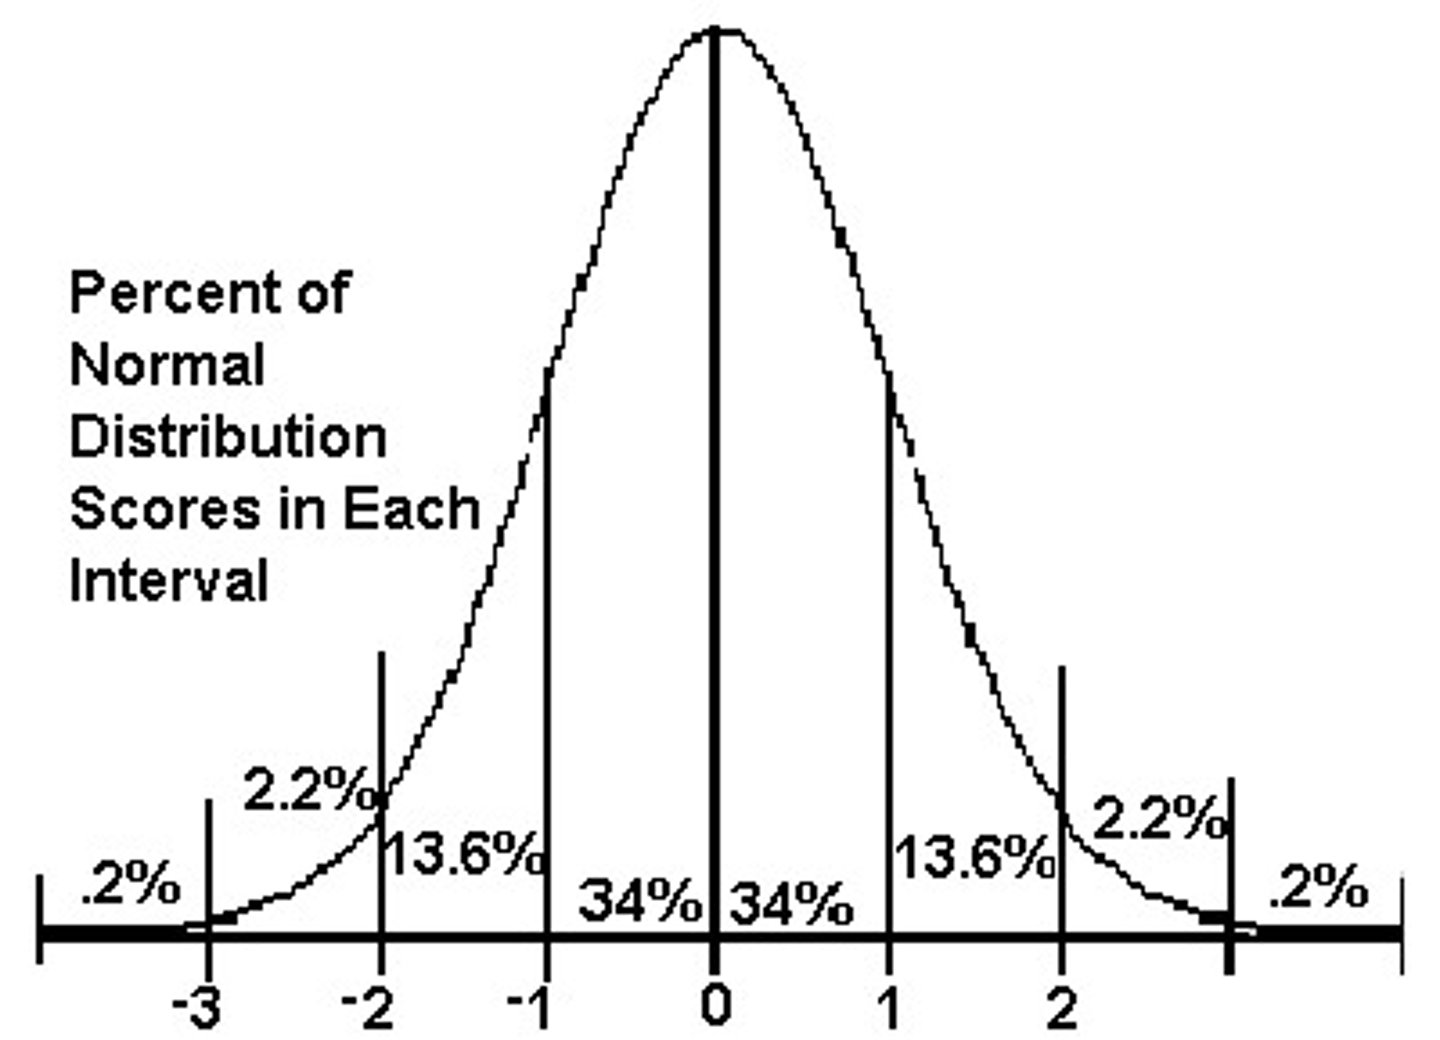
What are the standard deviations percentages in a normal distribution?
68%, 95%, 99.7%
Define z-score
measures how many standard deviations a data value is from the mean.
z score formula
z=(x-mean)/standard deviation
IQR is ALWAYS a ____ value
single
When the shape of the distribution is approximately normal, describe SOCS
Shape: Approximately/fairly symmetric
Outliers: Q1-1.5(IQR)
Q3+1.5(IQR)
Center: Mean
Spread: Standard Deviation
When the shape of the distribution is approximately skewed left, describe SOCS
Shape: Approximately skewed (strongly) left
Outliers: Q1-1.5(IQR)
Q3+1.5(IQR)
Center: Median
Spread: IQR
When the shape of the distribution is approximately skewed right, describe SOCS
Shape: Approximately skewed (slightly) right
Outliers: Q1-1.5(IQR)
Q3+1.5(IQR)
Center: median
Spread: IQR
Ex. Describe the distribution of # of hours of sleep
3,5,6,6,7,7,7,7,8,8
Shape: The distribution of # of hours of sleep is slightly skewed left
Outliers: (any number below the given answer is an outlier)
Q1-1.5(IQR)
6-1.5(7-6)=4.5
Q3+1.5(IQR)
7+1.5(7-6)=8.5
(4.5 to 8.5 to not be an outlier)
Way to low because 3 is an outlier since 3 is less than 4.5
Center: Median
Median=7
Spread: IQR
7-6=1
association between two variables
correlation; when knowing one affects the other (or helps predict the other)
Mosaic Graphical Effect
the width of each rectangle(bar) is promotional to the # of individuals in the corresponding category
How to find standard deviation on the calculator?
Stats
Calc
1 vars-Stats
Define standard deviation
measures spread by finding he average squared distance of each data value from the mean
Percentiles
p% of the data less than or equal to it
cumulative relative frequency
represents the number or proportion of a data set less than or equal to a given number.
What percentile is Q1?
25th percentile
What percentile is the median?
50th percentile
What percentile is Q3?
75th percentile
When referring to percentiles, we say a value is __ a certain percentile, ___ In a certain percentile
AT, NOT
density curve-area under curve is always =?
1
The Z score is the % to the left or right?
left
Where can you find the z-score?
table A
What is the empirical rule?
68-95-99.7
If a normal probability plot is fairly linear, then the distribution of data is approximately____
normal
A ____tells us what values a variable takes and how often it takes them
distribution
consists of the minimum, Q1, median, Q3 and maximum value of a data set.
5 number summary
If the mean is less than the median in a unimodal distribution, the shape is most likely
skewed right
Two measures of spread are what?
Range, IQR
A relative cumulative frequency plot with areas proportionate to sample size is
mosaic plot
If a data set is approximately Normal,____will be approximately linear.
normal probability
can be used to compare the relative standing of two individuals within their respective distributions.
standardized statistics (z scores)