psychology 2911 - lecture 2 (t-test review)
1/34
There's no tags or description
Looks like no tags are added yet.
Name | Mastery | Learn | Test | Matching | Spaced | Call with Kai |
|---|
No study sessions yet.
35 Terms
If both the independent and dependent variables are numerical, which analysis do you choose?
Linear regression (correlation if cause-and-effect unknown)
- Does the number of coffees you drink per day (independent variable) affect your heart rate (response/dependent variable)?

If the independent variable is numerical and the dependent variable is categorical, which analysis do you choose?
Logistic regression (t-test is not appropriate)
- If the number of cigarettes a person smokes per day (numerical) predicts whether they have a heart attack (categorical with two levels: you either have a heart attack or you don't)
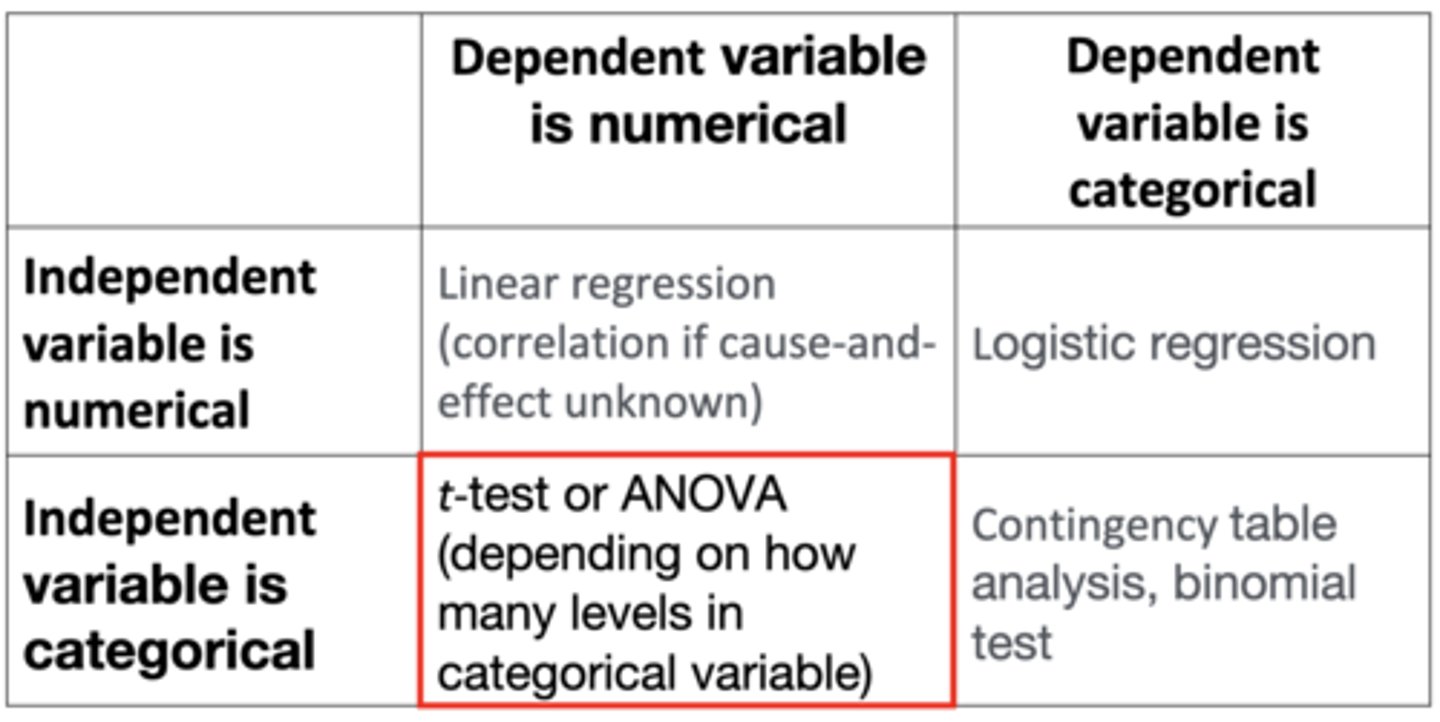
If the independent variable is categorical and the dependent variable is numerical, which analysis do you choose?
t-test or ANOVA (depending on how many levels are in categorical variable)
- Whether gender affects test scores

If both the independent and dependent variables are categorical, which analysis do you choose?
Contingency table analysis, binomial test
- Relationship between parent's eye colour and offspring's eye colour

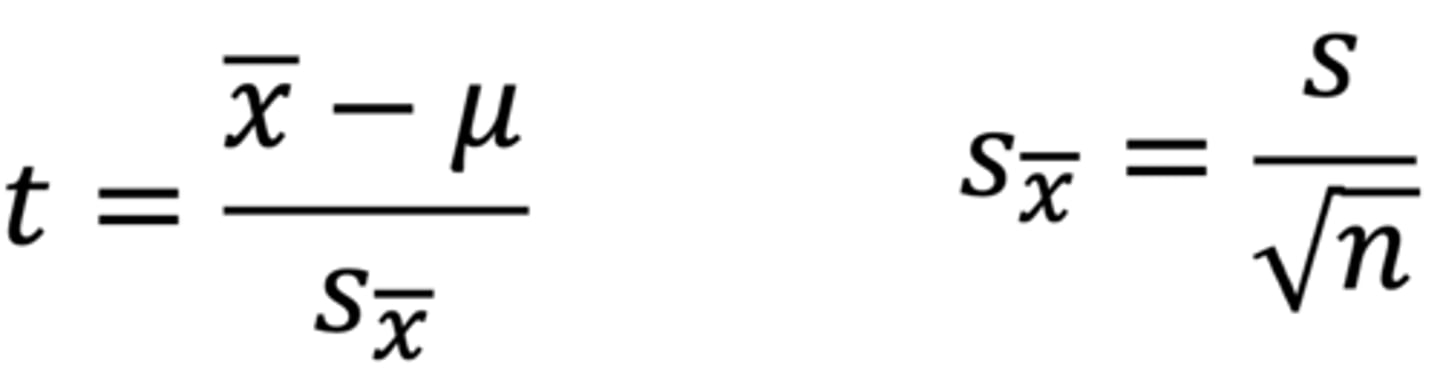
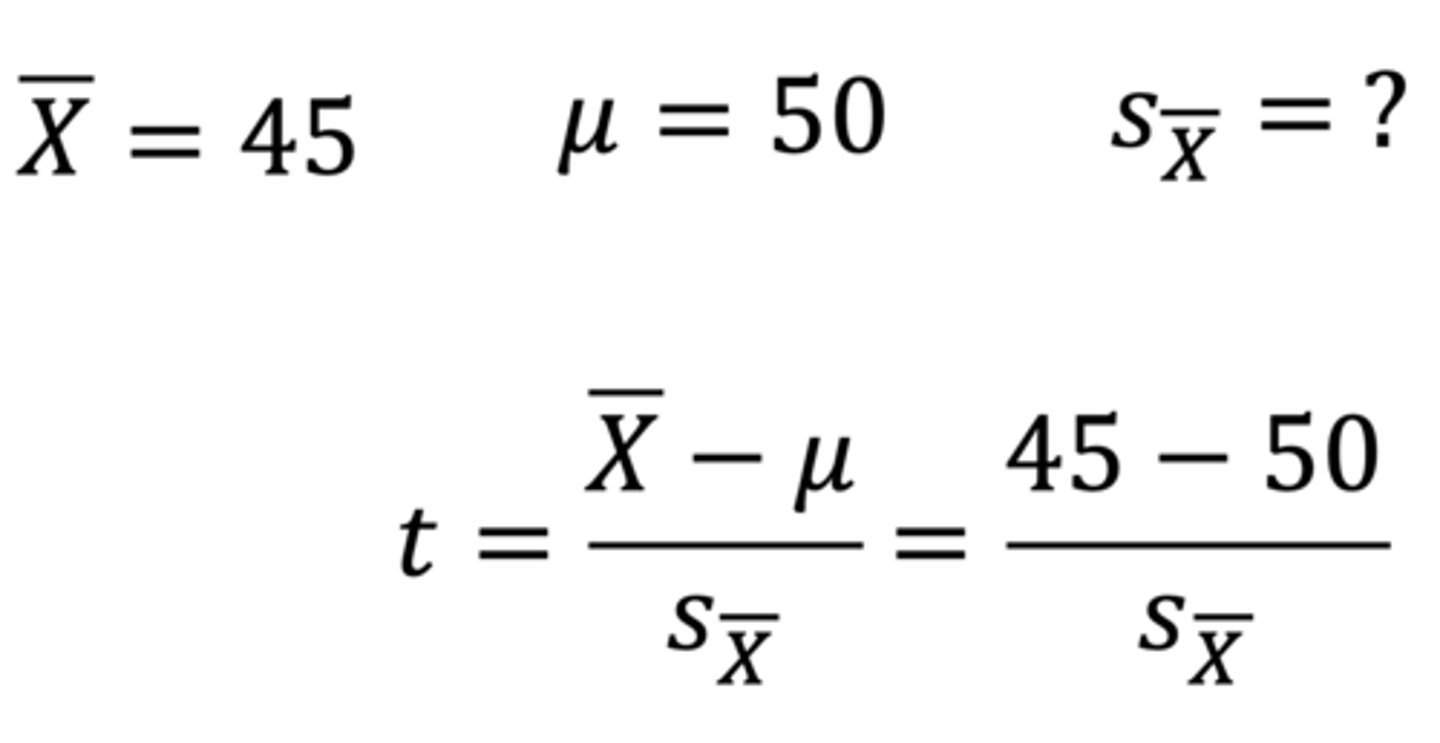
What is the purpose of a one-sample t-test?
To compare if the scores from our sample (as a whole) differ from the population norm
- x bar = mean score of our sample
- μ = population norm
- s with x bar = standard error of the mean, which is the standard deviation of the sampling distribution of the mean
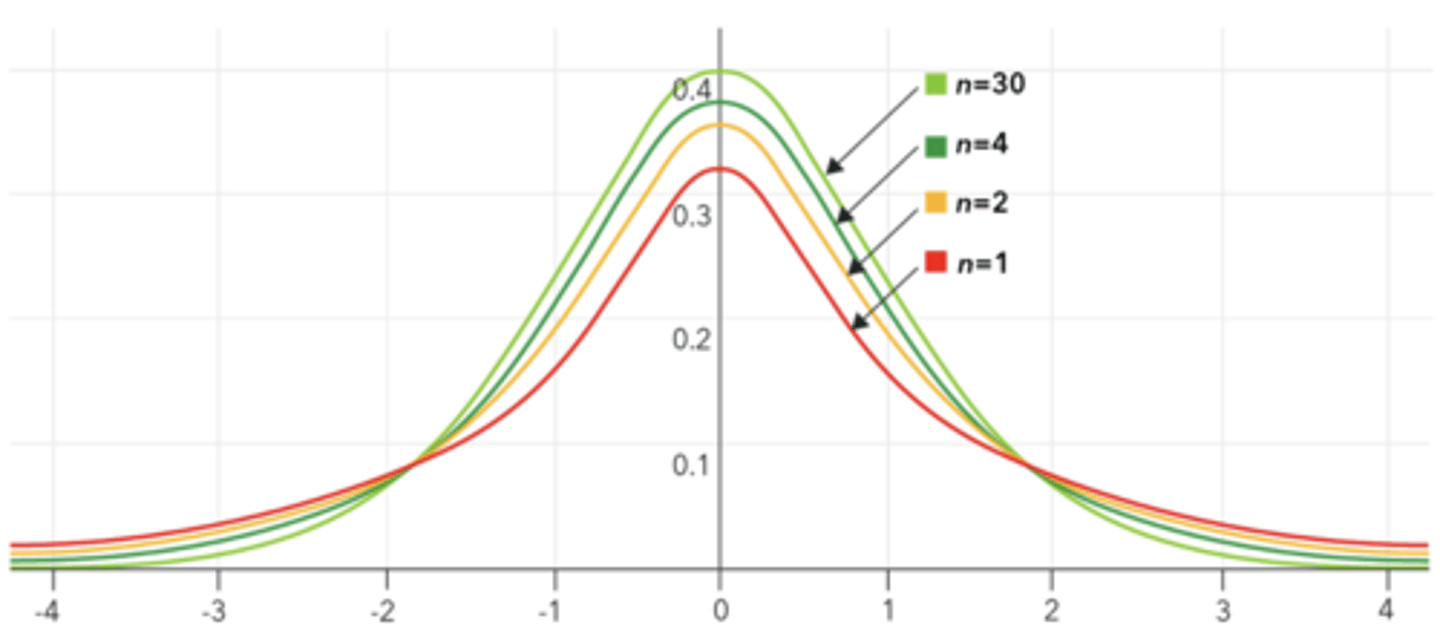
How does the one-sample t-test differ from a z-test?
We could use a normal distribution and a z-score for the mean score of our sample if we knew the value of σ
- When σ is unknown, we can estimate it from the sample standard deviation (s)
- But now we are introducing error into our calculation by using an estimate of σ instead of the real thing
- This changes the shape of the sampling distribution of the mean from the z-distribution to the t-distribution
T-Distribution
A family of distributions, with a slightly different curve for each degree of freedom
- The tails are fatter
- Degrees of freedom for one-sample t-test is n - 1
There exists a tricky general knowledge test comprising 100 true/false questions. Take a random sample of n = 64 high-anxiety students. Their mean on this test is 45% and SD is 25%. Are highly anxious students doing differently than expected by chance (i.e. 50%) on this test?
Based on this information, what are the null and alternate hypotheses?
H0: μ = 50%
Ha: μ ≠ 50%
This is a non-directional/two-tailed hypothesis because our alternate hypothesis says that highly anxious people could perform better or worse than expected by chance
There exists a tricky general knowledge test comprising 100 true/false questions. Take a random sample of n = 64 high-anxiety students. Their mean on this test is 45% and SD is 25%. Are highly anxious students doing differently than expected by chance (i.e. 50%) on this test?
Calculate the t-score of the group mean on the sampling distribution of the mean.
t = sample mean - μ (population mean) / standard error of the mean
= 45 - 50 / standard error of the mean
Standard error of the mean = s / √n
= 25 / √64
= 3.125
t = 45 - 50 / 3.125
= -1.60
There exists a tricky general knowledge test comprising 100 true/false questions. Take a random sample of n = 64 high-anxiety students. Their mean on this test is 45% and SD is 25%. Are highly anxious students doing differently than expected by chance (i.e. 50%) on this test?
What does the Central Limit Theorem tell us about the sampling distribution of the mean?
- It will be normal because n is large (nothing was said about the shape of the population data)
- Have a mean of 50% if null hypothesis is true
- We don't know standard error because we don't know σ, but we can estimate it using the sample standard deviation (and knowing n = 64)
There exists a tricky general knowledge test comprising 100 true/false questions. Take a random sample of n = 64 high-anxiety students. Their mean on this test is 45% and SD is 25%. Are highly anxious students doing differently than expected by chance (i.e. 50%) on this test?
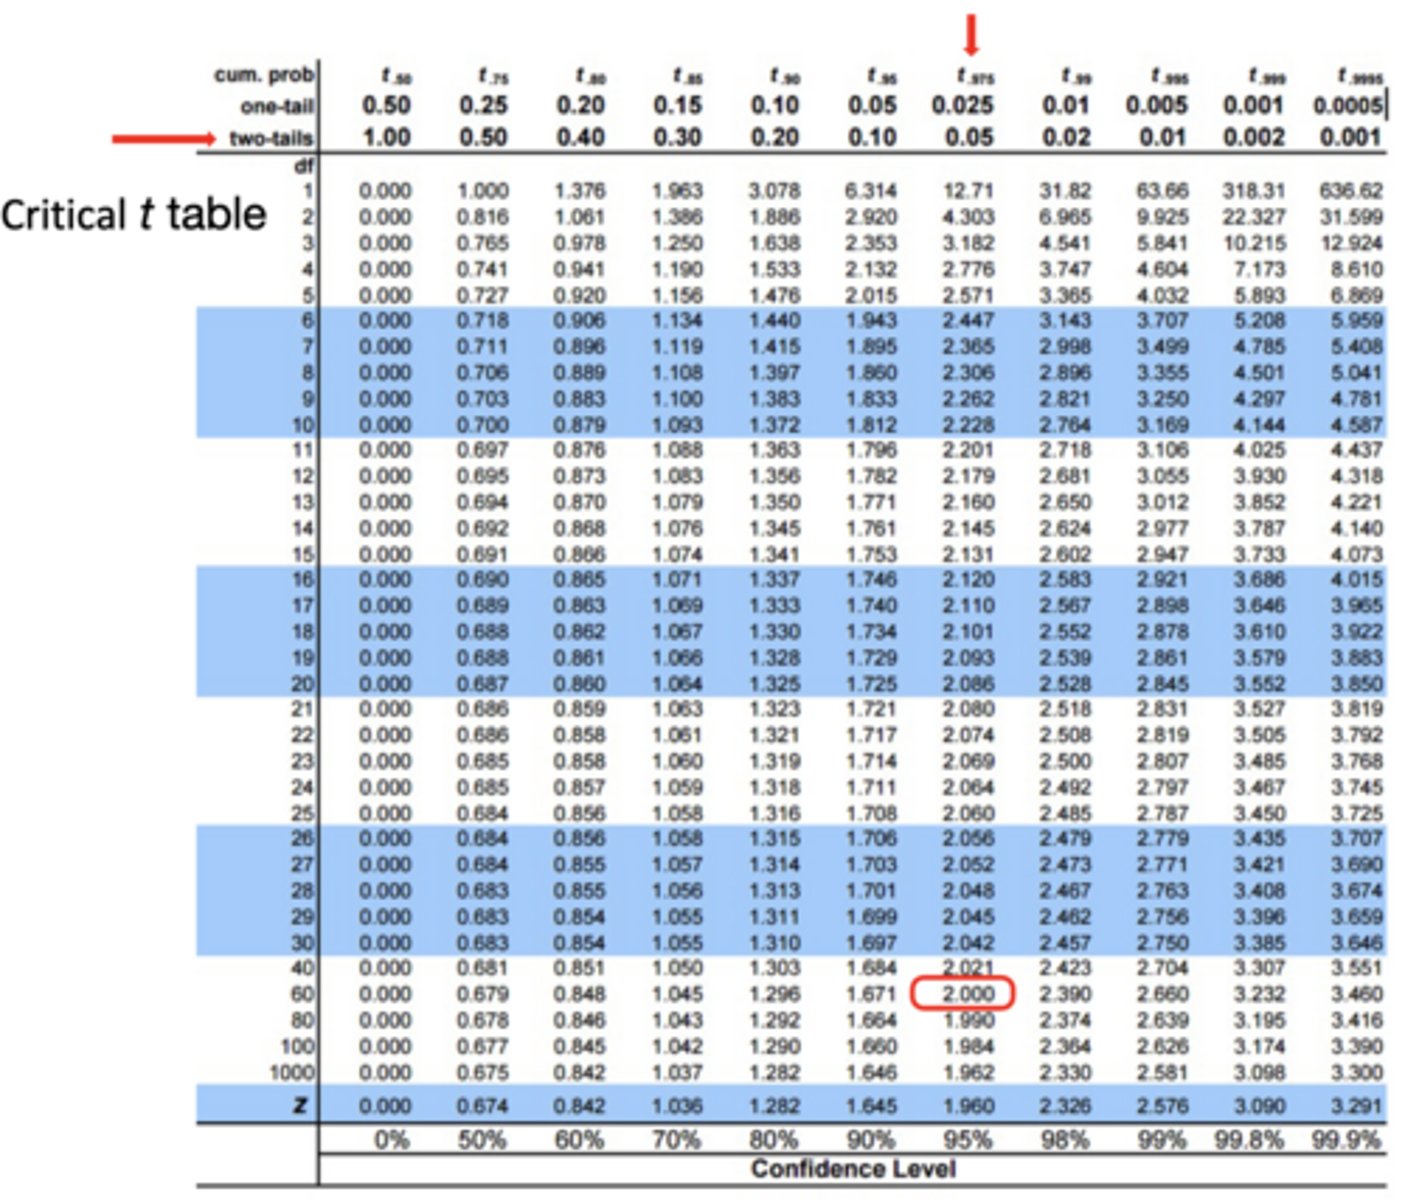
If our t-score is -1.60, what is the p-value?
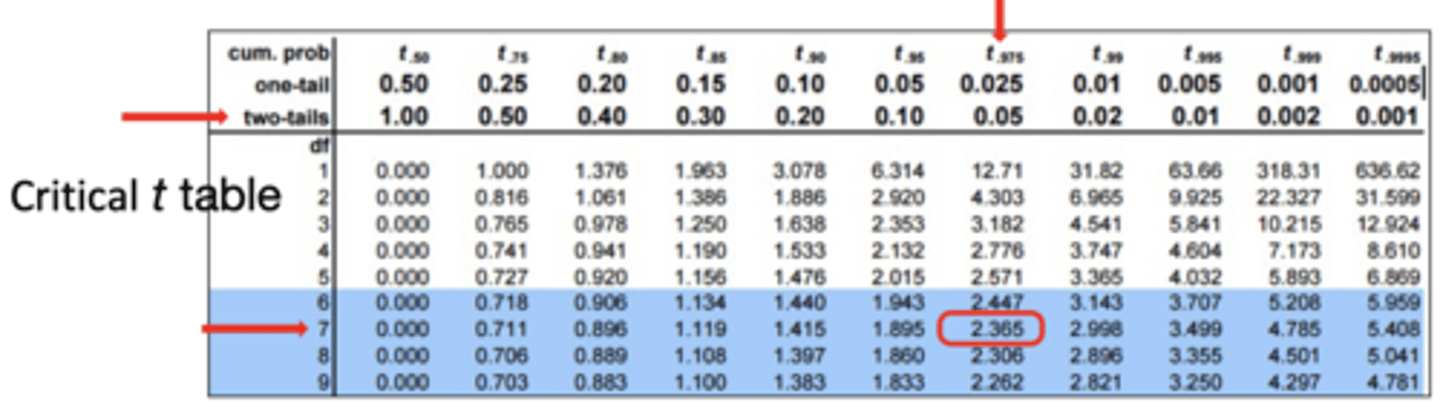
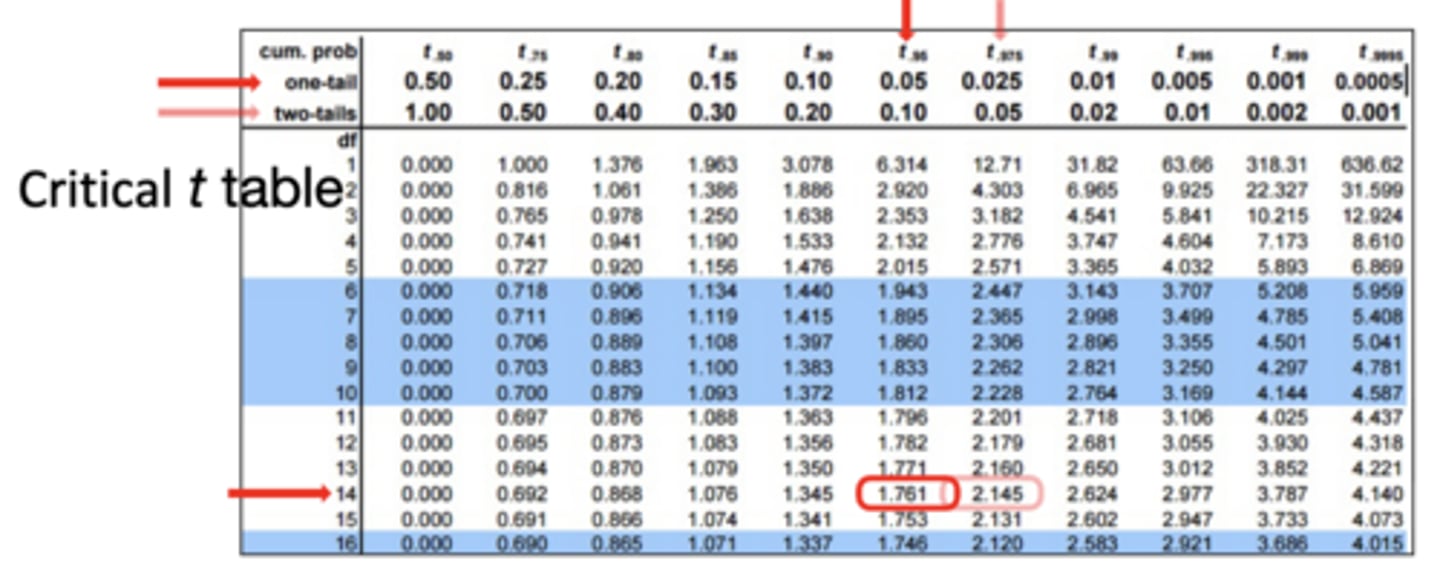
- Use df = 60 from the critical t-table (rounded down from df = n - 1 = 63)
- We are using an alpha of .05 and a non-directional two-tailed test; therefore, calculated t-value is -1.60, and critical t-value is ± 2.000
- Calculated t-value doesn't exceed critical t-value, so we fail to reject the null hypothesis that highly anxious people perform differently than expected by chance
There exists a tricky general knowledge test comprising 100 true/false questions. Take a random sample of n = 64 high-anxiety students. Their mean on this test is 45% and SD is 25%. Are highly anxious students doing differently than expected by chance (i.e. 50%) on this test?
What can we conclude from the test?
On average, the scores of highly anxious people (M = 45%, SD = 25%) were not significantly different than 50%, t(63) = -1.60, p > .05.
What is the purpose of the dependent samples t-test compared to the one-sample t-test?
The one-sample t-test compares a group mean to a population norm. A dependent samples t-test compares people to themselves (e.g. scores on a pre-test and a post-test) or scores of some other matched pair (e.g. brothers and sisters)
- Also known as a paired samples t-test or a dependent groups t-test!
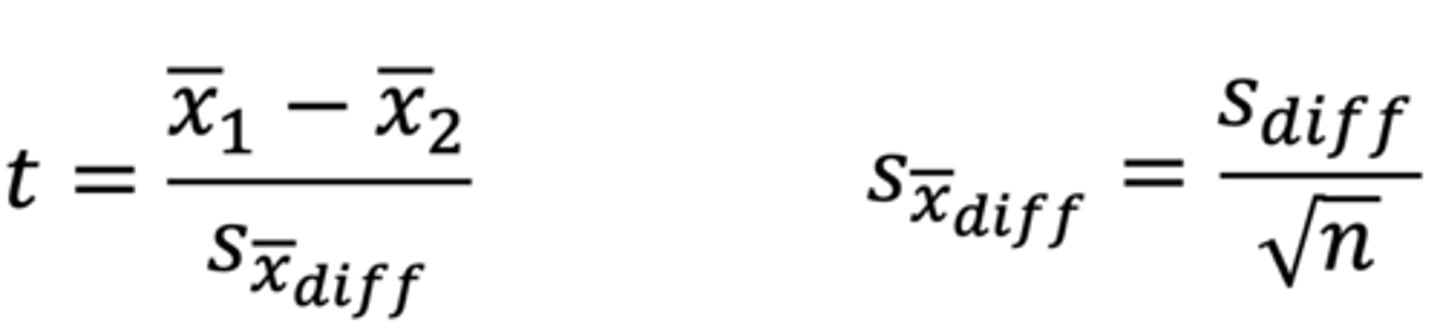
What is the dependent samples t-test based on?
Difference scores (n is the number of pairs of scores); it is mathematically equivalent to a one-sample t-test of the difference scores compared to zero

What do the numerator and denominator of the dependent samples t-test imply?
Numerator: as the difference between the means increases, t will increase (more likely to detect a statistically significant difference)
Denominator: measure of variability (the smaller the standard error, the larger t will be; larger n will shrink the standard error and make t larger)
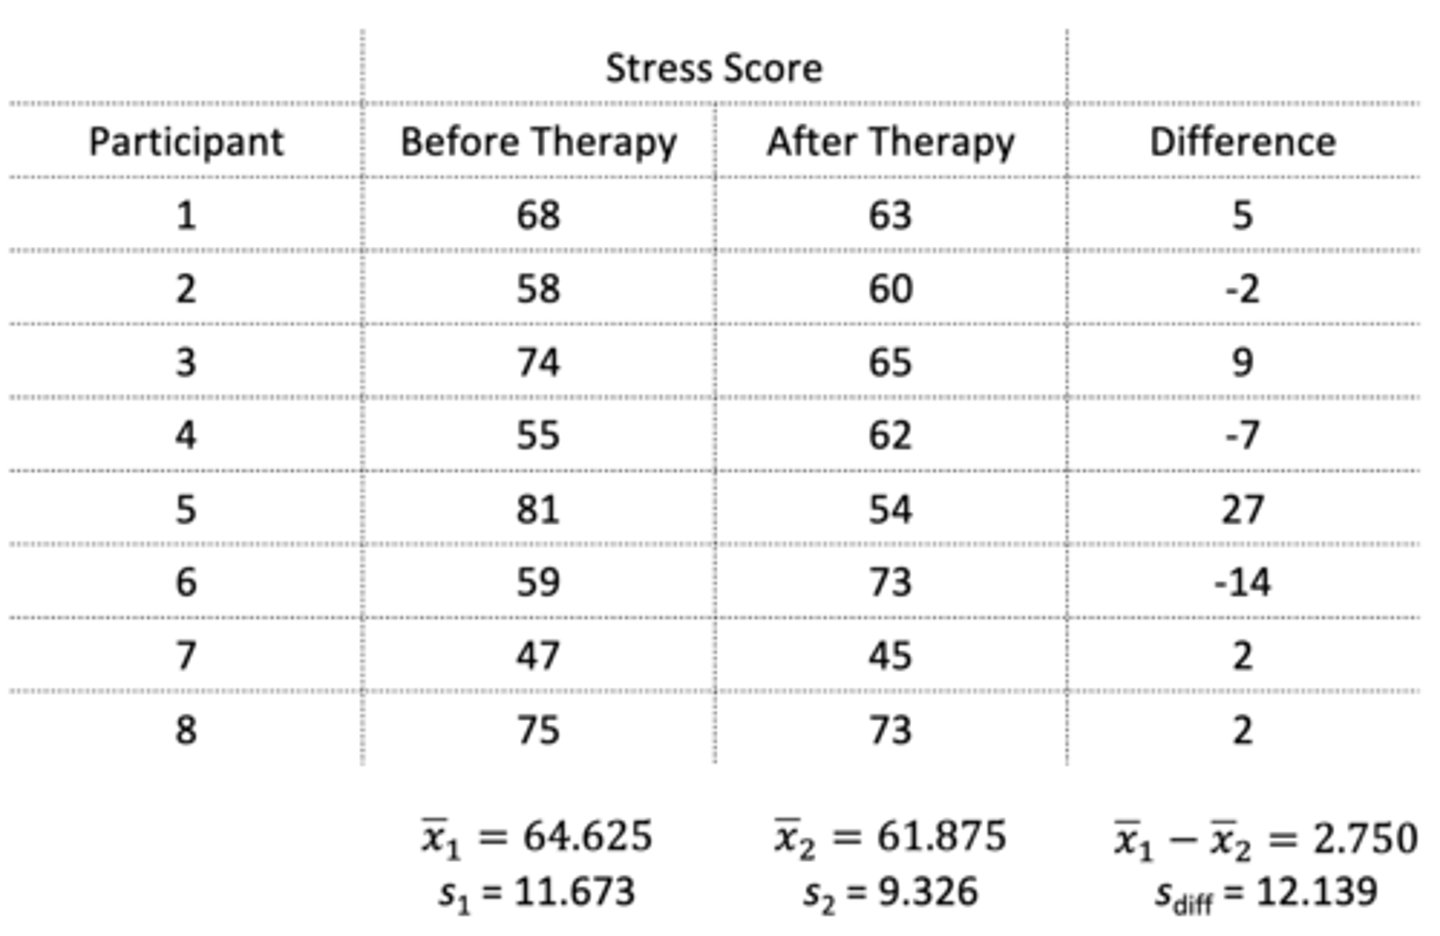
Eight participants are tested on their stress levels before and after therapy. Based on the information provided in the photo, what is the t-score from this dependent samples t-test?
t = before mean - after mean / standard error of the difference scores
= 64.625 - 61.875 / standard error of the difference scores
= 2.750 / 4.292
= 0.641
Standard error of the difference scores = standard deviation of the sample / √n
= 12.139 / √8
= 4.292
Eight participants are tested on their stress levels before and after therapy. What are the null and alternate hypotheses? Is this a one-tailed or two-tailed test? What is the level of significance?
H0: μ of "before" scores = μ of "after" scores
Ha: μ of "before" scores ≠ μ of "after" scores
- Whether this test is one-tailed or two-tailed depends on Ha, which is non-directional, so it's a two-tailed test
- Level of significance is α = 0.05 (probability of making a Type I Error, where we reject the null even though the null is true)

Eight participants are tested on their stress levels before and after therapy. What are the degrees of freedom (df)? Does the calculated t-value exceed the critical t-value?
df = n - 1
= 8 - 1
= 7
- Calculated t-value = 0.641
- Critical t-value from table = 2.365
- The calculated t-value is less than the critical t-value; therefore, we cannot reject the null
Eight participants are tested on their stress levels before and after therapy. What can we conclude from the results of the t-test?
The mean stress level before treatment (M = 64.63, SD = 11.67) did not differ significantly from the mean stress level after treatment (M = 61.88, SD = 9.33), t(7) = 0.641, p > 0.05.

What is the purpose of an independent samples t-test?
Tests if the means of two independent groups are significantly different from each other
Conceptually, very similar to the other t-tests, in that you calculate a t-score by dividing the mean difference by the standard error. The main complication is how you calculate the standard error
Independent Groups
Participants in each group must be different (a between-subjects design) for an independent samples t-test; if participants are in both groups (a within-subjects design), use dependent samples t-test
Normality of Dependent Variable
In an independent samples t-test, the dependent variable should be normally distributed; however, t-test is robust, and correct decision will still be made for minor violations
Homogeneity of Variance
In an independent samples t-test, the variance of the two groups should be equal or approx. equal. This assumption is important in order to create a better estimate of σ by pooling the sample SDs
However, t-test is robust if sample sizes are equal:
- If sample sizes are unequal, you can test for homogeneity of variance (Levene's F test), and if not homogenous, can use alternate procedures (different formula, transform the data)
- So, only a problem if sample sizes are unequal and homogeneity of variance is violated; we won't deal with that situation!
What are the similarities and differences between the independent samples t-test and the one-sample t-test?
- The logic of the independent samples t-test is the same as for the one-sample t-test: you take the difference between the means, divide it by the standard error, and check it against a critical t-value defined by df
- The main difference is that your standard error is a pooled standard error based on the two samples
- Under the null hypothesis, we expect a mean difference of zero, so the t-statistic calculates how many standard errors the mean difference is from zero
When will the t-value be larger?
1. Difference between means is larger (bigger difference = stronger evidence of a statistically significant effect)
2. Pooled variance is smaller (scores are highly clustered, so differences in means are more meaningful)
3. Sample sizes are larger (more precise estimate of population mean; less chance the difference is due to sampling error)
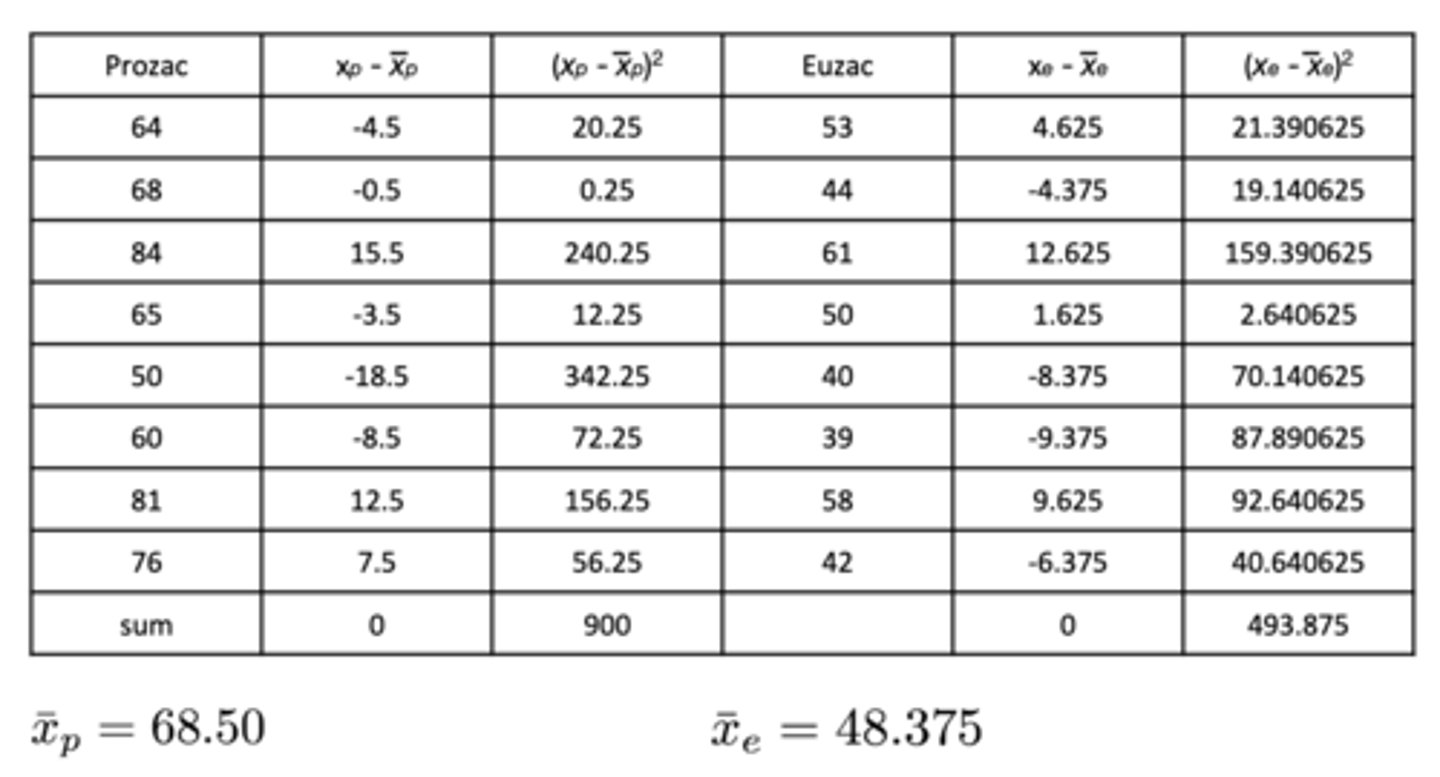
16 depressed patients were randomly assigned to the Prozac or Euzac condition using the double-blind procedure. One month later, depression was scored (low = less depressed; high = more depressed).
If we know the means and sum of squares of each group, what is the first step to find the t-value?
Mean of Prozac = 68.50
Mean of Euzac = 48.375
Sum of Squares (Prozac) = 900
Sum of Squares (Euzac) = 493.875
Calculate standard deviations, then pooled variance!
s of Prozac = √SS / n1 - 1
= √900 / 7
= 11.339
s of Euzac = √SS / n2 - 1
= √493.875 / 7
= 8.400
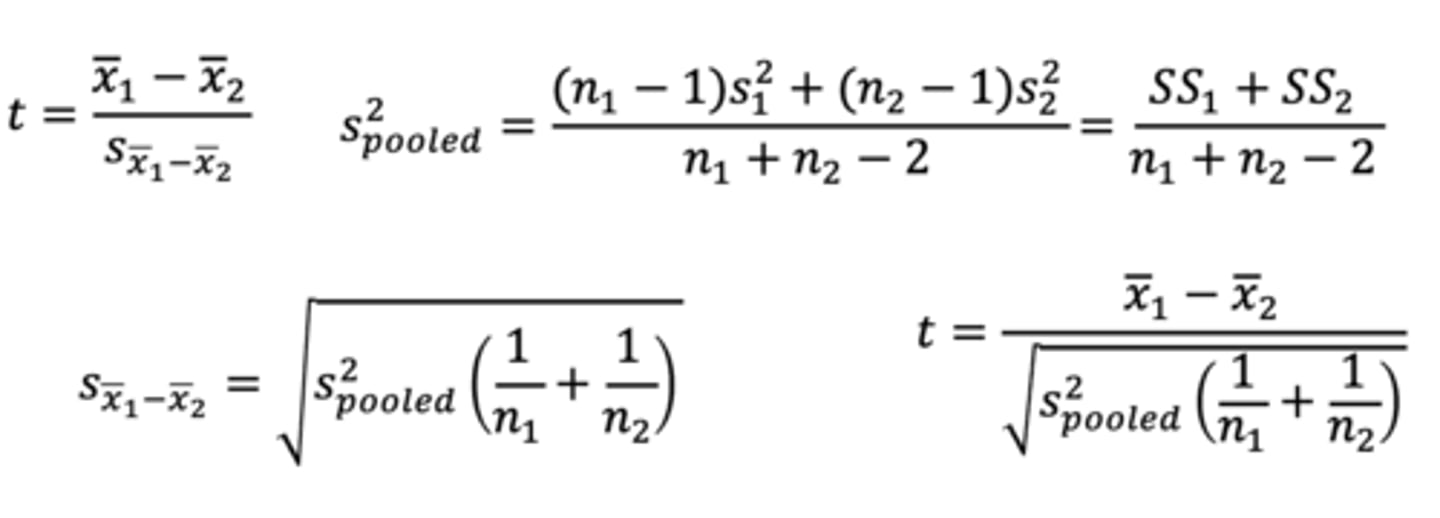
s^2 pooled = (n1 - 1)(s1^2) + (n2 - 1)(s2^2) / n1 + n2 - 2
= SS1 + SS2 / n1 + n2 - 2
= 900 + 493.875 / 14
= 99.5625
16 depressed patients were randomly assigned to the Prozac or Euzac condition using the double-blind procedure. One month later, depression was scored (low = less depressed; high = more depressed).
Upon calculating the standard deviations and pooled variance, what is the next step to find the t-value?
Mean of Prozac = 68.50
Mean of Euzac = 48.375
Pooled Variance = 99.5625
Calculate standard error, then the t-value!
Standard Error = √s^2 pooled (1/n1 + 1/n2)
= √99.5625 (1/8 + 1/8)
t = Mean of Prozac - Mean of Euzac / Standard Error
= 68.500 - 48.375 / 4.989
= 4.034
How can we form null and alternate hypotheses for an independent samples t-test? Do we choose a one-tailed or two-tailed test? What is our level of significance? What are the degrees of freedom?
- H0: μ of Prozac = μ of Euzac
- Ha: μ of Prozac ≠ μ of Euzac
- Directionality is determined by alternate hypothesis, non-directional, so two-tailed
- Choose level of significance as α = 0.05
- df = n1 + n2 - 2.
- Thus, df = 8 + 8 - 2 = 14
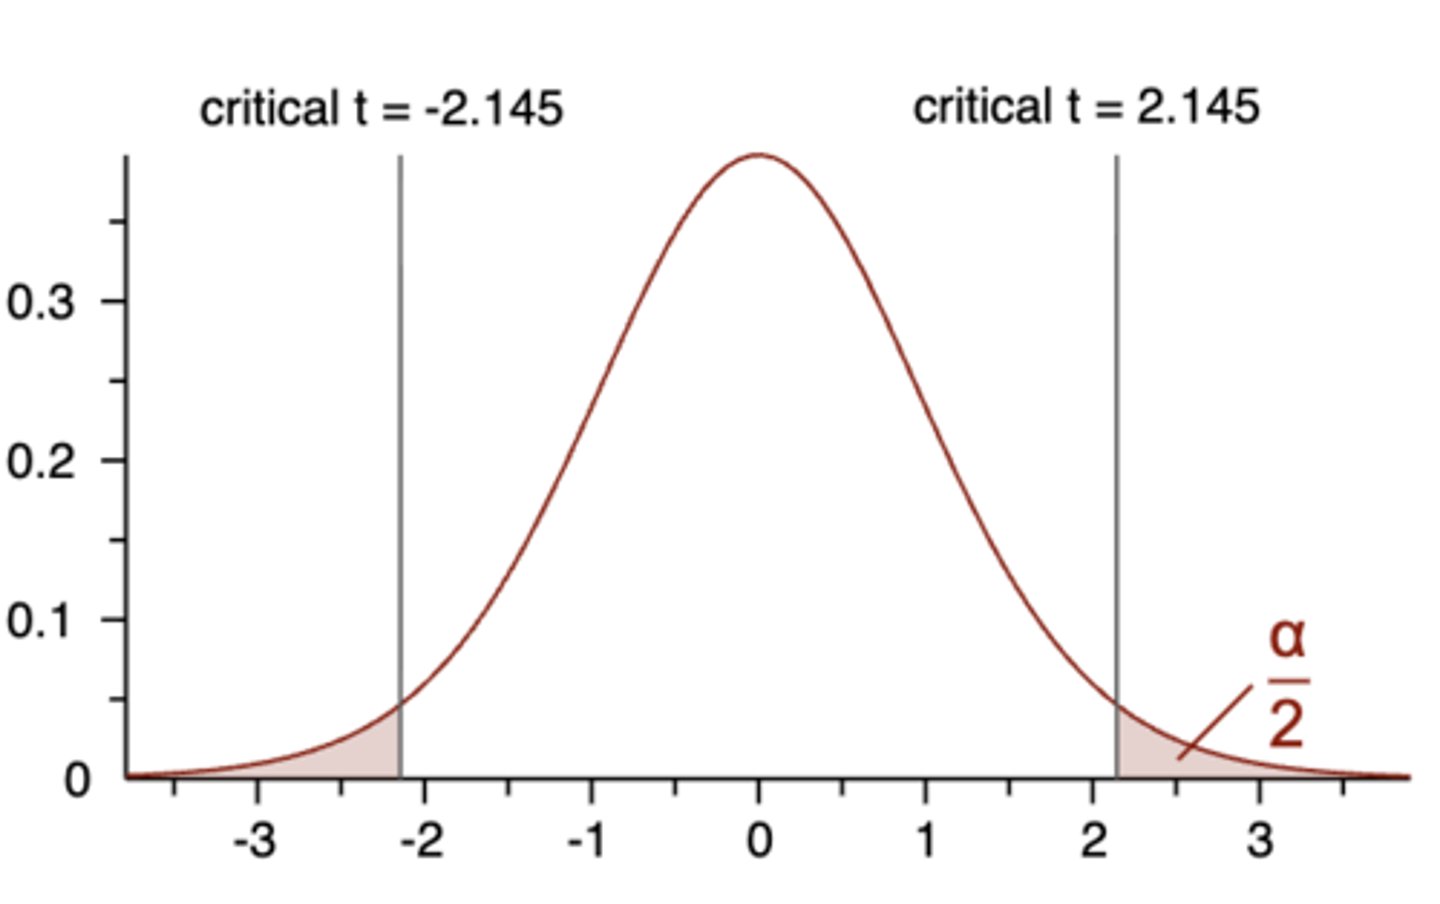
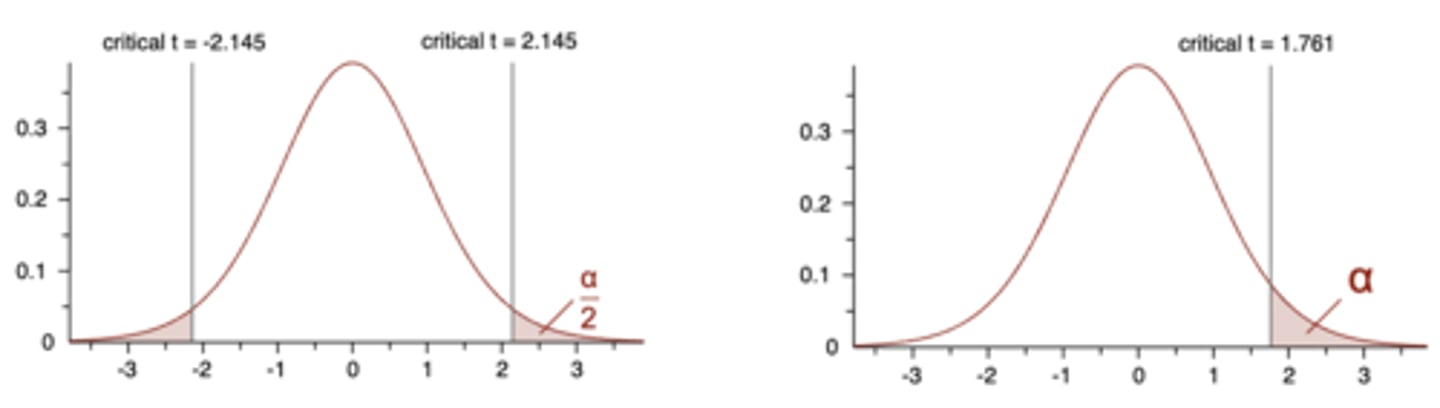
If our calculated t-value from the two-tailed independent samples t-test is 4.034, and our degrees of freedom are 14, what is the critical t-value? Can we reject the null?
Calculated t-value = 4.034
Critical t-value = 2.145
Calculated t-value exceeds critical t-value; therefore, reject null!
Depressed patients who received Euzac had significantly lower depression scores (M = 48.38, SD = 8.40) than those who received Prozac (M = 68.50, SD = 11.34), t(14) = 4.034, p < .01, Cohen's d = 2.02.
For a two-tailed independent samples t-test, what if our calculated t-value was -4.034 instead of +4.034?
Exactly the same for a non-directional (two-tailed) test:
- Is calculated t-value ≥ pos. critical t-value
- Or is calculated t-value ≤ neg. critical t-value
Should we choose a one-tailed or two-tailed test?
Two-tailed test:
- Non-directional
- More conservative; less likely to result in Type I error, more likely to miss a real difference (Type II error)
One-tailed test:
- Directional
- More liberal; more likely to result in Type I error, more sensitive to real differences (less likely to result in Type II error)
When should we use a one-tailed test?
1. A difference in the unpredicted direction, while possible, would be psychologically meaningless (wouldn't tell us anything useful)
2. Results in the unpredicted direction will, under no conditions, be used to determine a course of behaviour different in any way from that determined by no difference at all (if the effect goes the wrong way, you would act exactly the same as if there were no effect)
3. A directional hypothesis is deducible from psychological theory, but results in the opposite direction are not deducible from co-existing psychological theory (current theories predict an effect in only one direction, and no credible theory predicts the opposite effect)
Why should we use a non-directional/two-tailed test unless we have a compelling reason to do otherwise?
- Will have difficulty convincing reviewers/editors that one-tailed is genuine
- Bias is to view one-tailed as last attempt to change a non-significant result into a significant result
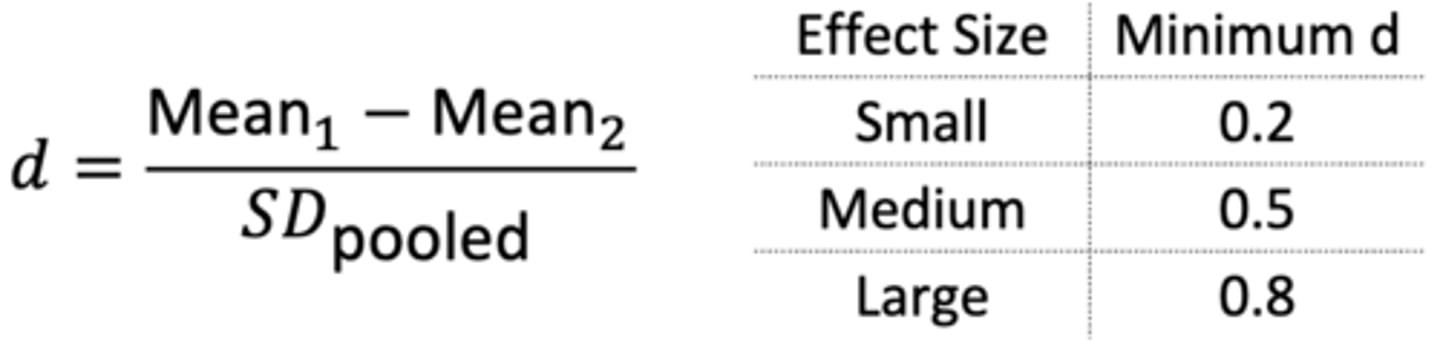
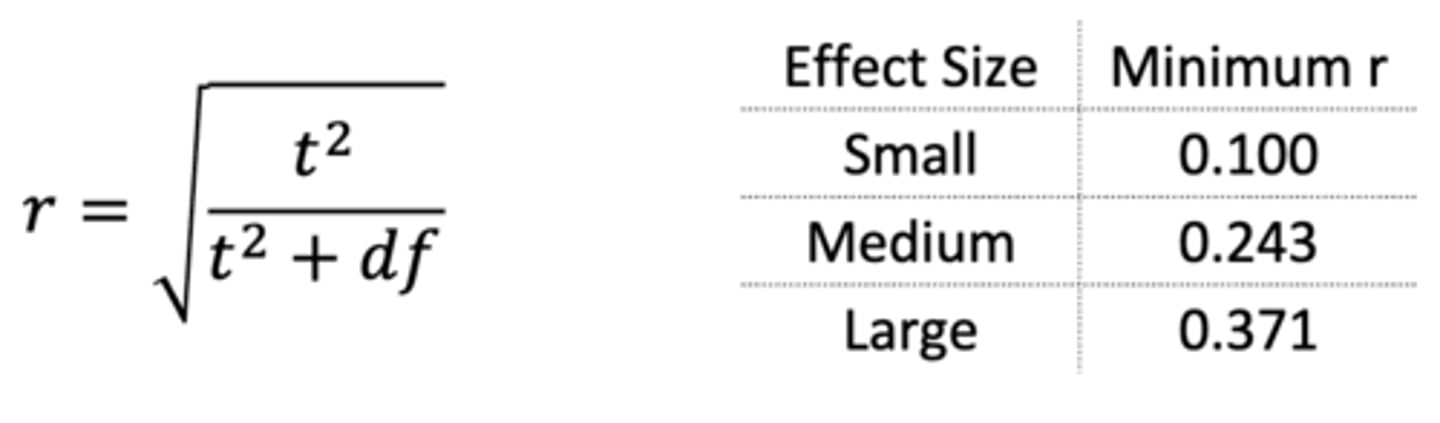
Effect Size (Correlation Coefficient)
Varies from 0 to 1 and is not used very often
Effect Size (Cohen's d)
- Take absolute value
- Most don't use "small" vs. "large"
- Instead, interpret as how many standard deviations the two means are apart (e.g. a large difference between group means relative to the pooled standard deviation produces a large effect size)