Heart Mechanics and the Cardiac Cycle
1/46
There's no tags or description
Looks like no tags are added yet.
Name | Mastery | Learn | Test | Matching | Spaced | Call with Kai |
|---|
No analytics yet
Send a link to your students to track their progress
47 Terms
learning objectives
Describe the Frank-Starling mechanism and discuss its importance in regulating cardiac output.
List the factors that determine or modify ventricular preload, afterload, and contractility.
Show how changes in preload, afterload, and contractility affect ventricular-end diastolic volume, end-systolic volume, and stroke volume by using Frank-Starling curves.
Describe the changes in cardiac pressures and volumes, and associated electrical events and heart sounds, that occur during the cardiac cycle.
Know normal values for end-diastolic and end-systolic left ventricular volumes, atrial and ventricular pressures, and systolic and diastolic aortic and pulmonary arterial pressures.
Draw and label ventricular pressure-volume loops derived from ventricular pressure and volume changes during the cardiac cycle.
Calculate ejection fraction and stroke volume from end-diastolic and end-systolic volumes.
Identify stroke volume and stroke work from a pressure-volume loop.
Show how changes in preload, afterload, and contractility affect ventricular-end diastolic volume, end-systolic volume, and stroke volume by using pressure-volume loops.
what are all of the formulas for the heart?
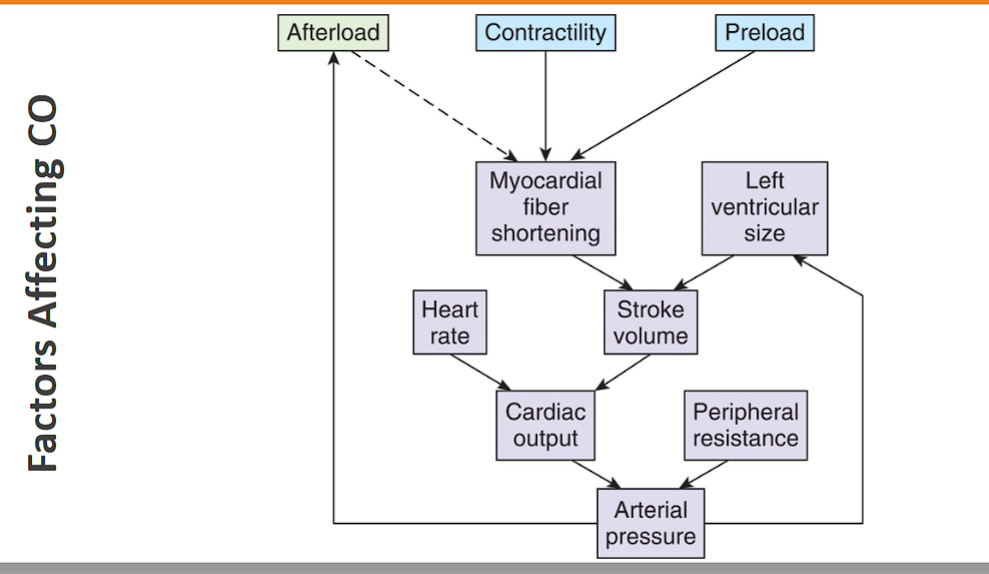
1. Basic Volumes and Flow (The Foundation)
These formulas define the core output of the heart.
Concept | Formula | Explanation |
|---|---|---|
1. Stroke Volume (SV) |
| The volume of blood ejected per heartbeat. |
| A derived version using flow and rate. | |
2. Cardiac Output (CO) |
| The volume of blood pumped per minute. The fundamental flow equation. |
3. Cardiac Index (CI) |
| Normalizes CO for body size (BSA = Body Surface Area). |
4. Ejection Fraction (EF) |
| The percentage of blood in the ventricle that is pumped out. A key measure of systolic function. |
5. Heart Rate (HR) |
| The R-R interval is the time between QRS complexes on the ECG |
2. Pressure, Resistance, and Wall Stress
These formulas relate to the forces the heart must generate and overcome.
Concept | Formula | Explanation |
|---|---|---|
6. Mean Arterial Pressure (MAP) |
| The average pressure in the arteries during one cardiac cycle. |
| The fundamental pressure-flow-resistance relationship for the systemic circulation. | |
7. Pulse Pressure (PP) |
| The difference between systolic and diastolic pressure. Related to stroke volume and arterial stiffness. |
8. Systemic Vascular Resistance (SVR) |
| The resistance to flow in the systemic circulation. CVP is Central Venous Pressure. The |
9. Laplace's Law (Wall Stress, σ) |
| Simplified for a thin-walled sphere. The wall stress the heart muscle must generate. |
3. Work and Power (Energy Expenditure)
These formulas quantify the mechanical work done by the heart.
Concept | Formula | Explanation |
|---|---|---|
10. Stroke Work (SW) |
| For the Left Ventricle. The work per beat. PAOP is Pulmonary Artery Occlusion Pressure (~left atrial pressure). The constant converts units to gram-meters. |
| The most direct representation. | |
11. Cardiac Work (CW) |
| The total work done by the heart per minute. |
12. Hydraulic Power |
| The rate of work done to generate pressure and flow. Converts to Watts. |
4. Advanced Concepts from the Pressure-Volume Loop
These are derived from the relationship between pressure and volume and are central to modern cardiology.
Concept | Formula | Explanation |
|---|---|---|
13. Preload |
| The initial fiber length, approximated by End-Diastolic Volume or Pressure. |
14. End-Systolic Elastance (Ees) |
| Slope of the ESPVR. The gold standard measure of contractility. |
15. Arterial Elastance (Ea) |
| A lumped measure of afterload. The slope of the line connecting EDV on the volume axis to the end-systolic point on the PV loop. |
16. Ventricular-Arterial Coupling |
| The ratio of arterial load to ventricular contractility. Optimal efficiency is around 0.6-1.0. |
17. Pressure-Volume Area (PVA) |
| The total mechanical energy. SW is Stroke Work (area inside loop), PE is Potential Energy (area under ESPVR, outside loop). PVA correlates strongly with myocardial oxygen consumption. |
5. Electrical & Miscellaneous
Concept | Formula | Explanation |
|---|---|---|
18. Rate-Pressure Product (RPP) |
| An index of myocardial oxygen demand. |
19. Fick Principle for CO |
| The gold standard for measuring CO. |
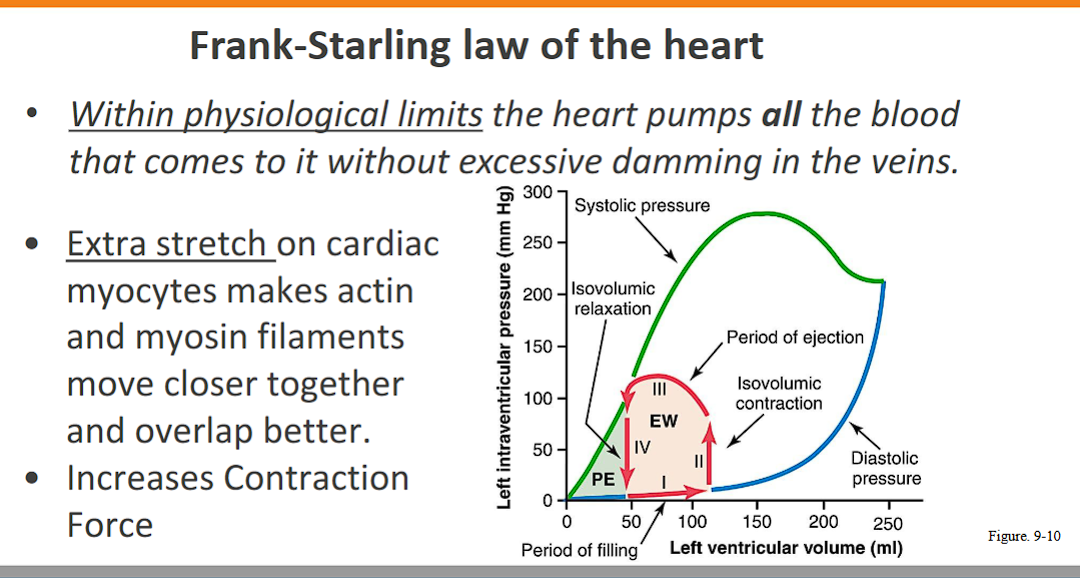
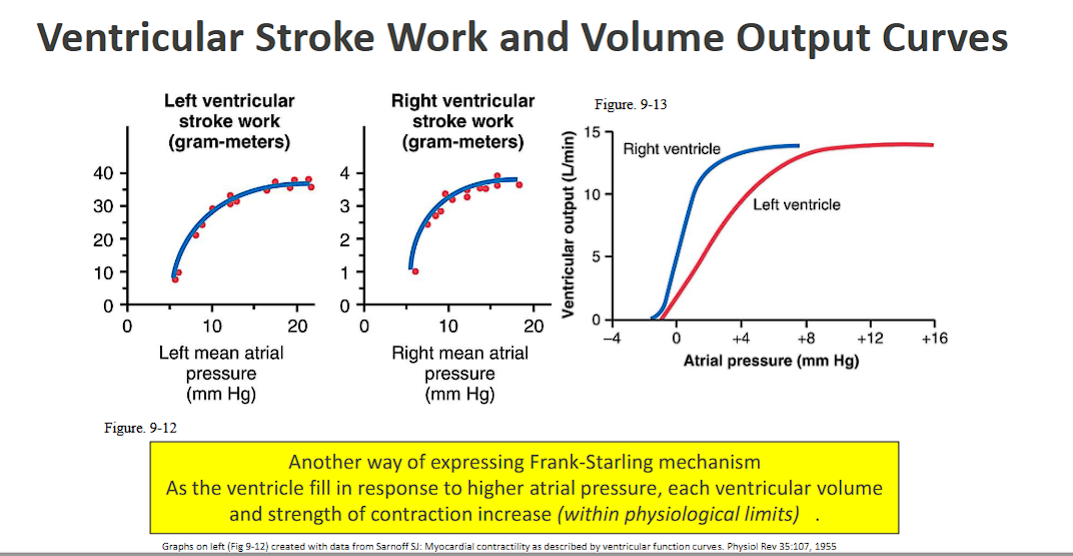
Describe the Frank-Starling mechanism and discuss its importance in regulating cardiac output. (FIRST LEARNING OBJECTIVE)
Here is a detailed description of the Frank-Starling mechanism and its critical role in regulating cardiac output.
What is the Frank-Starling Mechanism?
The Frank-Starling mechanism (also known as Starling's Law of the Heart) is a fundamental physiological principle that states:
The force of a ventricular contraction is directly proportional to the initial length of the cardiac muscle fiber at the end of diastole.
In simpler, more clinical terms:
"The more the heart fills with blood during diastole (relaxation), the harder it will contract during systole (contraction), and the more blood it will eject."
The Key Variable: The "initial length of the muscle fiber" is determined by the volume of blood in the ventricle just before it contracts, known as the End-Diastolic Volume (EDV). EDV is the primary determinant of preload.
The Cellular Basis: This phenomenon occurs because stretching the cardiac muscle fibers optimizes the overlap between the contractile proteins actin and myosin within the sarcomeres. This optimal overlap allows for a greater number of cross-bridges to form, resulting in a more forceful contraction.
Importance in Regulating Cardiac Output
The Frank-Starling mechanism is the heart's primary intrinsic (built-in) auto-regulatory system for matching cardiac output to venous return. Its importance cannot be overstated, and it functions in several key ways:
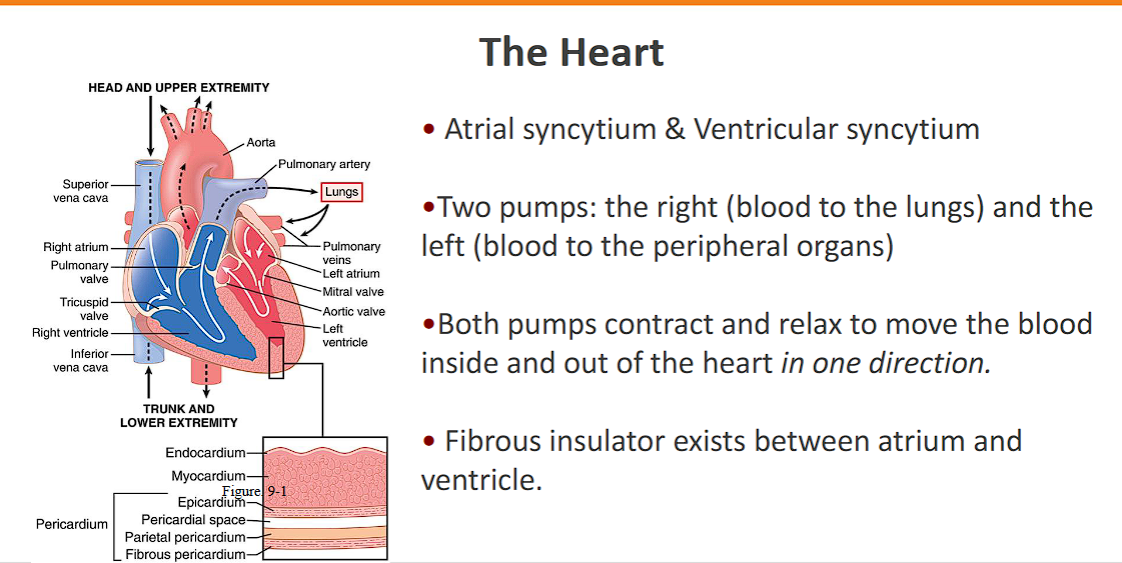
1.Ensures Ventricular Balance (Matching Left & Right Heart Output)
This is its most critical minute-to-minute function. The right and left ventricles are connected in series; all the blood pumped by the right ventricle to the lungs must eventually return to the left ventricle to be pumped to the body.
Scenario: If the right ventricle suddenly pumps more blood (e.g., due to a change in posture), the left ventricle will receive more blood a few beats later.
Response: This increased volume stretches the left ventricular myocardium.
Result: By the Frank-Starling mechanism, the left ventricle contracts more forcefully, ejecting the extra volume and preventing blood from backing up into the lungs.
Conclusion: This mechanism ensures that the output of the two ventricles is perfectly matched over a series of beats, preventing life-threatening pulmonary or systemic congestion.
2.Matches Cardiac Output to Venous Return
The heart must be able to handle the varying amounts of blood returning to it.
During Exercise: Enhanced skeletal muscle pumping and deeper breathing increase venous return. This greater volume fills the ventricles, increasing preload. The heart automatically responds by contracting more forcefully, thereby increasing stroke volume and cardiac output to meet the elevated metabolic demands.
During Hemorrhage: Blood loss decreases venous return. With less preload, the heart contracts less forcefully, reducing stroke volume and cardiac output. This is a protective mechanism to conserve the remaining blood volume.
3.Provides a Built-in Reserve Mechanism
The Frank-Starling mechanism provides a "recruitable reserve." At rest, the heart operates on the initial, steeper part of the function curve, where a small increase in preload results in a significant increase in stroke volume. This allows for a rapid and powerful increase in cardiac output during stress without initially requiring hormonal or neural signals.
4.Operates Independently of External Controls
Unlike the effects of adrenaline or sympathetic nerves, which increase contractility (the inherent strength of contraction at a given fiber length), the Frank-Starling mechanism is an intrinsic property of the heart muscle itself. It provides a rapid, beat-to-beat fine-tuning of performance that does not rely on external nervous or hormonal input.
Summary
In essence, the Frank-Starling mechanism is the heart's elegant solution to a fundamental problem: how to ensure that the amount of blood pumped out is precisely equal to the amount of blood returned to it. It acts as a built-in, self-adjusting pump that guarantees ventricular balance, adapts output to demand, and provides a crucial physiological reserve, all without any conscious effort or external control.
List the factors that determine or modify ventricular preload, afterload, and contractility.
Here is a detailed list of the factors that determine or modify ventricular preload, afterload, and contractility.
1. Preload
Definition: Preload is the initial stretch or load on the ventricular muscle fiber at the end of diastole, just before contraction. It is primarily determined by the End-Diastolic Volume (EDV).
Factors that INCREASE Preload:
Factor | Mechanism |
|---|---|
↑ Total Blood Volume | Increased circulating blood volume (e.g., fluid overload, high salt intake) leads to greater venous return. |
↑ Venous Return | The volume of blood returning to the heart per unit time. This is the primary determinant. |
↑ Skeletal Muscle Pump | Muscle contractions during exercise squeeze veins, pushing blood toward the heart. |
↑ Respiratory (Thoracic) Pump | Deep inspiration decreases intrathoracic pressure, drawing more blood into the great veins and atria. |
↑ Atrial Contraction ("Atrial Kick") | A stronger contraction at the end of diastole forces more blood into the ventricle. This is critical in conditions like exercise and atrial fibrillation (where its loss decreases preload). |
Longer Diastolic Filling Time | A slower heart rate allows more time for the ventricle to fill. |
Body Position | Lying down (recumbency) reduces the effect of gravity, promoting venous return from the legs. |
Sympathetic Venoconstriction | Sympathetic nervous system activation constricts veins, increasing venous pressure and "squeezing" blood toward the heart. |
Negative Intrapericardial Pressure | Deep inspiration makes pericardial pressure more negative, which "sucks" blood into the atria and ventricles. |
Factors that DECREASE Preload:
Hemorrhage or Dehydration (↓ Blood Volume)
Rapid Heart Rate (Tachycardia) - ↓ Filling time
Loss of Atrial Kick (e.g., Atrial Fibrillation)
Standing Up Quickly (Gravity pools blood in legs)
Positive Pressure Ventilation - ↑ Intrathoracic pressure, impeding venous return
Cardiac Tamponade or Constrictive Pericarditis - Restricts ventricular filling
2. Afterload
Definition: Afterload is the tension or stress the ventricular myocardium must generate to eject blood during systole. For the left ventricle, it is closely related to the resistance in the aorta, known as Systemic Vascular Resistance (SVR).
Factors that INCREASE Afterload:
Factor | Mechanism |
|---|---|
↑ Systemic Vascular Resistance (SVR) | The primary determinant for the left ventricle. Caused by widespread vasoconstriction (e.g., from hypertension, sympathetic overactivity, vasopressors). |
↑ Aortic Impedance | The opposition to pulsatile flow, largely determined by aortic stiffness (e.g., with aging or atherosclerosis). |
↑ Aortic Pressure | As in chronic or acute hypertension. The ventricle must generate a higher pressure to open the aortic valve. |
Outflow Tract Obstruction | Conditions like Aortic Stenosis create a mechanical obstruction that the ventricle must overcome. |
↑ Ventricular Chamber Size (Radius) | Per Laplace's Law (Wall Stress = (P × r) / (2 × h)), a larger ventricle (in dilated cardiomyopathy) must generate more wall tension to achieve the same pressure, thereby increasing afterload. |
↑ Blood Viscosity | As in polycythemia, which increases resistance to flow. |
Factors that DECREASE Afterload:
↓ SVR (Systemic Vasodilation) - e.g., Septic shock, vasodilator drugs (nitroprusside)
↓ Aortic Pressure (Hypotension)
Reduction in Outflow Obstruction (e.g., after surgical repair of aortic stenosis)
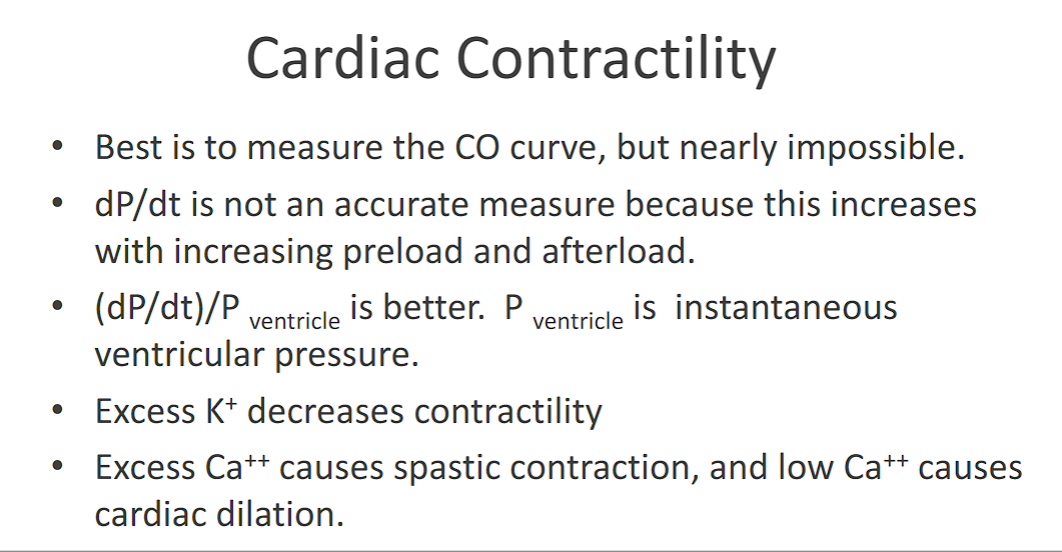
3. Contractility
Definition: Contractility (or inotropy) is the intrinsic strength and vigor of the heart's contraction during systole at a given preload and afterload. It is represented by the slope of the End-Systolic Pressure-Volume Relationship (ESPVR).
Factors that INCREASE Contractility (Positive Inotropes):
Factor | Mechanism |
|---|---|
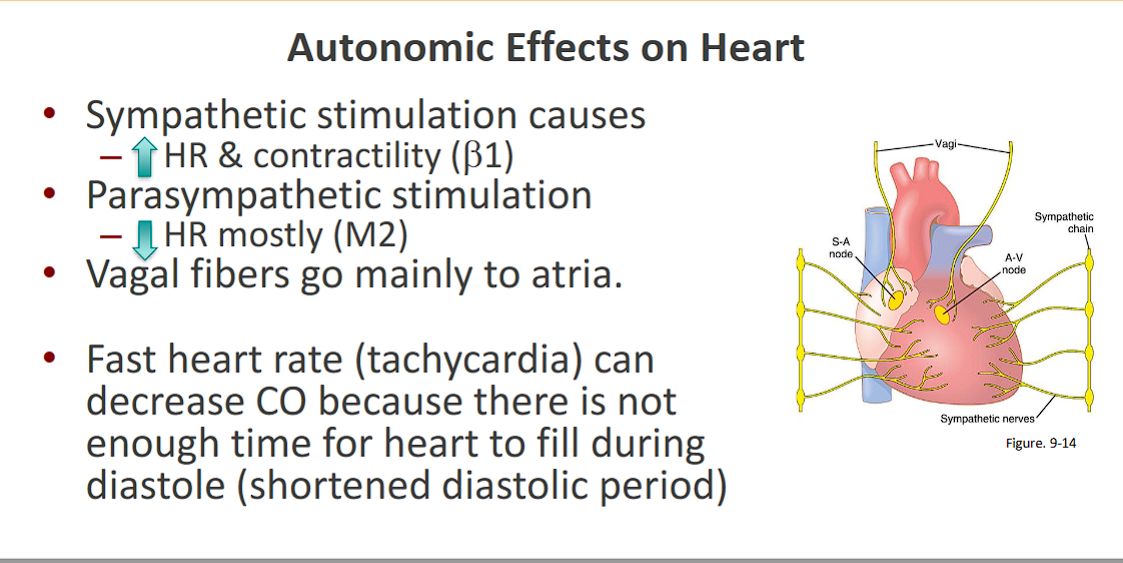
↑ Sympathetic Nervous System Activity | Norepinephrine release binds to β₁-adrenergic receptors in the heart, increasing calcium influx and myofilament sensitivity to calcium. |
Circulating Catecholamines | Epinephrine from the adrenal medulla acts similarly. |
Digitalis Glycosides | Inhibits the Na⁺/K⁺ ATPase pump, leading to increased intracellular calcium. |
Calcium | Increased extracellular calcium provides more Ca²⁺ for the contraction cycle. |
Glucagon | Activates cAMP production. |
Phosphodiesterase Inhibitors (e.g., Milrinone) | Prevent cAMP breakdown, enhancing calcium-mediated contraction. |
Thyroid Hormones (T3) | Upregulate β-receptors and calcium handling proteins. |
Post-Extrasystolic Potentiation | A contraction following a premature beat is more forceful due to increased calcium availability. |
Factors that DECREASE Contractility (Negative Inotropes):
Heart Failure - The hallmark is impaired contractility.
Myocardial Ischemia/Infarction - Lack of oxygen damages contractile machinery.
Acidosis (↓ pH) - H⁺ ions compete with Ca²⁺ for binding sites on troponin.
Hypoxia - Lack of oxygen for ATP production.
β-adrenergic Blockers (e.g., Metoprolol) - Block the effects of sympathetic stimulation.
Calcium Channel Blockers (e.g., Verapamil, Diltiazem) - Reduce calcium influx.
Anesthetic Agents (e.g., Halothane)
Myocarditis - Inflammation of the heart muscle.
Summary Table for Quick Reference
Parameter | Primary Determinant | Factors that INCREASE It | Factors that DECREASE It |
|---|---|---|---|
Preload | Venous Return & EDV | Exercise, Fluid overload, Slow HR, Recumbency | Hemorrhage, Dehydration, Tachycardia, Standing |
Afterload | Systemic Vascular Resistance (SVR) | Hypertension, Vasoconstriction, Aortic Stenosis | Vasodilation, Hypotension, Vasodilator drugs |
Contractility | Slope of ESPVR | Sympathetic stimulation, Adrenaline, Digitalis | Heart failure, Ischemia, β-blockers, Acidosis |
Show how changes in preload, afterload, and contractility affect ventricular-end diastolic volume, end-systolic volume, and stroke volume by using Frank-Starling curves.
Using the Frank-Starling curve is an excellent way to visualize how changes in preload, afterload, and contractility affect ventricular volumes and stroke volume.
The Frank-Starling Curve: A Baseline
The Frank-Starling curve plots Stroke Volume (SV) or Cardiac Output (CO) on the Y-axis against Left Ventricular End-Diastolic Pressure (LVEDP) or End-Diastolic Volume (EDV), which is Preload, on the X-axis.
The curve itself represents the heart's contractile state.
Moving along the same curve represents a change due to preload.
Shifting the entire curve represents a change in contractility or afterload.
1. Effect of Increased PRELOAD
What changes: Preload (X-axis value) increases.
What doesn't change: The contractile state of the heart (the curve itself remains the same).
Mechanism: Increased venous return (e.g., from exercise or fluid infusion) leads to a higher End-Diastolic Volume (EDV). This greater stretch of the ventricular myocardium results in a more forceful contraction via the Frank-Starling mechanism.
On the Graph: The operating point moves up and to the right along the same Frank-Starling curve.
Effect on Volumes:
End-Diastolic Volume (EDV): Increases
End-Systolic Volume (ESV): Unchanged (The heart ejects more blood, but the minimum volume it can achieve at the end of contraction against a constant afterload remains the same.)
Stroke Volume (SV): Increases (Because SV = EDV - ESV, and EDV has increased while ESV is unchanged.)
Note: The arrow shows the movement along the curve from the initial operating point to the new one.
2. Effect of Increased CONTRACTILITY
What changes: The heart's inotropic state (the curve shifts).
What doesn't change: Preload (We compare points at the same EDV).
Mechanism: Positive inotropic agents (e.g., adrenaline, digitalis) make the heart contract more forcefully and rapidly at any given level of preload.
On the Graph: The entire Frank-Starling curve shifts UPWARD and LEFTWARD.
Effect on Volumes:
End-Diastolic Volume (EDV): Unchanged (We are comparing at the same preload).
End-Systolic Volume (ESV): Decreases (The more forceful contraction ejects more blood, leaving a smaller residual volume).
Stroke Volume (SV): Increases (Because SV = EDV - ESV, and ESV has decreased while EDV is unchanged.)
Note: At the same preload (X-value), the heart now pumps a larger stroke volume (Y-value) on the higher curve.
3. Effect of Increased AFTERLOAD
What changes: The resistance the heart must eject against.
What doesn't change: The heart's inherent contractility (the curve shifts, but for a different reason than contractility).
Mechanism: Increased afterload (e.g., hypertension, aortic stenosis) means the ventricle must generate a higher pressure to open the aortic valve. This delays ejection and reduces the velocity of fiber shortening, resulting in less blood being ejected per beat.
On the Graph: The entire Frank-Starling curve shifts DOWNWARD and RIGHTWARD.
Effect on Volumes:
End-Diastolic Volume (EDV): Increases (Because the heart ejects less blood, there is more residual volume. Over several beats, this increased residual volume adds to the venous return, leading to a higher EDV.)
End-Systolic Volume (ESV): Increases (The heart cannot eject as effectively against the high resistance, so more blood remains in the ventricle after contraction.)
Stroke Volume (SV): Decreases (Because SV = EDV - ESV, and the increase in ESV is greater than the increase in EDV.)
Note: The curve shifts down. To restore a normal SV, preload must increase significantly (moving right along the new, lower curve).
Summary Table
Change | Effect on Curve | End-Diastolic Volume (EDV) | End-Systolic Volume (ESV) | Stroke Volume (SV) |
|---|---|---|---|---|
↑ Preload | Move UP & RIGHT on same curve | ↑ | ↔ | ↑ |
↑ Contractility | Shift UP & LEFT | ↔ | ↓ | ↑ |
↑ Afterload | Shift DOWN & RIGHT | ↑ | ↑ | ↓ |
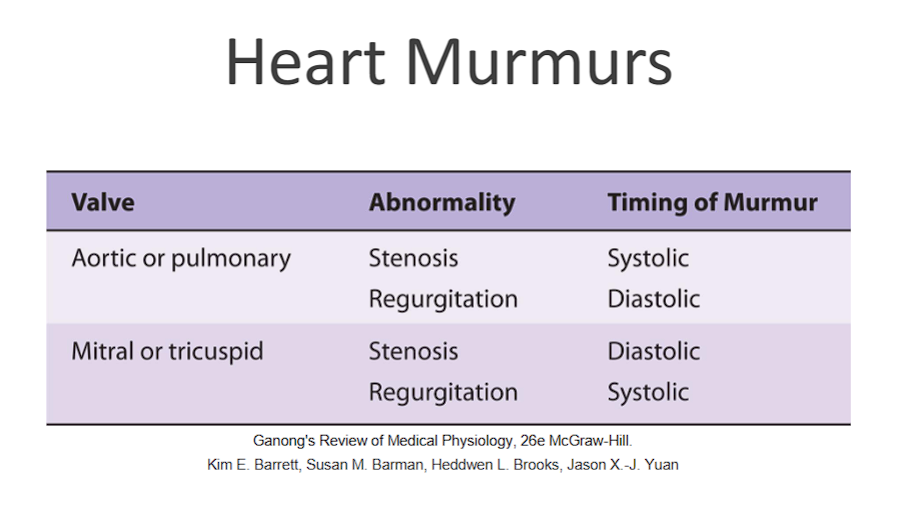
Describe the changes in cardiac pressures and volumes, and associated electrical events and heart sounds, that occur during the cardiac cycle.
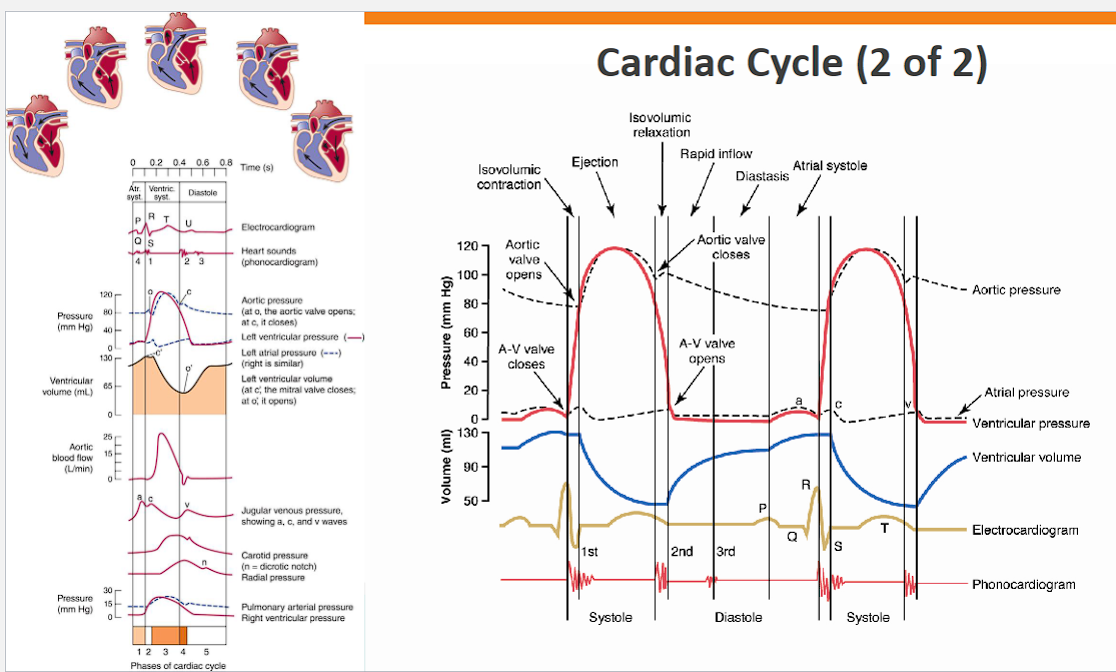
Here is a detailed, phase-by-phase description of the cardiac cycle, integrating pressures, volumes, electrical events (ECG), and heart sounds.
The cardiac cycle for the left heart is described below. All pressures are in mmHg. The cycle begins with the heart in diastole (relaxation) and blood flowing into the atria.
Phase 1: Atrial Systole
Electrical Event: The P wave on the ECG, representing depolarization of the atria.
Pressure Changes:
Atrial Pressure: Rises slightly (the 'a' wave, from ~5 to ~10 mmHg).
Ventricular Pressure: Rises slightly as blood is ejected from the atria.
Aortic Pressure: Continues its slow decline from the previous cycle (~80 mmHg).
Volume Changes:
Ventricular Volume: Increases by about 10-15%, reaching its maximum, the End-Diastolic Volume (EDV ~120 mL). This final push of blood is the "atrial kick."
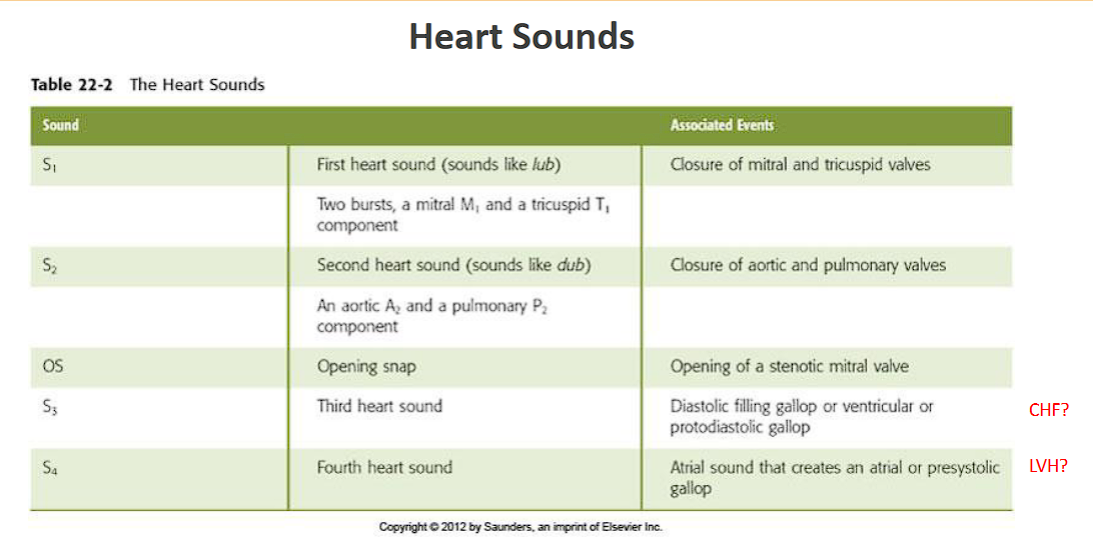
Heart Sounds:
Usually silent. A fourth heart sound (S4) may be heard if the atrium contracts against a stiff, non-compliant ventricle (e.g., in hypertrophy).
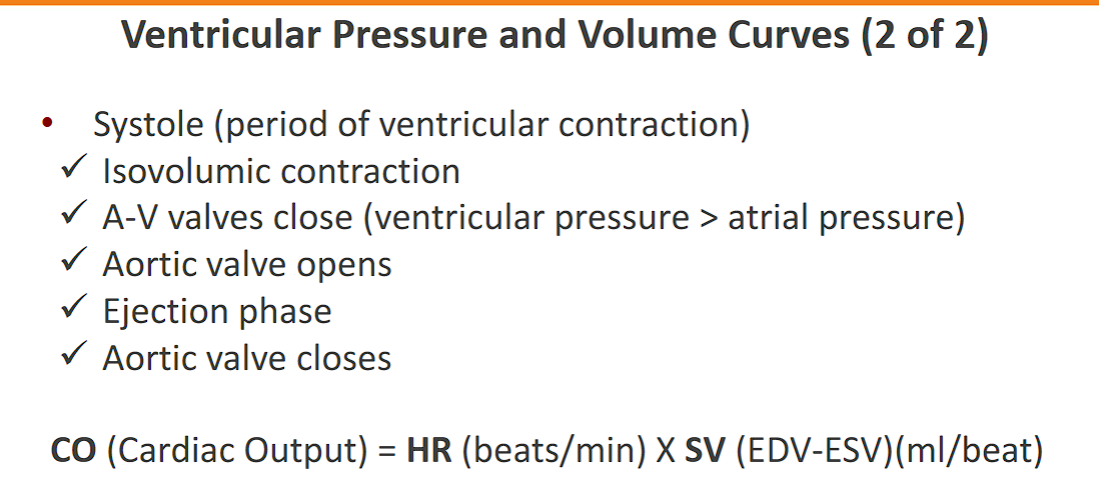
Phase 2: Isovolumetric Contraction
Electrical Event: The QRS complex on the ECG, representing ventricular depolarization.
Pressure Changes:
Ventricular Pressure: Rises rapidly and dramatically as the ventricle contracts. The pressure must rise from near zero to just above the diastolic aortic pressure (~80 mmHg).
Atrial Pressure: Falls as the AV valve bulges into the atrium (the 'c' wave).
Aortic Pressure: Continues to fall.
Volume Changes:
Ventricular Volume: Remains constant (at EDV). This is "isovolumetric" because all valves are closed—the aortic valve is shut because ventricular pressure is still below aortic pressure, and the mitral valve has just snapped shut.
Heart Sounds:
First Heart Sound (S1): Heard at the beginning of this phase. It is caused by the closure of the AV valves (mitral and tricuspid) and the vibration of surrounding structures.
Phase 3: Rapid Ejection
Electrical Event: The ST segment on the ECG, representing the period when the ventricles are fully depolarized and contracting.
Pressure Changes:
Ventricular Pressure: Continues to rise, peaking at around 120 mmHg.
Aortic Pressure: Rises rapidly to its systolic peak (~120 mmHg) as blood is forcefully ejected into the aorta.
Atrial Pressure: Begins to rise as blood fills the atria from the veins (the 'v' wave), but the AV valves remain closed.
Volume Changes:
Ventricular Volume: Decreases rapidly as about 70% of the stroke volume is ejected in this phase.
Heart Sounds:
Usually silent.
Phase 4: Reduced Ejection
Electrical Event: The peak of the T wave on the ECG, representing ventricular repolarization (the start of relaxation).
Pressure Changes:
Ventricular Pressure: Begins to fall as the ventricle starts to relax.
Aortic Pressure: Also begins to fall from its peak, but remains slightly higher than ventricular pressure, allowing the final 30% of stroke volume to trickle out.
Atrial Pressure: Continues to rise as venous return continues.
Volume Changes:
Ventricular Volume: Decreases slowly, reaching its minimum, the End-Systolic Volume (ESV ~50 mL) at the end of this phase.
Heart Sounds:
Usually silent.
Phase 5: Isovolumetric Relaxation
Electrical Event: The end of the T wave on the ECG.
Pressure Changes:
Ventricular Pressure: Falls rapidly and dramatically.
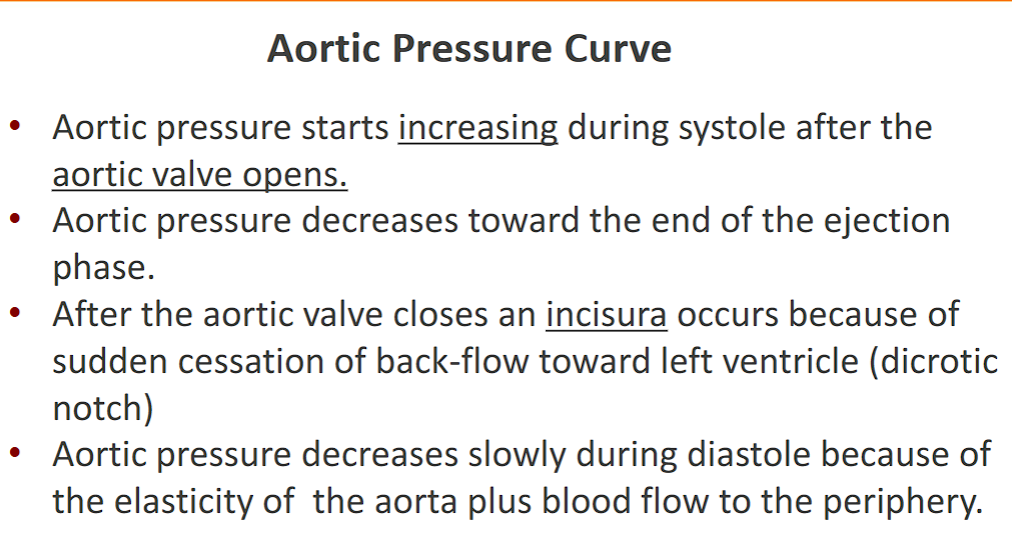
Aortic Pressure: Shows a brief dicrotic notch (incisura) caused by the brief backflow of blood that snaps the aortic valve closed. Pressure then continues to fall smoothly to its diastolic level.
Atrial Pressure: Rises to its peak (the peak of the 'v' wave) as it is now full of blood.
Volume Changes:
Ventricular Volume: Remains constant (at ESV). This is "isovolumetric" because all valves are closed again—the aortic valve has just closed, and the AV valve remains closed because ventricular pressure is still higher than atrial pressure.
Heart Sounds:
Second Heart Sound (S2): Heard at the beginning of this phase. It is caused by the closure of the semilunar valves (aortic and pulmonic).
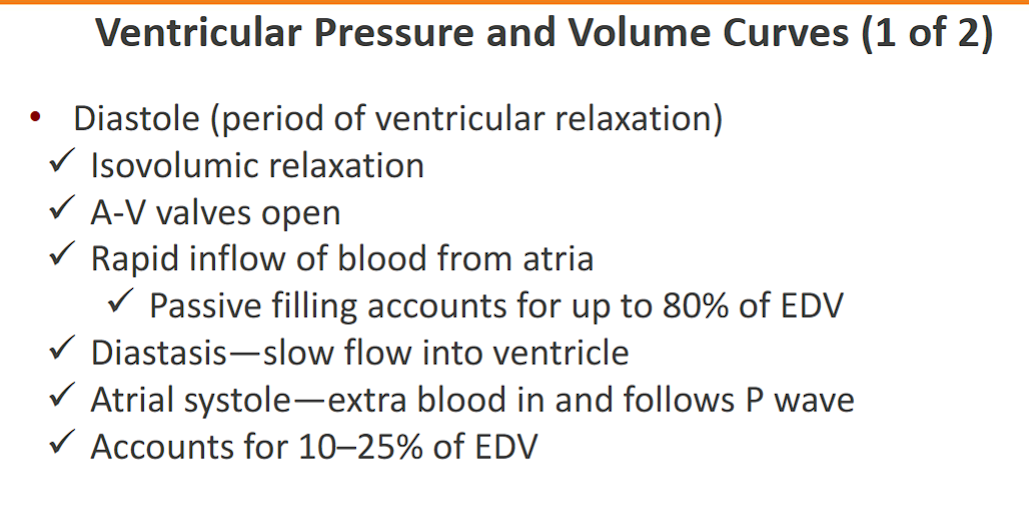
Phase 6: Rapid Ventricular Filling
Electrical Event: The TP segment / isoelectric line on the ECG, representing the heart at rest.
Pressure Changes:
Ventricular Pressure: Falls below atrial pressure.
Atrial Pressure: Drops sharply (the 'y' descent) as blood rushes out of the atria.
Aortic Pressure: Continues its slow decline.
Volume Changes:
Ventricular Volume: Increases rapidly as blood stored in the atria pours into the ventricle. This accounts for most of the ventricular filling.
Heart Sounds:
A third heart sound (S3) may be heard in early diastole if there is rapid filling into a non-compliant or dilated ventricle (can be normal in young, healthy people but pathologic in adults with heart disease).
Phase 7: Diastasis (Slow Ventricular Filling)
Electrical Event: The TP segment continues.
Pressure Changes:
All pressures are low and stable. Atrial and ventricular pressures slowly equalize.
Volume Changes:
Ventricular Volume: Increases slowly and gradually, completing the filling process. This phase is shortened during tachycardia.
Heart Sounds:
Silent.
The cycle then repeats with the next P wave and atrial systole.
Summary Table for Quick Reference
Phase | ECG | Key Pressure Event | Key Volume Event | Heart Sound |
|---|---|---|---|---|
1. Atrial Systole | P wave | Atrial 'a' wave | EDV reached | S4 (if pathologic) |
2. Isovolumetric Contraction | QRS complex | Ventricular pressure rises rapidly | Volume constant (at EDV) | S1 (AV valves close) |
3. Rapid Ejection | ST segment | Aortic pressure peaks | Volume decreases rapidly | - |
4. Reduced Ejection | T wave peak | Ventricular pressure falls | ESV reached | - |
5. Isovolumetric Relaxation | End of T wave | Aortic valve closes (Dicrotic notch) | Volume constant (at ESV) | S2 (Semilunar valves close) |
6. Rapid Filling | TP segment | Atrial 'y' descent | Volume increases rapidly | S3 (if pathologic) |
7. Diastasis | TP segment | Pressures equalize | Volume increases slow |
Know normal values for end-diastolic and end-systolic left ventricular volumes, atrial and ventricular pressures, and systolic and diastolic aortic and pulmonary arterial pressures.
Here is a concise list of the standard normal values for key cardiac pressures and volumes, which are essential for interpreting hemodynamics and diagnosing cardiovascular conditions.
Ventricular Volumes (Left Heart)
These values are typically measured via echocardiography, cardiac MRI, or ventriculography.
Parameter | Normal Value | Notes |
|---|---|---|
End-Diastolic Volume (EDV) | 120 - 130 mL | The maximum volume of blood in the ventricle just before contraction. |
End-Systolic Volume (ESV) | 50 - 60 mL | The minimum volume of blood remaining in the ventricle after contraction. |
Stroke Volume (SV) | 60 - 70 mL | SV = EDV - ESV. The volume ejected per beat. |
Ejection Fraction (EF) | 55% - 65% | EF = (SV / EDV) x 100%. A key index of systolic function. |
Cardiac Pressures (Measured in mmHg)
These values are typically obtained during a right heart catheterization or left heart catheterization.
Left Heart Chambers & Great Vessels
Chamber / Vessel | Systolic Pressure | Diastolic Pressure | Mean Pressure |
|---|---|---|---|
Left Atrium | (a-wave: 10-12) | (v-wave: 12-15) | 4 - 12 |
Left Ventricle | 90 - 140 | 5 - 12 | - |
Aorta | 90 - 140 | 60 - 90 | 70 - 105 |
Note: The systolic pressures of the Left Ventricle and Aorta are essentially identical (the small difference is the pressure gradient needed to open the aortic valve).
Right Heart Chambers & Great Vessels
Chamber / Vessel | Systolic Pressure | Diastolic Pressure | Mean Pressure |
|---|---|---|---|
Right Atrium | (a-wave: 4-6) | (v-wave: 4-6) | 2 - 8 |
Right Ventricle | 15 - 30 | 2 - 8 | - |
Pulmonary Artery | 15 - 30 | 4 - 12 | 9 - 18 |
Summary Table for Quick Reference
Parameter | Normal Value |
|---|---|
Left Ventricular End-Diastolic Volume (EDV) | 120 - 130 mL |
Left Ventricular End-Systolic Volume (ESV) | 50 - 60 mL |
Stroke Volume (SV) | 60 - 70 mL |
Ejection Fraction (EF) | 55% - 65% |
Left Atrial Pressure (Mean) | 4 - 12 mmHg |
Left Ventricular Pressure | 90-140 / 5-12 mmHg |
Aortic Pressure | 90-140 / 60-90 mmHg |
Right Atrial Pressure (Mean) | 2 - 8 mmHg |
Right Ventricular Pressure | 15-30 / 2-8 mmHg |
Pulmonary Artery Pressure | 15-30 / 4-12 mmHg |
Important Clinical Context
Preload: Left Ventricular EDV is the primary measure of preload. Clinically, it is often estimated by the Left Ventricular End-Diastolic Pressure (LVEDP), which should be ≤ 12 mmHg, or the Pulmonary Capillary Wedge Pressure (PCWP), which should be 6-12 mmHg.
Afterload: For the left ventricle, afterload is closely related to the Systemic Vascular Resistance (SVR), with a normal value of 800-1200 dynes·s·cm⁻⁵. For the right ventricle, it's related to the Pulmonary Vascular Resistance (PVR), with a normal value of <250 dynes·s·cm⁻⁵.
Hypertension: Aortic pressure consistently above 140/90 mmHg is classified as hypertension.
Pulmonary Hypertension: Mean Pulmonary Artery Pressure > 20 mmHg is considered pulmonary hypertension.
Draw and label ventricular pressure-volume loops derived from ventricular pressure and volume changes during the cardiac cycle.
Below is a drawn and labeled ventricular pressure-volume (PV) loop, followed by a detailed, step-by-step explanation of each segment and its correlation to the cardiac cycle.
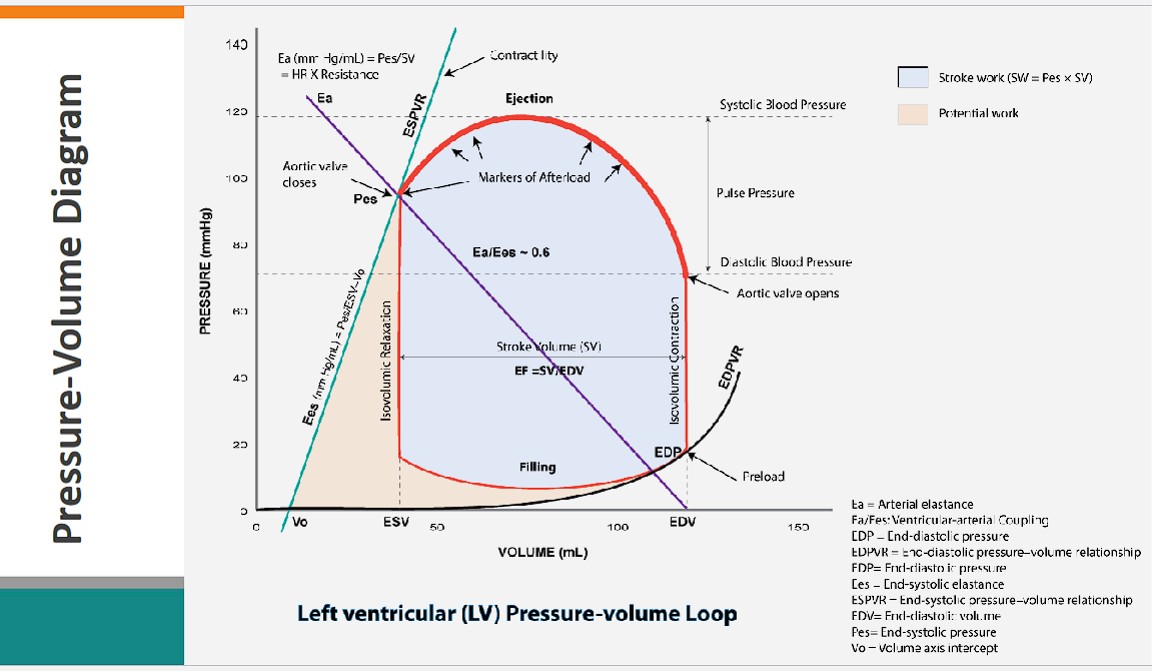
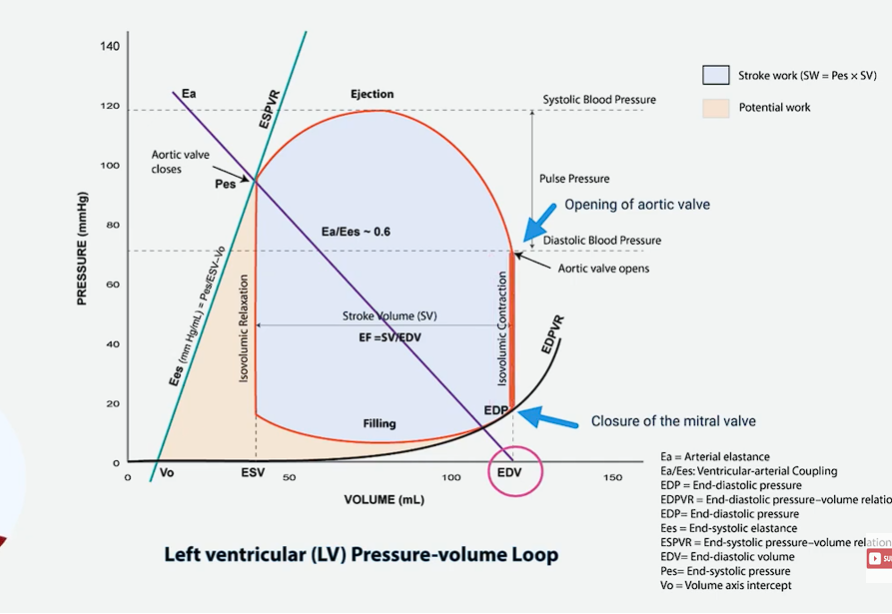
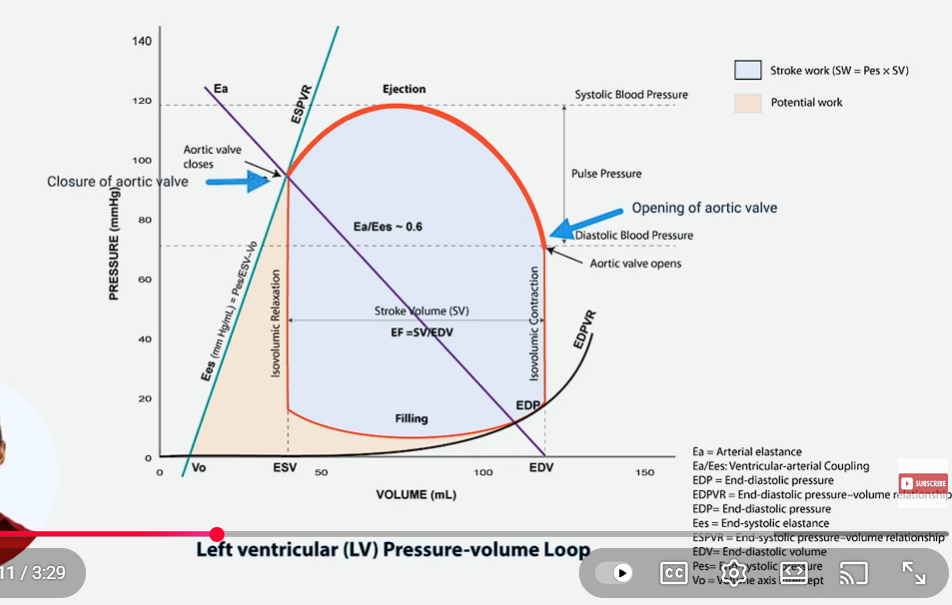
Ventricular Pressure-Volume Loop
This diagram plots Left Ventricular Pressure (mmHg) against Left Ventricular Volume (mL). The loop travels in a counter-clockwise direction.
Labeled Components:
Points:
A: Mitral Valve Opens
B: Mitral Valve Closes / End of Diastole
C: Aortic Valve Opens
D: Aortic Valve Closes / End of Systole
Segments:
A → B: Ventricular Filling
B → C: Isovolumetric Contraction
C → D: Ventricular Ejection
D → A: Isovolumetric Relaxation
Key Lines:
EDV: End-Diastolic Volume (~120 mL)
ESV: End-Systolic Volume (~50 mL)
ESPVR: End-Systolic Pressure-Volume Relationship
EDPVR: End-Diastolic Pressure-Volume Relationship
Step-by-Step Walkthrough of the Cardiac Cycle on the PV Loop
Let's trace the loop, starting at point A.
1. A → B: Ventricular Filling (Diastole)
Start: Mitral Valve Opens at point A.
What Happens: Blood flows passively from the left atrium into the left ventricle, rapidly increasing its volume. The small, gradual rise in pressure is due to the ventricle stretching as it fills.
End: The cycle is initiated by the P wave on the ECG (atrial depolarization), which causes atrial contraction and provides the final "atrial kick" to complete ventricular filling. This brings us to point B.
Point B: Mitral Valve Closes. This marks the End-Diastole.
Volume at B: End-Diastolic Volume (EDV, ~120 mL). This is the maximum volume and defines Preload.
Heart Sound: The closure of the mitral valve produces the first heart sound (S1).
2. B → C: Isovolumetric Contraction (Systole)
Start: Mitral Valve is closed.
What Happens: The ventricle begins to contract vigorously, triggered by the QRS complex on the ECG (ventricular depolarization). This causes a rapid, sharp increase in pressure.
"Isovolumetric" Means: Both the mitral (inlet) and aortic (outlet) valves are closed. The muscle is generating force, but no blood is ejected, so the ventricular volume remains constant (the line is vertical).
End Point C: Contraction continues until the left ventricular pressure just exceeds the pressure in the aorta (afterload), forcing the Aortic Valve to Open.
3. C → D: Ventricular Ejection (Systole)
Start: Aortic Valve Opens at point C.
What Happens: Blood is rapidly ejected into the aorta. The pressure rises to a peak and then begins to fall as the ventricle starts to relax (corresponding to the T wave on the ECG - ventricular repolarization).
Volume Change: The ventricular volume decreases significantly.
End Point D: Ejection continues until the falling ventricular pressure drops below the aortic pressure, causing the Aortic Valve to Close.
Volume at D: End-Systolic Volume (ESV, ~50 mL). This is the minimum volume.
Heart Sound: The closure of the aortic valve produces the second heart sound (S2).
4. D → A: Isovolumetric Relaxation (Diastole)
Start: Aortic Valve is closed.
What Happens: The ventricle relaxes. Pressure falls rapidly.
"Isovolumetric" Means: Both the aortic (outlet) and mitral (inlet) valves are closed again. The muscle is relaxing, but no blood is entering, so the ventricular volume remains constant (another vertical line).
End Point A: Relaxation continues until the left ventricular pressure falls below the left atrial pressure, causing the Mitral Valve to Open, and the cycle begins again.
Key Relationships Illustrated by the Loop
Stroke Volume (SV): The width of the loop. SV = EDV - ESV.
Stroke Work: The area inside the loop. This represents the total mechanical work done by the ventricle to pump blood.
Preload: Represented by the EDV (Point B).
Afterload: Represented by the pressure at the point where the aortic valve opens (Point C). Increased afterload (e.g., hypertension) would raise this point.
Contractility: Represented by the slope of the End-Systolic Pressure-Volume Relationship (ESPVR). A steeper slope indicates increased contractility, which would shift point D to the left, resulting in a lower ESV and a larger stroke volume.
pressure volume loop first phase
the first phase is the isovolumetric contraction
the isovolumetric contraction begins with the closure of the mitral valve and ends with the opening of the aortic valve.
during this phase, the volume within the left ventricle remains constant, as the ventricle contracts, leading to a rapid increase in pressure (that’s why the axis goes up)
this phase is represented by a vertical line moving upwards on the right side of the loop.
ventricular pressure rises because the mitral valve closes and the aortic valve opens.
pressure volume loop second phase
this second phase of the pressure volume loop is the ejection phase
in the ejection phase, there is the opening AND closing of the aortic valve.
the volume of the ventricle decreases (which is why the line moves to the left) as blood is ejected into the aorta, with the pressure initially rising to the peak BEFORE beginning to decrease.
key events of the ejection phase
opening of the aortic valve
ejection of blood from the ventricle
attainment of peak systolic pressure
closure of the aortic valve
PV loop phase three
the third phase is isovolumetric relation
starts with the closure of the aortic valve and ends of the opening of the mitral valve
during this phase, the volume of the ventricle remains constant at end systolic volume
the ventricle relaxes, causing the pressure to sharply drop
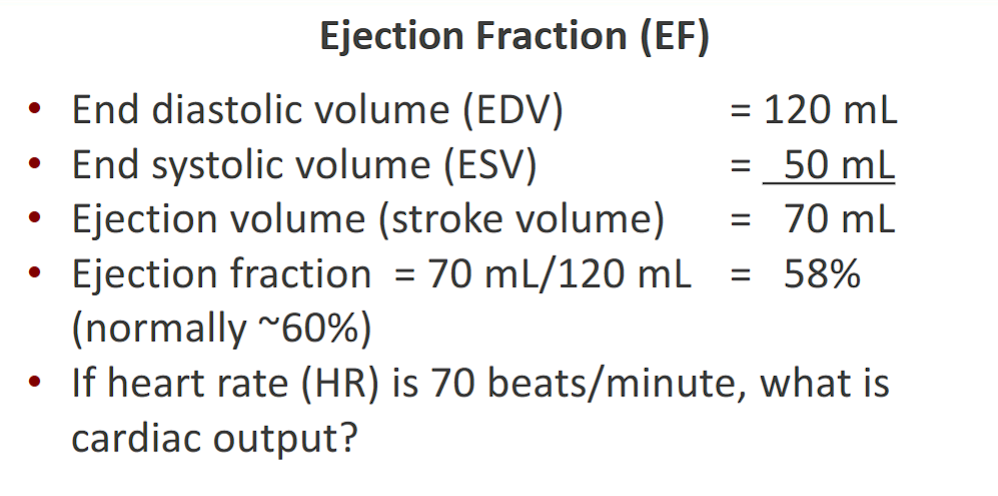
Calculate ejection fraction and stroke volume from end-diastolic and end-systolic volumes.
Calculating Stroke Volume (SV) and Ejection Fraction (EF) from end-diastolic and end-systolic volumes is straightforward and fundamental in cardiology.
Here are the formulas and examples:
1. Stroke Volume (SV)
Definition: The volume of blood pumped out of the left ventricle with each heartbeat.
Formula:
SV = EDV - ESV
Where:
EDV = End-Diastolic Volume (the volume of blood in the ventricle just before it contracts)
ESV = End-Systolic Volume (the volume of blood remaining in the ventricle after it contracts)
Example Calculation:
If a patient has:
EDV = 140 mL
ESV = 70 mL
Then their Stroke Volume is:
SV = 140 mL - 70 mL = 70 mL
2. Ejection Fraction (EF)
Definition: The percentage of blood pumped out of the left ventricle “ejection fraction” with each heartbeat relative to the amount that was in it initially. It is the primary clinical measure of the heart's pumping efficiency.
Formula:
Ejection Fraction = (SV / EDV) × 100%
stroke volume/ end diastole volume (makes sense).
You can also combine the formulas:
EF = [(EDV - ESV) / EDV] × 100%
Example Calculation (using the same patient):
EDV = 140 mL
ESV = 70 mL
SV = 70 mL
Then their Ejection Fraction is:
EF = (70 mL / 140 mL) × 100% = 0.50 × 100% = 50%
Interpretation & Normal Values
Parameter | Formula | Normal Value | Clinical Significance |
|---|---|---|---|
Stroke Volume (SV) |
| 60 - 100 mL | The absolute amount of blood ejected per beat. |
Ejection Fraction (EF) |
| 55% - 65% | The most important index of global systolic function. |
Classification of Heart Failure based on EF:
Heart Failure with reduced EF (HFrEF): EF ≤ 40%
Heart Failure with preserved EF (HFpEF): EF ≥ 50%
Heart Failure with mildly reduced EF (HFmrEF): EF 41-49%
In the example above, an EF of 50% would be considered borderline, potentially indicating HFpEF, especially if the patient has symptoms of heart failure.
Identify stroke volume and stroke work from a pressure-volume loop.
The pressure-volume (PV) loop provides a powerful visual representation of these key hemodynamic parameters.
Here is how to identify Stroke Volume and Stroke Work from a ventricular PV loop.
1. Stroke Volume (SV)
Definition: The volume of blood ejected from the ventricle per beat.
Formula: SV = EDV - ESV
On the PV Loop:
Stroke Volume is the WIDTH of the loop.
How to Identify It:
Locate the End-Diastolic Volume (EDV) on the X-axis. This is the bottom-right corner of the loop (the point just before the sharp vertical rise).
Locate the End-Systolic Volume (ESV) on the X-axis. This is the bottom-left corner of the loop (the point just after the vertical drop).
The horizontal distance between these two points is the Stroke Volume.
In the diagram above, the green double-headed arrow represents the Stroke Volume, which is the width of the loop.
2. Stroke Work
Definition: The total mechanical work performed by the ventricle to eject the stroke volume. It is the energy expended by the heart during a single heartbeat.
On the PV Loop:
Stroke Work is the AREA ENCLOSED WITHIN THE LOOP.
How to Identify It:
This area represents the sum of the work performed during the entire cycle:
Work done to generate pressure during isovolumetric contraction (the energy stored in the muscle).
Work done to eject blood against the aortic pressure during ejection (the external work).
The small amount of work dissipated as heat during isovolumetric relaxation.
In this diagram, the entire shaded area inside the blue loop represents the Stroke Work.
Summary Table
Parameter | Definition | PV Loop Representation | Units |
|---|---|---|---|
Stroke Volume (SV) | Volume ejected per beat ( | Width of the loop | mL |
Stroke Work (SW) | Total mechanical work per beat | Area inside the loop | mmHg·mL (Often converted to Joules: 1 J = 1000 mmHg·mL) |
Clinical Insight
A larger, wider loop indicates a higher stroke volume (e.g., during exercise or with increased preload).
A taller, wider loop with a larger internal area indicates the ventricle is performing more work (e.g., due to high afterload like hypertension, or high preload and high contractility as in exercise).
In heart failure, the loop may become smaller and narrower (less stroke volume) and shifted to the right (higher EDV), with a smaller enclosed area, indicating the heart is doing less work, but doing it inefficiently from a dilated state.
Show how changes in preload, afterload, and contractility affect ventricular-end diastolic volume, end-systolic volume, and stroke volume by using pressure-volume loops.
The pressure-volume (PV) loop is the most powerful tool for visualizing how preload, afterload, and contractility independently affect ventricular function. Below is a detailed explanation with diagrams.
The Control (Baseline) PV Loop
Let's first establish a baseline loop with normal values:
End-Diastolic Volume (EDV): 120 mL
End-Systolic Volume (ESV): 50 mL
Stroke Volume (SV): 70 mL (Width of the loop)
Stroke Work: Area inside the loop.
The black loop and the black End-Systolic Pressure-Volume Relationship (ESPVR) line represent the control state.
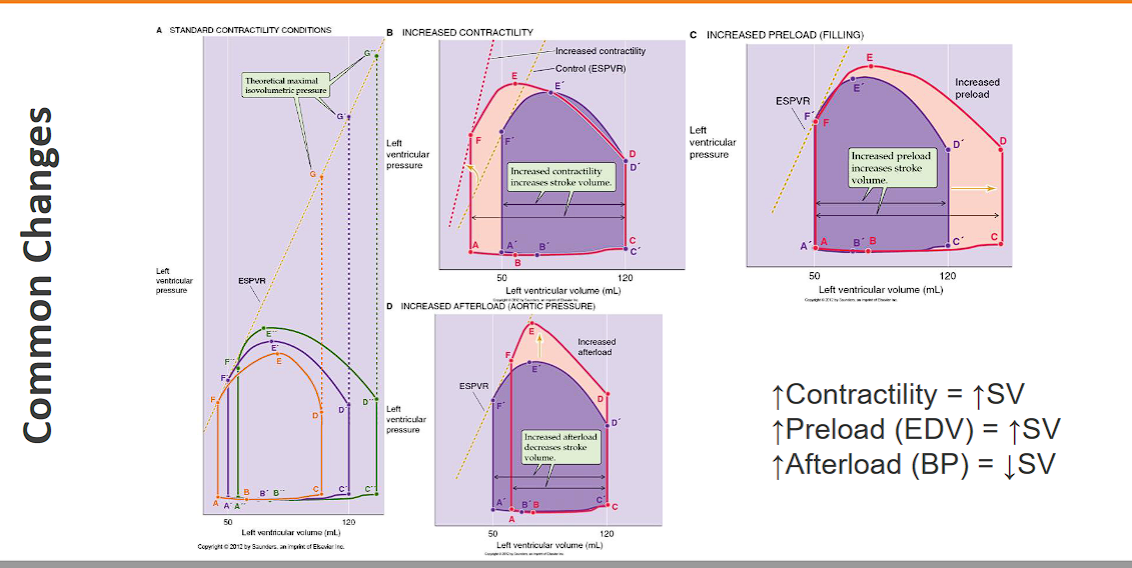
1. Effect of Increased PRELOAD
What it is: Increased stretch on the ventricle before contraction (increased EDV).
Cause: Increased venous return (e.g., fluid infusion, exercise).
On the PV Loop:
The loop shifts to the RIGHT along the same ESPVR.
The EDV point moves right (e.g., from 120 mL to 140 mL).
The ESV remains unchanged because the contractility (ESPVR slope) and afterload are the same.
The width of the loop increases, indicating an increased Stroke Volume.
Summary:
EDV: ↑
ESV: ↔
SV: ↑
Note: The red loop shows the effect of increased preload, shifting right along the unchanged ESPVR.
2. Effect of Increased AFTERLOAD
What it is: Increased resistance the ventricle must eject against.
Cause: Hypertension, aortic stenosis.
On the PV Loop:
The loop shifts UP and to the RIGHT.
The ESPVR does not change (contractility is unchanged).
The EDV increases because the ventricle cannot eject as effectively, so more blood remains from the previous beat, leading to a higher filling volume over several cycles.
The ESV increases significantly because the higher pressure causes ejection to stop earlier.
The width of the loop decreases, indicating a decreased Stroke Volume.
Summary:
EDV: ↑
ESV: ↑
SV: ↓
Note: The red loop shows increased afterload. Ejection stops at a higher pressure and volume, resulting in a narrower, taller loop.
3. Effect of Increased CONTRACTILITY
What it is: Increased intrinsic strength of the heart muscle.
Cause: Sympathetic stimulation, inotropic drugs (e.g., adrenaline, dopamine).
On the PV Loop:
The ESPVR shifts UP and to the LEFT (steeper slope).
The EDV remains unchanged (we are comparing at the same preload).
The ESV decreases because the more forceful contraction ejects more blood.
The width of the loop increases, indicating an increased Stroke Volume.
Summary:
EDV: ↔
ESV: ↓
SV: ↑
Note: The red loop shows increased contractility. The steeper ESPVR (dashed red line) allows the ventricle to eject to a lower ESV, creating a wider loop.
Summary Table
Change | Effect on PV Loop | EDV | ESV | SV |
|---|---|---|---|---|
↑ Preload | Shifts RIGHT on same ESPVR | ↑ | ↔ | ↑ |
↑ Afterload | Shifts UP & RIGHT | ↑ | ↑ | ↓ |
↑ Contractility | ESPVR shifts LEFT; Loop shifts LEFT | ↔ | ↓ | ↑ |
This framework is crucial for understanding the pathophysiology of heart failure and the mechanisms of action of cardiovascular drugs. For example:
A vasodilator reduces afterload, shifting the loop down and left, increasing SV.
A diuretic reduces preload, shifting the loop left, decreasing EDV and relieving pulmonary congestion.
An inotrope increases contractility, shifting the ESPVR left, which increases SV and decreases ESV.
pressure volume diagram
This is an excellent summary of the practical methods for estimating the Mean Electrical Axis (MEA) of the heart from an ECG. Let's break down these points and clarify the process.
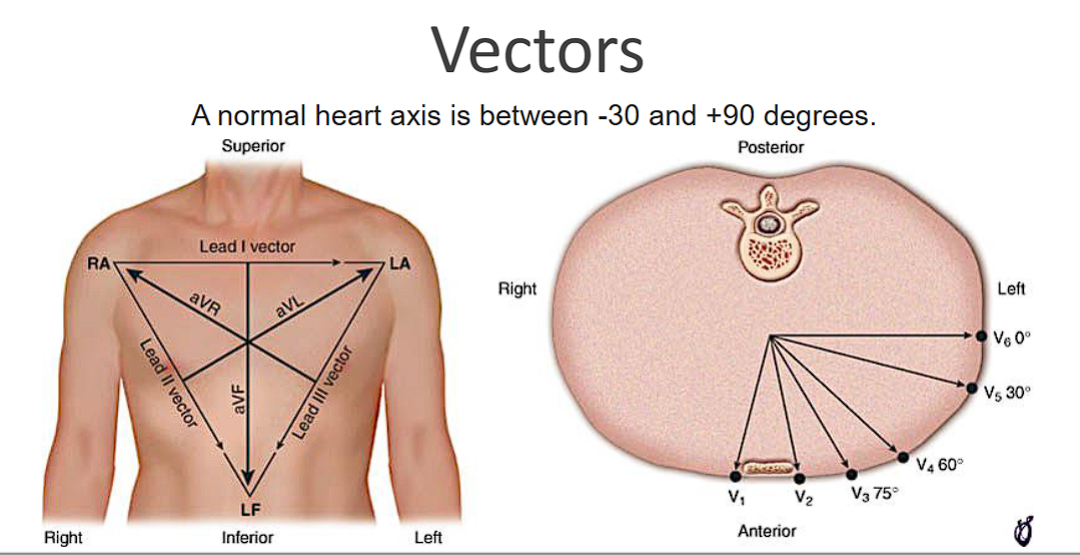
Understanding the Mean Electrical Axis (MEA)
The MEA represents the average direction of the heart's electrical depolarization through the ventricles (the QRS complex) in the frontal plane. It's measured in degrees, using a circle where:
0° points to the patient's left.
+90° points straight down.
±180° points to the patient's right.
-90° (or 270°) points straight up.
The six limb leads (I, II, III, aVR, aVL, aVF) each "look" at the heart from different angles in this frontal plane.
The Three Methods You Described
Here is a step-by-step guide for each method.
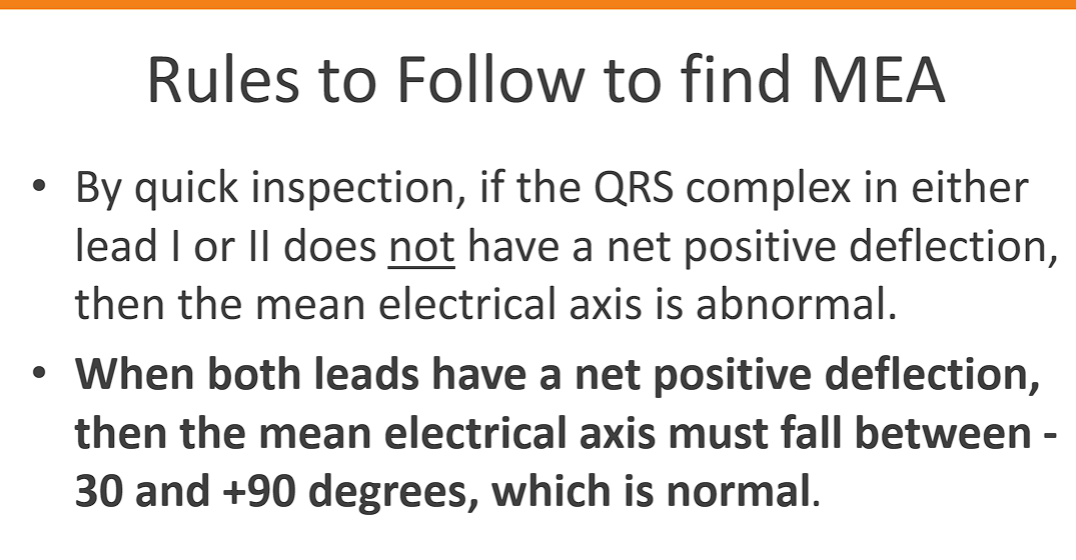
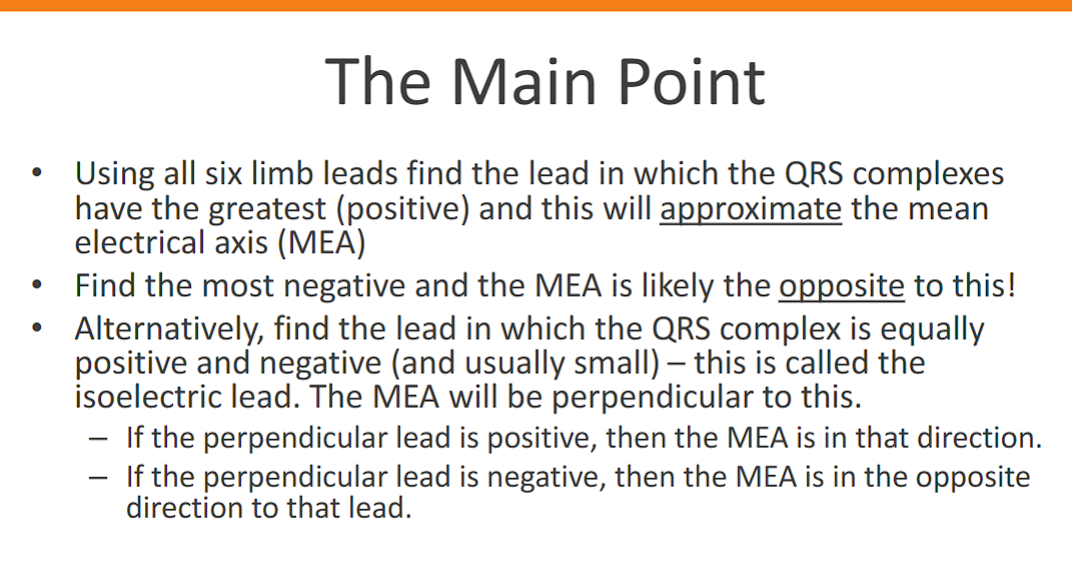
Method 1: The "Most Positive" Lead
This is the quickest and most common method.
Look at all six limb leads (I, II, III, aVR, aVL, aVF).
Identify the lead with the tallest, most positive QRS complex. Don't just count the number of positive boxes; find the one with the greatest net positive amplitude.
The MEA is approximately in the direction of that lead.
Lead I = 0°
Lead II = +60°
Lead III = +120°
aVR = -150° (or +210°) – This lead is almost always negative, so you'll rarely use it for this method.
aVL = -30° (or +330°)
aVF = +90°
Example: If the tallest QRS is in Lead II (+60°), the MEA is approximately +60°. If it's in aVF (+90°), the MEA is approximately +90°.
Method 2: The "Most Negative" Lead
This is a simple corollary to the first method and is useful for quick confirmation.
Identify the lead with the deepest, most negative QRS complex.
The MEA points directly away from this lead (i.e., 180 degrees opposite).
If the most negative lead is aVF (+90°), the MEA is opposite: +90° - 180° = -90°.
If the most negative lead is Lead I (0°), the MEA is opposite: 0° - 180° = ±180°.
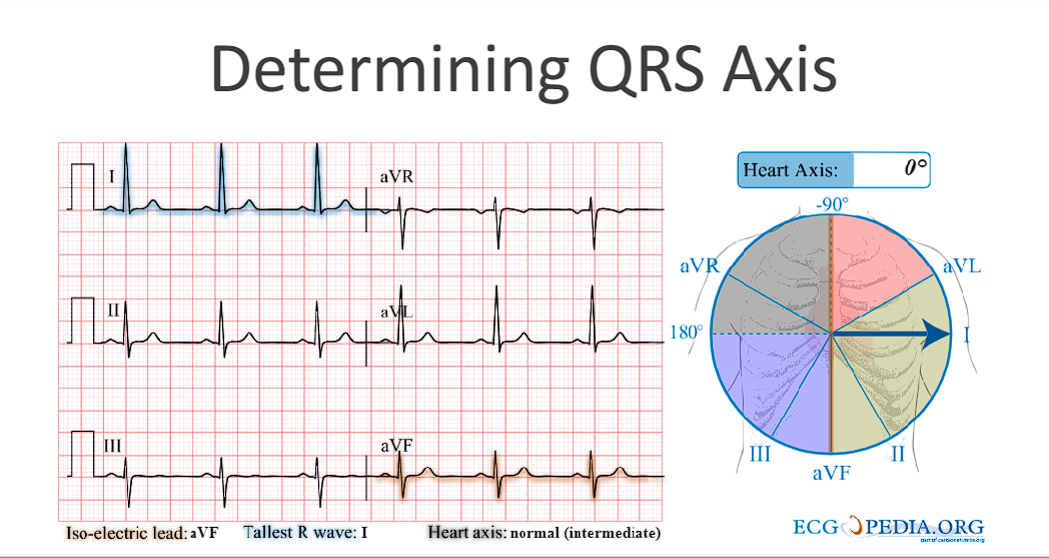
Method 3: The "Isoelectric Lead" (Most Accurate Estimation)
This is the most precise of the three manual methods. An isoelectric lead is one where the positive and negative deflections of the QRS complex cancel each other out, resulting in a net amplitude of zero or near-zero.
Find the isoelectric lead. Look for the lead where the area above and below the baseline is equal, making the QRS complex look like a small, biphasic wave (e.g., equally positive and negative).
The MEA is perpendicular (at a 90° angle) to this lead.
Determine the direction:
Look at one of the two leads that is perpendicular to your isoelectric lead.
If that perpendicular lead has a positive QRS complex, the MEA points in that direction.
If that perpendicular lead has a negative QRS complex, the MEA points in the opposite direction.
Practical Example
Let's say you have an ECG and you find:
Lead aVL is isoelectric (net QRS amplitude ~0).
The two leads perpendicular to aVL are Lead II (+60°) and Lead III (+120°). (Since aVL is at -30°, adding and subtracting 90° gives you +60° and -120°).
You now check Lead II and see it has a tall, positive QRS.
Conclusion: The MEA is in the direction of Lead II, at approximately +60°.
Conversely, if Lead II had been negative, the MEA would point in the opposite direction, which is -120°.
Summary Table for Quick Reference
Isoelectric Lead | Perpendicular Leads To Check | If the Perp. Lead is Positive, MEA is: | If the Perp. Lead is Negative, MEA is: |
|---|---|---|---|
I (0°) | aVF (-90°) | -90° | +90° |
II (+60°) | aVL (-30°) | -30° | +150° |
III (+120°) | aVR (-150°) | -150° (or +210°) | +30° |
aVR (-150°) | III (+120°) | +120° | -60° (or +300°) |
aVL (-30°) | II (+60°) | +60° | -120° (or +240°) |
aVF (+90°) | I (0°) | 0° | ±180° |
By using these three methods together, you can quickly and accurately estimate the heart's electrical axis from a standard ECG.
rules to follow to find MEA