CIT Microsoft Excel Review
1/77
There's no tags or description
Looks like no tags are added yet.
Name | Mastery | Learn | Test | Matching | Spaced |
|---|
No study sessions yet.
78 Terms
Microsoft Excel
It is a powerful tool you can use to create and format spreadsheets and analyze and share information to make informed decisions.
Microsoft Excel
It is a computerized worksheet.
It is a spreadsheet application program created by Microsoft Corporation
Microsoft Excel
The application is available in versions of Microsoft Windows and Mac OS X.
It is one of the programs included in Microsoft Office.
Microsoft Office Excel
Full name of MS Excel
Creates better spread sheets, Improves spreadsheet analysis, Share spreadsheets and business information with others, Manage business information more effectively
4 Functions of Microsoft Excel
Worksheet
An on-screen spreadsheet that contains various cells in columns and rows.
By entering information in the form of labels (in the form of text), values, and formulas into the worksheet cell, you create tables or spreadsheets, useful for summarizing (through charts and tables), organizing, analyzing and graphing data.
Workbook
Contains one or more worksheets which are automatically named in the sheet tabs.
Contains 256 worksheets.
256
How many worksheets does one Excel workbook have?
Title Bar, Ribbon
2 parts of Microsoft Excel
Title Bar
Parts of Microsoft Excel
This is where Microsoft Excel displays the name of the workbook you are currently using.
At the top of the Excel window, you should see “Microsoft Excel.”
Ribbon
Parts of Microsoft Excel
Used to issue commands.
Located near the top of the Excel window, below the Quick Access toolbar
At the top of the Ribbon are several tabs; clicking a tab displays several related command groups.
You may also find a dialog box launcher in the bottom-right corner of a group.
Ribbon Groups
Parts of Microsoft Excel
Organizes commands.
Forms the Ribbon when put all together.
Home, Insert, Page Layout, Formulas, Data, Review, View, Add Ins
8 Tabs of the Ribbon
Home
8 Tabs of the Ribbon
Includes some of the most commonly used button like those for cutting and pasting information, formatting data, etc
Page Layout
8 Tabs of the Ribbon
Lets you set up margins, paper orientation and other page setting
Insert
8 Tabs of the Ribbon
Lets you add tables, graphics, charts, hyperlink, textbook and Word Art.
Formulas
8 Tabs of the Ribbon
Contains mathematical instruction that you use to perform calculations.
Data
8 Tabs of the Ribbon
Lets you get information from an outside data source (database) so you can analyze it in Excel. It also includes stools for sorting, ltering and subgrouping.
Review
8 Tabs of the Ribbon
Includes office profiling tools (like spell checker). It also has buttons that lets you add comments to a worksheet and manage revision.
Add Ins
8 Tabs of the Ribbon
This tab is visible only if you have loaded a workbook or add in that customizes the menu or toolbars.
View
8 Tabs of the Ribbon
Lets you switch on and off a variety of viewing options.
Workbook
The file in which you work and store your data. It contains one or more worksheets.
Worksheets
The primary document that you use in Excel to store and work with data.
It is also called a Spreadsheet.
Consists of cells that are organized into columns and rows.
Active Cell
The selected cell in which data is entered when you begin typing.
Only one cell is active at a time.
A cell is an alignment between a row and a column.
Cell
Alignment between a row and a column.
Active Sheet
The sheet that you are working on in a workbook.
Rows
The numbers down the side of the worksheet.
Column
The letters across the top of the worksheet.
Text Box
A rectangular object on a worksheet or chart in which you can type text.
Name Box
Displays the name of the active cell or the selected range and can be used to name a cell range and as a shortcut to a cell or range of cell.
Row Heading
The numbers down the side of the worksheet which identify the column in the worksheet.
Column Heading
The letters across the top of the worksheet which identify the column in the worksheet.
Worksheet Tab
The tabs at the bottom of the workbook which are labeled Sheet 1, Sheet 2, Sheet 3.
Office Assistant
Provides topics and tips to help you finish your job.
It is represented by animated picture.
It is capable of answering picture.
Button
A 3D control on the screen that looks like it is pushed in when you click on it.
Mouse Pointer
Mouse Shapes
An arrow that appears when the mouse is positioned in a menu bar, scroll bar or other area where an item can be selected.
I-Beam
Mouse Shapes
Appears when positioned in the formula bar.
Use for changing the cursor location and selecting text.
Cross Bar
Mouse Shapes
Appears when positioned between row or column headings.
Used to change the row height or column width.
Double Sided Arrow
Mouse Shapes
Appear when positioned on a window’s border
Used to resize the window
Fill Handle
Mouse Shapes
Used for copying formula or extending a data series.
A small square that appears in the bottom-right corner when you select a cell or range.
Split Screen Arrow
Mouse Shapes
Appears when positioned over the split bar directed above the vertical scroll arrow.
Used to split the worksheet area into divided section.
Autofill
Mouse Shapes
Appears when positioned on the lower right corner of a cell or selected range
Used to fill adjacent cell with content of the active cell
Object Sizing Arrow
Mouse Shapes
A two-head arrow that appears when the mouse is positioned on the sizing handle of the selected object.
Magnifying Glass
Mouse Shapes
Appears in print preview mode
Used to zoom in for a closer view of a section of the document to be pointed.
Help Finger
Mouse Shapes
Appears when positioned over a Help Topic.
Used to move directly to the selected topic.
Hour Glass
Mouse Shapes
Appears whenever Excel is executing a command indicates that you must wait until the hourglass disappear to continue the next section.
CTRL + S
Excel Shortcuts
Saving your work
CTRL + P
Excel Shortcuts
Printing
CTRL + T
Excel Shortcuts
Creating Table
CTRL + Home
Excel Shortcuts
Going to the Top (Leftmost Side)
CTRL + End
Excel Shortcuts
Going to the End of Data (Rightmost Side)
CTRL + Arrow Down
Excel Shortcuts
Going to the End of Data (Same Column)
CTRL + Page Down
Excel Shortcuts
Going to the next WorkSheet
CTRL + Page Up
Excel Shortcuts
Going to the previous WorkSheet
Alt + M
Excel Shortcuts
Go to Formula Tab
CTRL + W
Excel Shortcuts
Close a Workbook
CTRL + O
Excel Shortcuts
Open a workbook
CTRL + C
Excel Shortcuts
Copy
CTRL + V
Excel Shortcuts
Paste
CTRL + Z
Excel Shortcuts
Undo
Delete
Excel Shortcuts
Remove Cell Content
Alt + H, H
Excel Shortcuts
Choose a fill color
CTRL + X
Excel Shortcuts
Cut
Alt + N
Excel Shortcuts
Go to Insert Tab
CTRL + B
Excel Shortcuts
Bold
CTRL + 0
Excel Shortcuts
Hide the selected columns
CTRL + 9
Excel Shortcuts
Hide the selected rows
Column Chart, Line Chart, Pie Chart, Doughnut Charts, Bar Chart, Area Chart, Scatter Chart, Funnel Chart, Histogram Chart, Pareto Chart
11 Chart Types in Excel
Column Chart
11 Chart Types in Excel
Data that’s arranged in columns or rows can be plotted in a ______ chart.
Displays categories along the horizontal (category) axis and values along the vertical (value) axis
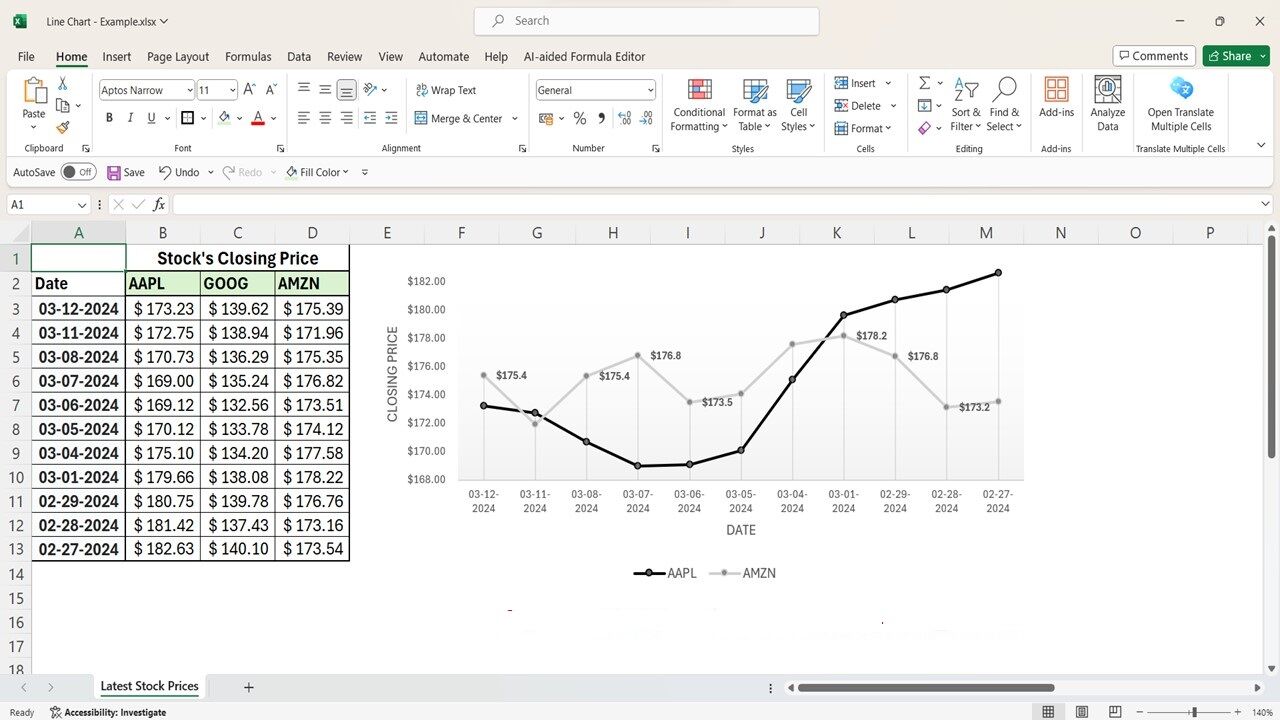
Line Chart
11 Chart Types in Excel
Data that’s arranged in columns or rows on a worksheet can be plotted in a ____ chart.
Category data is distributed evenly along the horizontal axis, and all value data is distributed evenly along the vertical axis.
Can show continuous data over time on an evenly scaled axis, so they are ideal for showing trends in data at equal intervals, like months, quarters, or fiscal years.
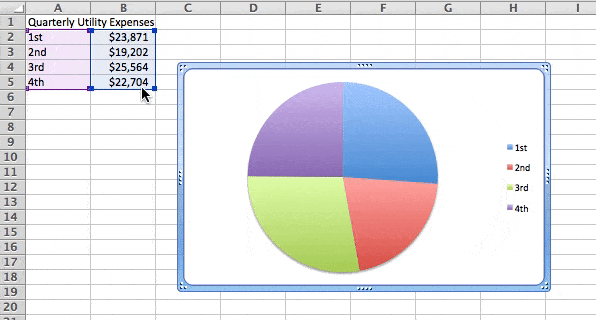
Pie Chart
11 Chart Types in Excel
Data that’s arranged in one column or row on a worksheet can be plotted in a ____ chart.
_____ charts show the size of items in one data series, proportional to the sum of the items.
Data points in a _____ chart are shown as a percentage of the whole pie
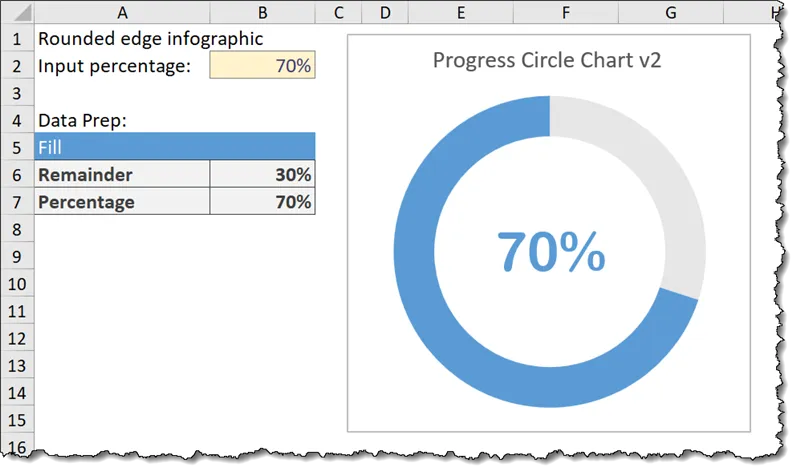
Doughnut Charts
11 Chart Types in Excel
Data that’s arranged in columns or rows only on a worksheet can be plotted in a ______ chart.
Like a pie chart, a _______ chart shows the relationship of parts to a whole, but it can contain more than one data series
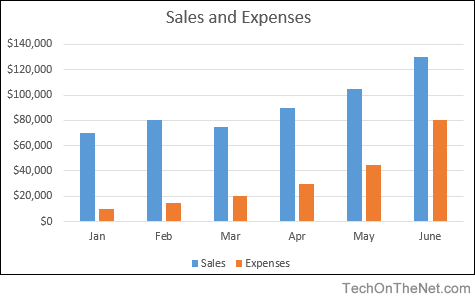
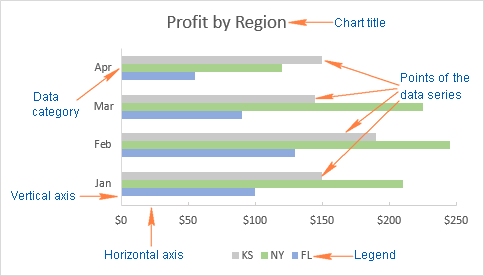
Bar Chart
11 Chart Types in Excel
Data that’s arranged in columns or rows on a worksheet can be plotted in a ____ chart.
Illustrate comparisons among individual items
In a ____ chart, the categories are typically organized along the vertical axis, and the values along the horizontal axis.
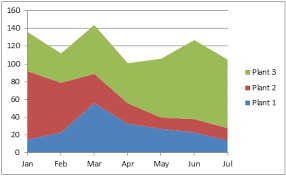
Area Chart
11 Chart Types in Excel
Data that’s arranged in columns or rows on a worksheet can be plotted in an ____ chart.
Can be used to plot change over time and draw attention to the total value across a trend.
By showing the sum of the plotted values, an ____ chart also shows the relationship of parts to a whole.
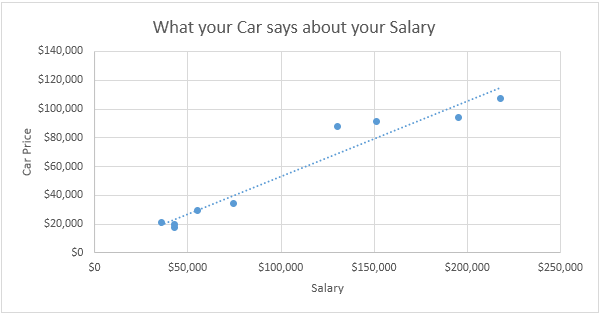
Scatter Chart
11 Chart Types in Excel
Data that’s arranged in columns and rows on a worksheet can be plotted in an xy (_____) chart.
A ______ chart has two value axes: a horizontal (x) and a vertical (y) value axis.
It combines x and y values into single data points and shows them in irregular intervals, or clusters.
Used for showing and comparing numeric values, like scientific, statistical, and engineering data.
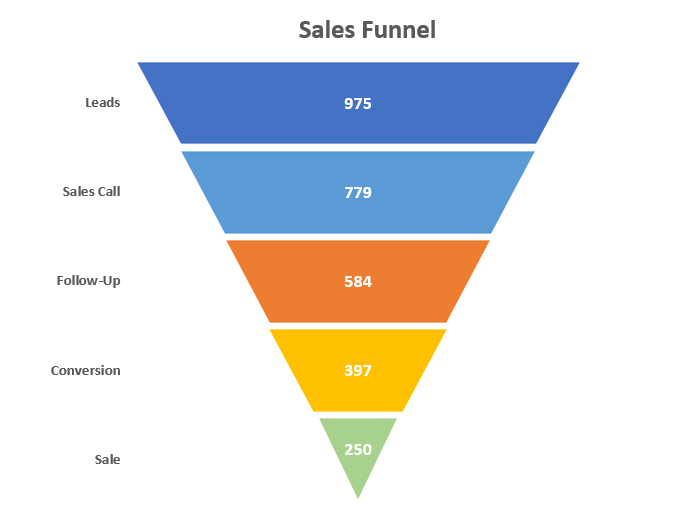
Funnel Chart
11 Chart Types in Excel
Shows values across multiple stages in a process.
Typically, the values decrease gradually, allowing the bars to resemble a ______.
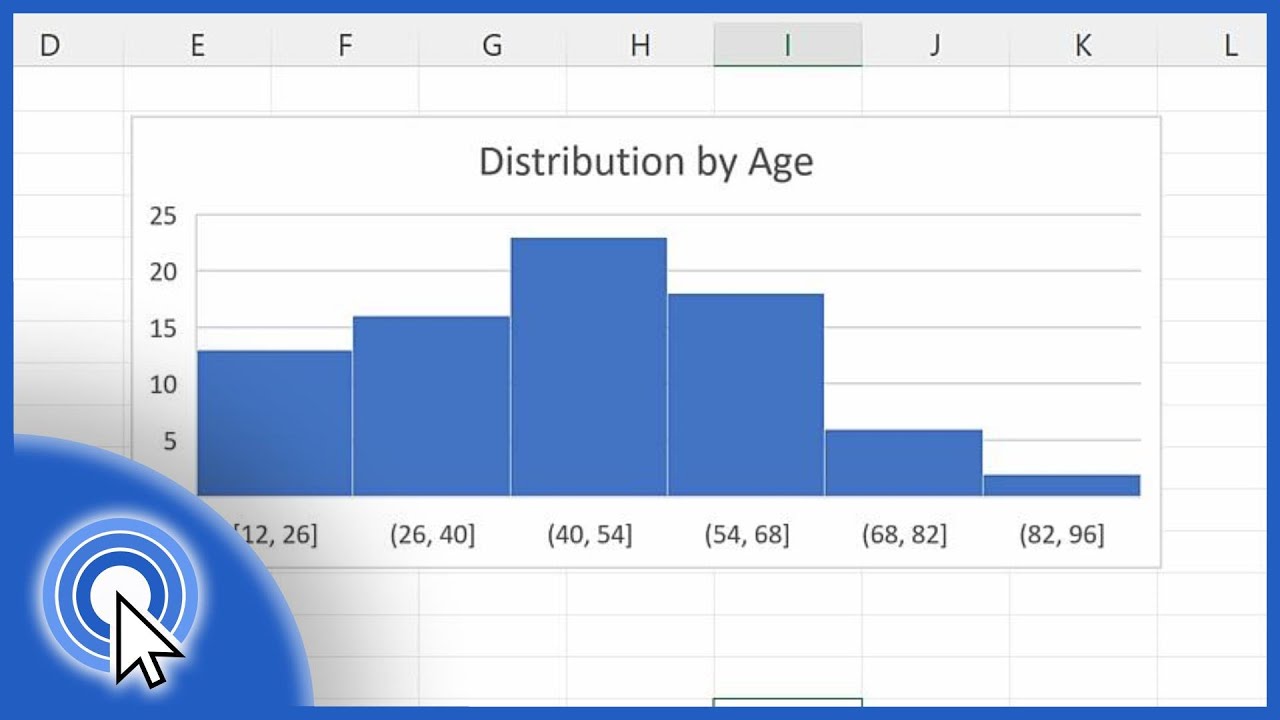
Histogram Chart
11 Chart Types in Excel
Shows the frequencies within a distribution.
Each column of the chart is called a bin, which can be changed to further analyze your data.
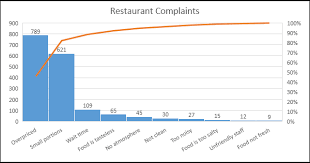
Pareto Chart
11 Chart Types in Excel
A sorted histogram chart that contains both columns sorted in descending order and a line representing the cumulative total percentage.
Often used to identify areas to focus on first when improving a process.