Evolutionary Evidence and Scientific Process Practice Problems
 Call Kai
 Learn
Learn Practice Test
 Spaced Repetition
 Match
Match Flashcards
 Knowt Play
1/29

There's no tags or description
Looks like no tags are added yet.
Name | Mastery | Learn | Test | Matching | Spaced | Call with Kai | Chat |
|---|
No analytics yet
Send a link to your students to track their progress
30 Terms
Which process defines the scientific process?
A. Exploration and Discovery
B. Testing Ideas
C. Community Analysis and Feedback
D. Benefits and Outcomes
B. Testing Ideas
Which step in the process of science follows testing ideas?
A. Exploration and Discovery
B. Community Analysis and Feedback
C. Benefits and Outcomes
D. All of these
D. All of these
12 children (mean age 6 years [range 3–10], 11 boys) were referred to a paediatric gastroenterology unit with a history of normal development followed by loss of acquired skills, including language, together with diarrhoea and abdominal pain. Children underwent gastroenterological, neurological, and developmental assessment and review of developmental records. Ileocolonoscopy and biopsy sampling, magnetic-resonance imaging (MRI), electroencephalography (EEG), and lumbar puncture were done under sedation. Barium follow-through radiography was done where possible. Biochemical, haematological, and immunological profiles were examined.Andrew Wakefield and colleagues published a paper in The Lancet in 1998 claiming a link between the MMR vaccine and autism. Which of the following methodological changes would have improved the experimental design:
A. Increasing the sample size from 12 children.
B. Declaring conflicts of interest prior to publication of the results.
C. Including a control group of vaccinated children without autism.
D. Include other vaccines in the vaccine history of the children
A. Increasing the sample size from 12 children.
B. Including a control group of vaccinated children without autism.
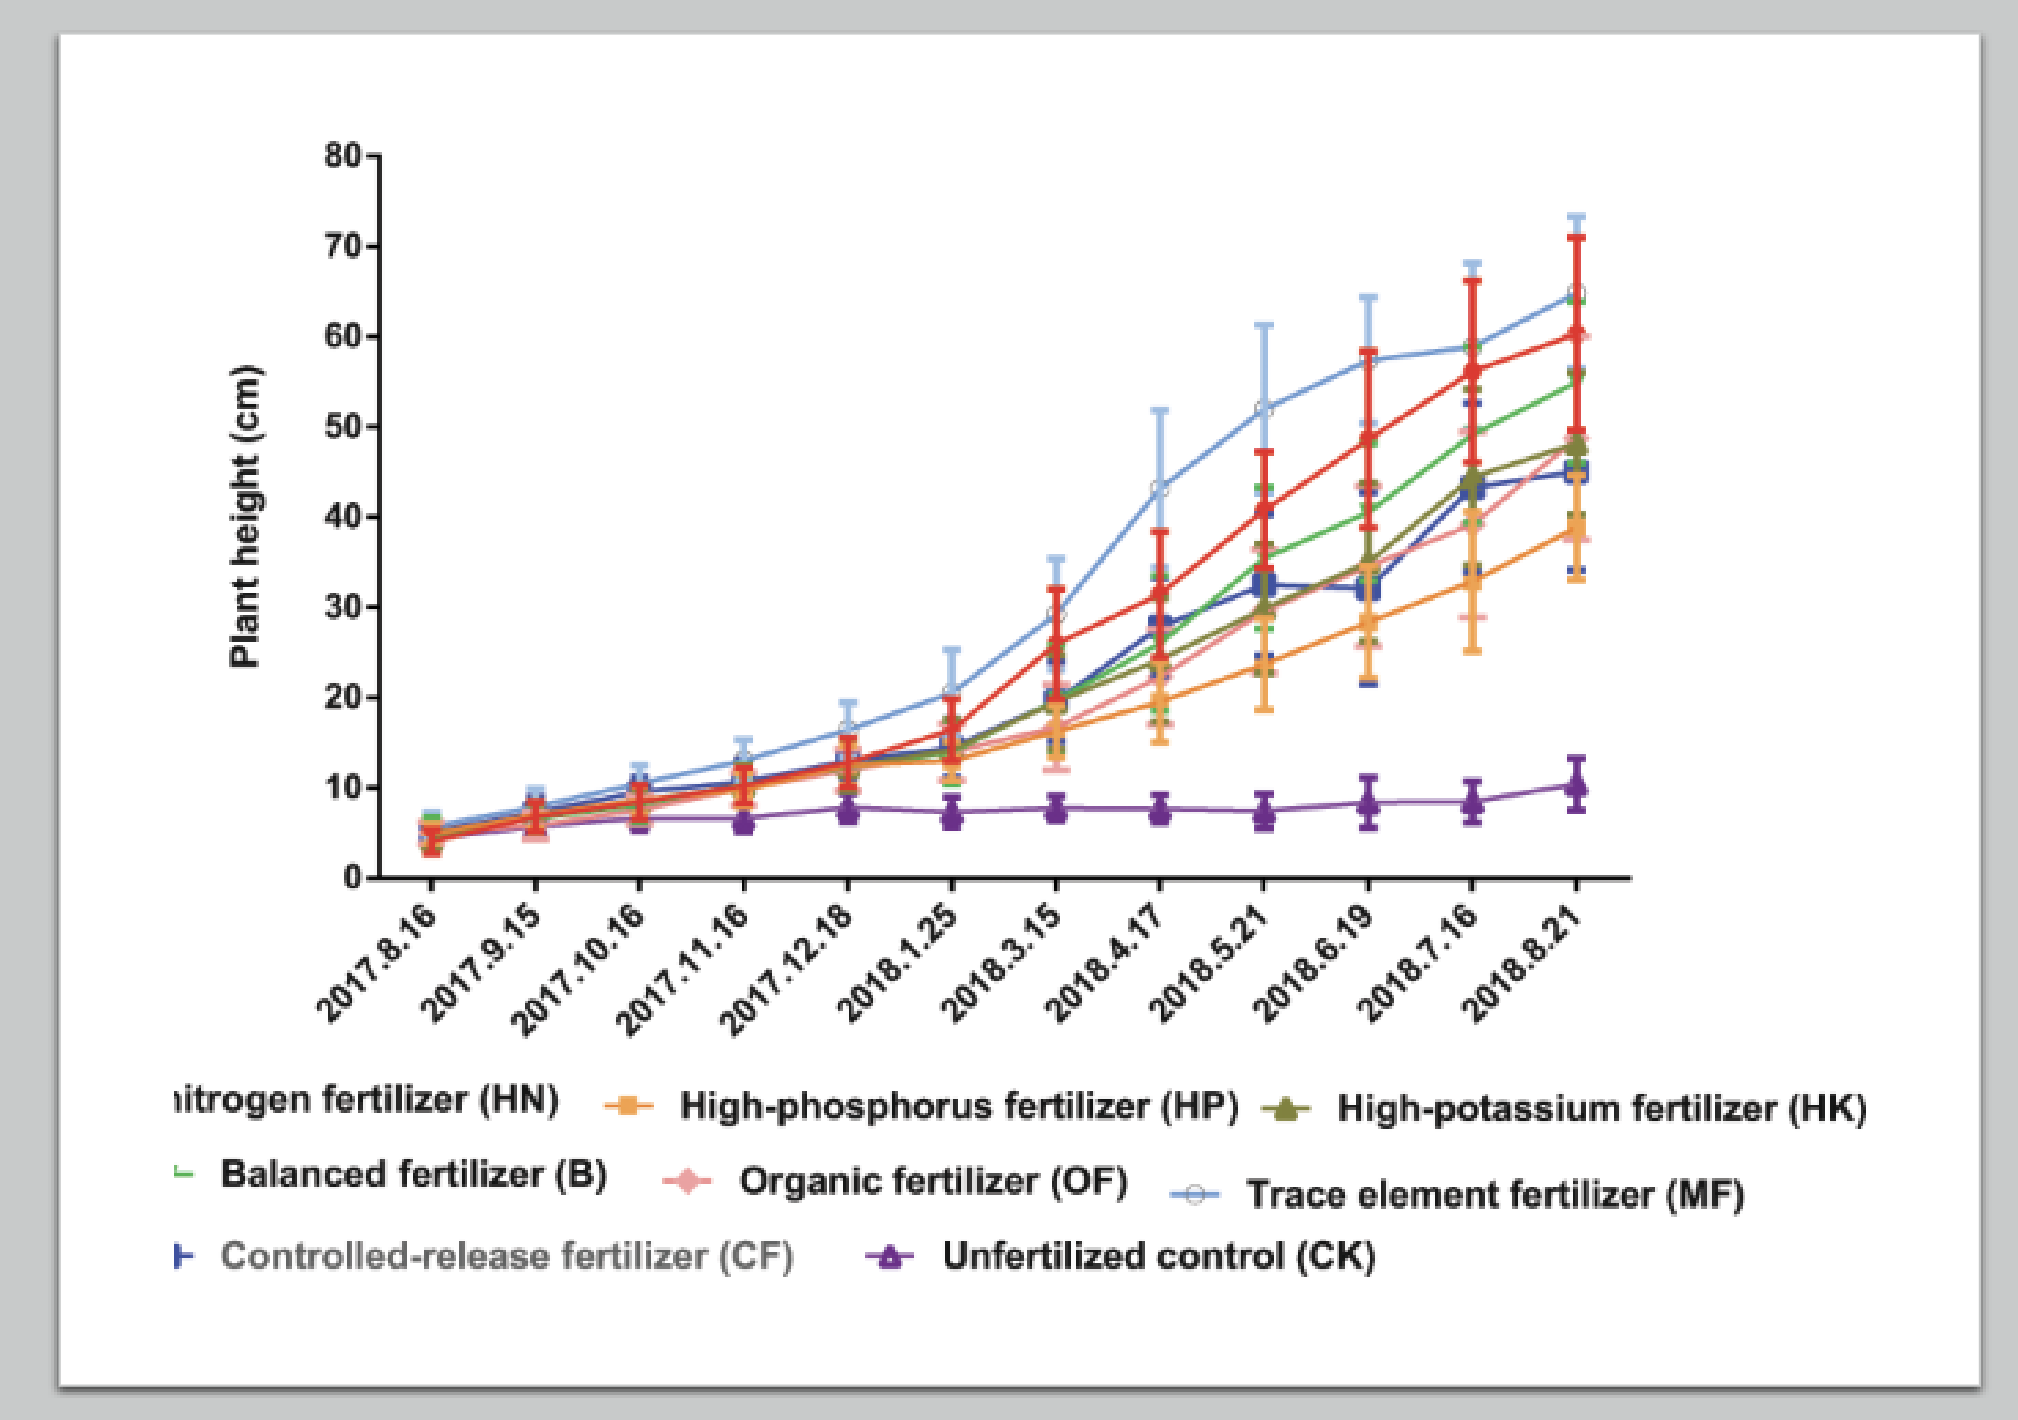
Which hypothesis does this graph support:
A. Fertilizer increases plant growth.
B. Fertilizer decreases plant growth.
C. Fertilizer does not affect plant growth.
A. Fertilizer increases plant growth.

A study of caffeine consumption and brain connectivity was published in Nature by Magalhães et al. The results were statistically significant. Does that mean coffee significantly decreases brain connectivity? Explain.
Claim: No
Evidence: the slope of the trendline is small
Reason: statistical significance indicates whether a result is real or not; it is not a measure of the effect size.
True or false: Laws can never be disproven in science.
False
If the probability of an event is 0.8, what is the percentage chance that the event will occur?
The percentage chance that the event will occur is 80%. To convert a probability to a percentage, multiply the probability by 100. Percentage: 100 × 0.8 = 80%
If an event occurs 3 out of 4 trials, what is the probability of that event?
The probability of the event is 0.75 (or 75%). To find the probability, divide the number of successful occurrences by the total number of trials. Probability = (Number of successful trials)/(Total trials) —→ ¾ = 0.75 or 75%
Solve for x. (x + 2)2 = 169
To solve $(x + 2)^2 = 169$ for $x$:
1. Take the square root of both sides:
(x+2)2=±169
x+2=±13
2. Set up two separate linear equations:
Case 1:
x+2=13
x=13−2
x=11
Case 2:
x+2=−13
x=−13−2
x=−15
The solutions are $x = 11$ and $x = -15$.
What is ¼ of 288?
288/1 × ¼ = 288/4 = 72

The Tiger and the Cub wanted to know if they could observe evolution in the laboratory. They set up an experiment with laboratory mice where only 50 mice with the fewest cavities were permitted to breed and produce the next generation. The results are shown in the graph to the left. What is the independent variable in this experiment?
The criteria for selection
Which of the following would confound a controlled experimental design? Select ALL that apply.
A. Including multiple control groups.
B. Including multiple independent variables.
C. Including multiple dependent variables.
D. Including multiple controlled variables.
B. Including multiple independent variables.
Meta-analyses are studies that collect the results from many other research papers about a specific question then statistically analyze the whole data set for trends. For example, a meta-analysis of fluoride in toothpaste and dental caries (Pires dos Santos et al, 2012) reviewed 159 articles and 8 clinical trials. They found support for using fluoridated toothpaste to prevent dental carries in primary teeth. What do meta-analyses like Pires dos Santos et al improve about the scientific process?
Increase scope of inference
While sequencing some DNA from a population of goby fish, one of the sequences doesn't match well with the others. To investigate this further, what should you do next:
A. Get analysis and feedback from the community.
B. Explore the sequence in further detail.
C. Any of these steps.
D. Test whether the sequence matches a different population.
C. Any of these steps.
Which of the following best explains why the theory of evolution is not a scientific law:
A. Some studies do not support the theory of evolution, so it cannot rise to become a law.
B. The theory of evolution doesn’t have enough evidence to support it yet.
C. Theories explain why or how a pattern exists whereas laws only describe the presence of a pattern.
D. Only theories can be disproven.
C. Theories explain why or how a pattern exists whereas laws only describe the presence of a pattern.
High quality hypotheses predict and explain a result.
True
Experiments only need to be repeated if the results do not support the hypothesis.
False

Car et al (2021) studied the evolution rate of tree frogs near the Chernobyl Exclusion Zone (CEZ, red) to the tree frogs in the rest of Europe. The researchers wished to understand whether radiation in the CEZ was affecting the tree frog populations. P-values are provided.
What is on the x-axis? What is on the y-axis? Are there any other variables represented? If so, how?
What is the independent variable? What is the dependent variable?
In one sentence, describe the pattern or trend created by the data.
Summarize the statistics descriptively (significance, effect size, variance).
What hypothesis does this data support? What hypothesis(es) does this data reject?
X-axis: populations. Y-axis: genetic diversity. Other: Panel B separated out specific haplotypes instead of clustering them.
IV: geography (specifically CEZ vs not in CEZ). DV: genetic diversity.
Mitochondrial genetic diversity was higher in frogs from the CEZ than from outside of it, but their nuclear genetic diversity was the same.
Significance: Panel A and B were significant but C was not. Effect size: Panel A & B had large effect sizes whereas C did not. Variance: A had constant variance, B and C had smaller variance in CEZ population.
Support: Radiation affecting mitochondria of CEZ frogs. Reject: Radiation does not affect CEZ frogs.

Dantas-Queiroz et al (2021) measured genetic diversity of a bromeliad species native to a mountain range in Brazil. They wanted to know how the bromeliad (a type of plant) was able to spread through the region. The colors represent different genetic populations in the figure below.
What is on the x-axis? What is on the y-axis? Are there any other variables represented? If so, how?
What is the independent variable? What is the dependent variable?
In one sentence, describe the pattern or trend created by the data.
Summarize the statistics descriptively (significance, effect size, variance).
What hypothesis does this data support? What hypothesis(es) does this data reject?
X- and Y- axes: Neither panel has typical x/y axes; Panel A represents latitude and longitude and Panel B represents genetic distance/similarity. Other: Colors represent haplotypes.
IV: geography (specifically the geographic range of the bromeliad). DV: genetic diversity.
The bromeliad likely originated in the southern portion of the range and expanded north in response to environmental conditions. The genetic populations are, overall, relatively similar.
Significance: None reported. Effect size: Moderate to low for the geographic range. Variance: Somewhat high across the range.
Support: The bromeliad spread from South to North. Reject: The bromeliad spread from North to South. Also reject: The bromeliad spread from the center both North and South.

Errbii et al (2024) studied populations of the California harvester ant that either were led by a single queen (haplometrotic) or by multiple queens (pleometrotic). The researchers were trying to understand the genetic basis of the colony social structure, with inbreeding tending to be inversely correlated with heterozygosity. *** indicates statistical significance between groups.
What is on the x-axis? What is on the y-axis? Are there any other variables represented? If so, how?
What is the independent variable? What is the dependent variable?
In one sentence, describe the pattern or trend created by the data.
Summarize the statistics descriptively (significance, effect size, variance).
What hypothesis does this data support? What hypothesis(es) does this data reject?
X-axis: colony type. Y-axis: genetic diversity. Other: none.
IV: colony type (haplo or pleo). DV: genetic diversity.
Pleometrotic colonies are generally less diverse than haplometrotic colonies.
Significance: All panels significant. Effect size: Panel A has small effect size but B and C have moderate to large effect size. Variance: Variance in Pleo data is much higher than variance in Haplo data.
Support: Haplometrotic queen colonies are more genetically diverse than pleometrotic queen colonies. Reject: Haplometrotic and pleometrotic queen colonies have equal genetic diversity.
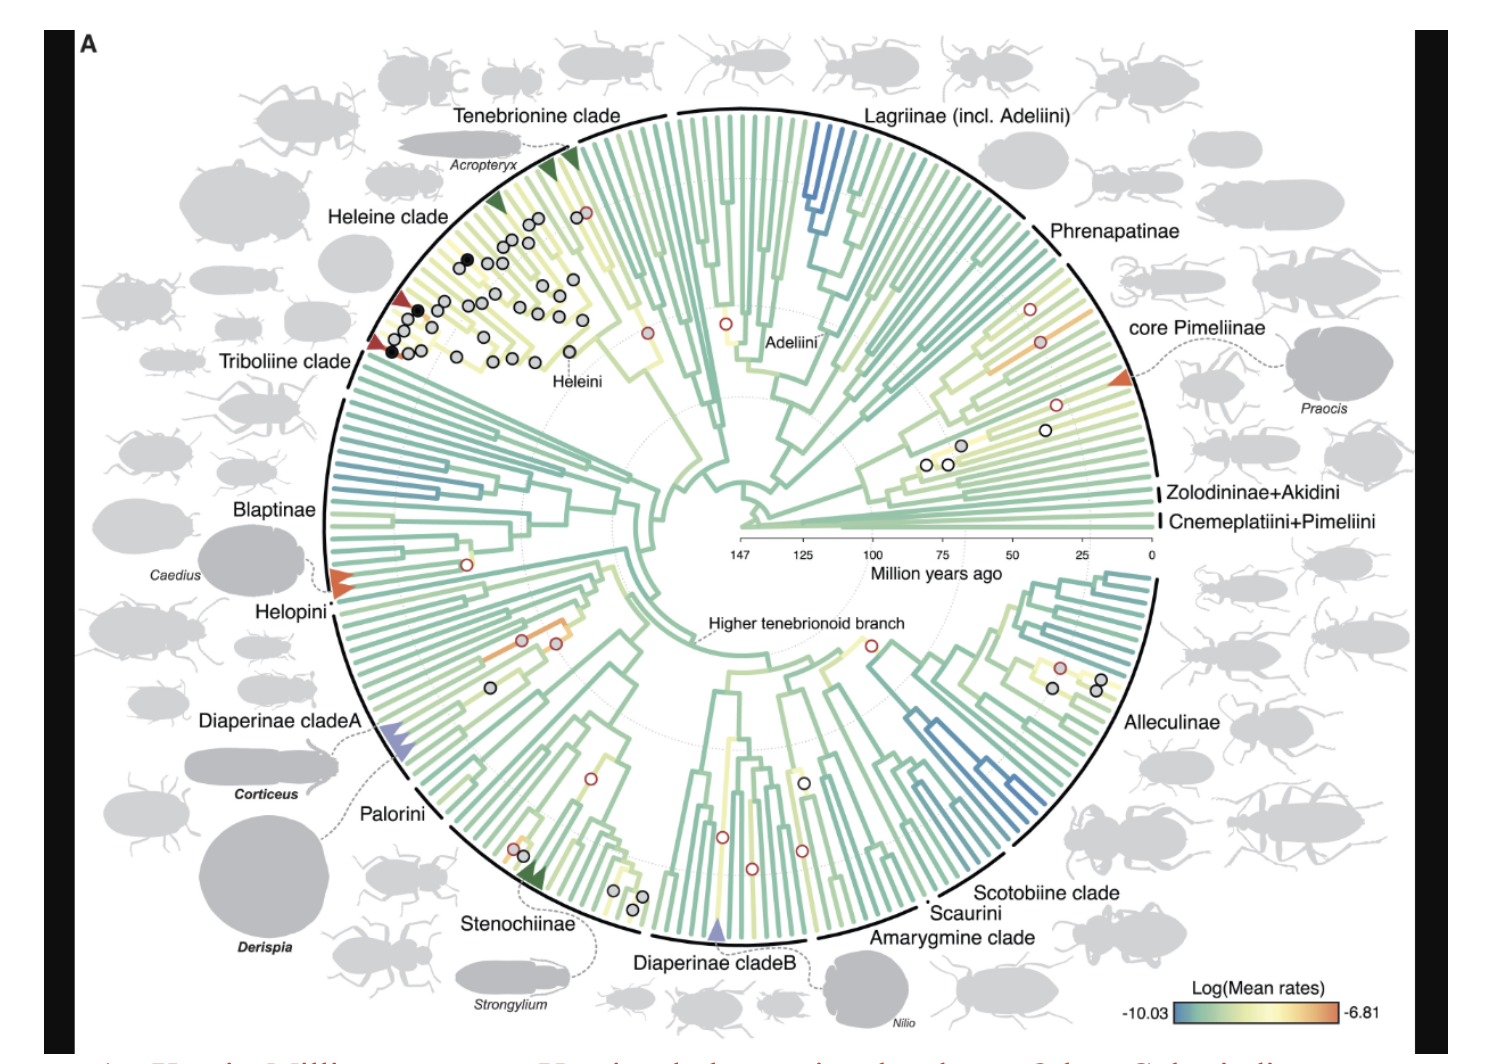
Li et al (2024) used morphological and genomic data to measure the diversification rates of darkling beetles. Circles indicate especially high levels of diversification, and circles in red indicate that these shifts in rate coincided with ecological diversification. In particular, the researchers explored when diversifications occurred the most.
What is on the x-axis? What is on the y-axis? Are there any other variables represented? If so, how?
What is the independent variable? What is the dependent variable?
In one sentence, describe the pattern or trend created by the data.
Summarize the statistics descriptively (significance, effect size, variance).
What hypothesis does this data support? What hypothesis(es) does this data reject?
X-axis: Million years ago. Y-axis: phylogenetic relatedness. Other: Color indicates diversification rate and circles indicate especially high rates.
IV: Diversification rate. DV: species richness.
Several lineages diversified in darkling beetles, but the Heleini diversified the most. Most of the diversification occurred 75-25 mya.
Significance: none reported. Effect size: Very large diversification in darkling beetles, especially in the 75-25 mya range. Variance: Most groups showed similar rates, but Heleini was an outlier for its extraordinary rate.
Support: Diversification was neither uniform nor consistent across groups or time with the most occurring 75-25 mya. Reject: Diversification was constant across groups and time.
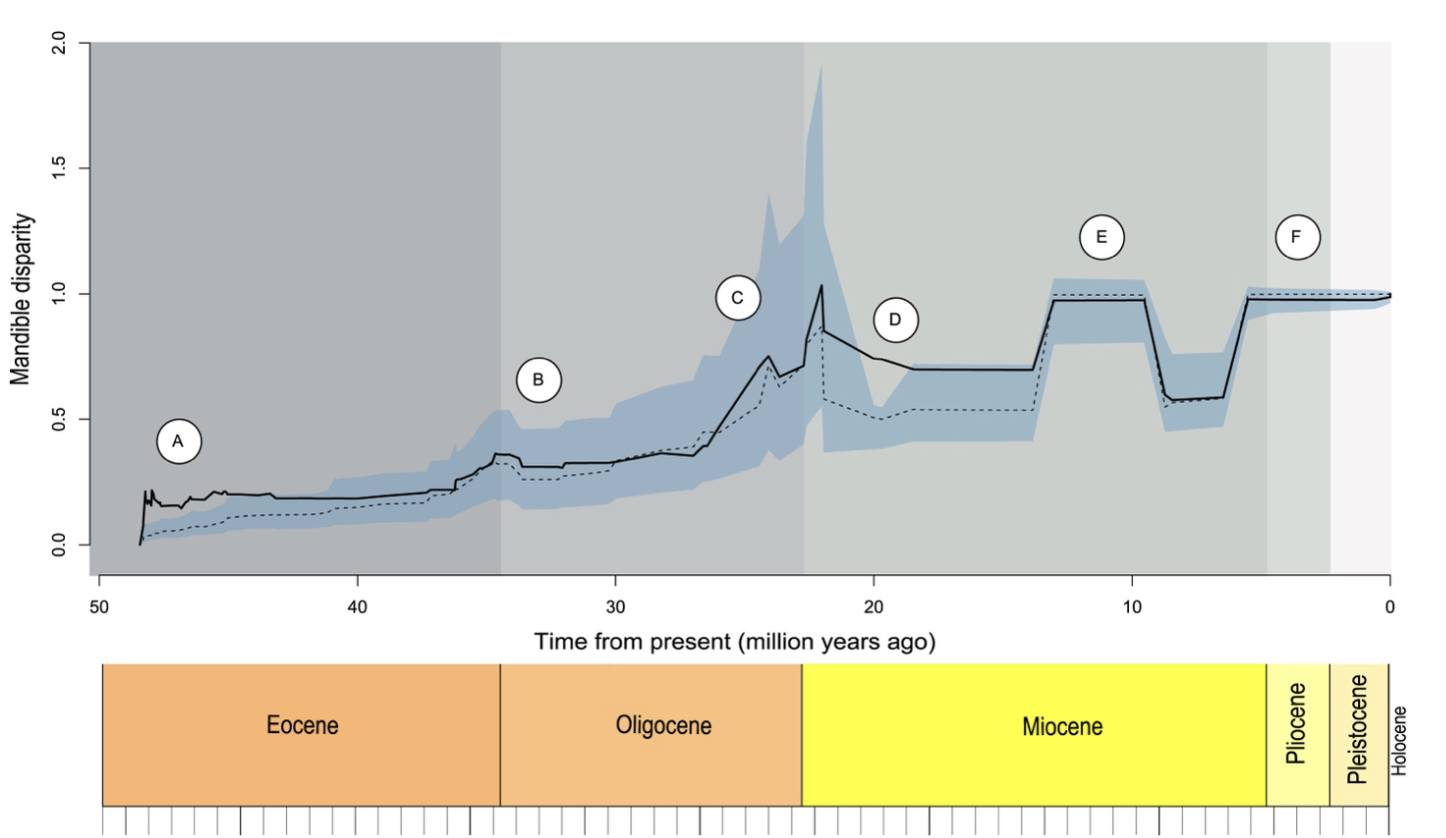
Coombs et al (2024) used fossil and extant toothed whale mandibles (lower jaw) to predict when echolocation may have originated and been refined. The solid line represents disparity based on observed data whereas the dashed line represents disparity from a model prediction. The blue band is the uncertainty for the modeled data.
What is on the x-axis? What is on the y-axis? Are there any other variables represented? If so, how?
What is the independent variable? What is the dependent variable?
In one sentence, describe the pattern or trend created by the data.
Summarize the statistics descriptively (significance, effect size, variance).
What hypothesis does this data support? What hypothesis(es) does this data reject?
X-axis: time. Y-axis: mandible disparity. Other: line type to indicate observed or modeled data.
IV: origin and improvement of echolocation. DV: mandible variation.
Echolocation originated from a single event in the early Eocene, and had periods of rapid improvement in the late Eocene, late Oligocene, and middle Miocene.
Significance: The greatest uncertainty is also where there tends to be the greatest disparity growth. Effect size: The greatest change in disparity occurred in the late Oligocene through the beginning of the Miocene. Variance: Although the amount of variation in mandible shape is greater now than at almost any other point in toothed whale history, the rate of change has been zero for ~5 my.
Support: Echolocation originated in the early Eocene and diversified the most during the late Oligocene to beginning Miocene. Reject: Echolocation diversified at a constant rate through time.
The first forms of life on Earth were ________
Microorganisms
A suggested and testable explanation for an event is called a ________
Hypothesis
Which of the following sciences is not considered a natural science:
A. Biology
B. Astronomy
C. Physics
D. Computer science
D. Computer science
The type of logical thinking that uses related observations to arrive at a general conclusion is called ________
Inductive Reasoning
The process of ________ helps to ensure that a scientist's research is original, significant, logical, and thorough.
Peer Review
A person notices that her houseplants that are regularly exposed to music seem to grow more quickly than those in rooms with no music. As a result, she determines that plants grow better when exposed to music. This example most closely resembles which type of reasoning?
Inductive Reasoning
Which of the following statements about good experiments is TRUE:
A. A good experiment must include all possible causal factors in one experimental group.
B. A good experiment must have an experimental group. A control group may be useful but is not critical.
C. A good experiment should include a potentially confounding factor in at least one group.
D. A good experiment includes replication by applying treatments to multiple experimental units.
D. A good experiment includes replication by applying treatments to multiple experimental units.
Why is replication important to consider when designing an experiment?
Replication reduces the chances that a rare result leads you to an erroneous conclusion.