ST 311 Chapter 2 Notes
1/52
There's no tags or description
Looks like no tags are added yet.
Name | Mastery | Learn | Test | Matching | Spaced | Call with Kai |
|---|
No analytics yet
Send a link to your students to track their progress
53 Terms
expirement
The process of applying some treatment then observing its effects
almost always compares 2 or more groups
treatment group
control group
can also compare 2 treatments without a control group
units- the individuals in an experiment
units or subjects
the individuals in an experiment
observational study
process of observing and measuring specific characteristics without attempting to modify the group
tells whats happening, cannot describe a cause/effect relationship
response variable
measures outcome of study
explanatory variable
explains/influences response variable
variability
treatment effects
experimental error
variability among those with the same treatment
lurking variables
variables not in the explanatory and may influence the interpretation of the relationship among response and explanatory
cofounding variables
2 variables cofounded when the effect on the response variable cannot be distinguished
experimental error
type of variability
variability amongst those with the same treatment
cofounding variables
type of variability
variable not in the explanatory and may influence the interpretation of the relationship among response and explanatory variables
cofounding variables
type of variability
the effect of different variables on the response variable cant be distinguished
principles of experimental design
control
receives no treatment
randomization
reduces or eliminates bias
replication
as much repetition or subjects to reduce variability
control group
a principle of experimental design
receives no treatment
randomization
a principle of experimental design
reduces or eliminates bias
different methods such as srs, stratification
replication
a principle of experimental design
as much repetition or units possible
reduces variability
Randomization Methods
Completely Randomized Designs
Randomized Block Design
Matched Pairs Design
completely randomized designs
randomization methods
participants randomly assigned treatments
lurking variables applied evenly
any significant differences can be attributed to the explanatory variable
randomized block design
randomization method
units subdivided into blocks
variability within blocks less than variability between blocks
participants within blocks are randomly assigned different treatments
matched pairs design
randomization method
special case of randomized block design
only has 2 groups
participants can be grouped to pairs
within each pair participants randomly assigned different treatments
also can be done as before/after with the same participant
placebo effect
the tendency to react to a drug/treatment that has no real function.
subject bias
subject may want to please the researcher or hope for a specific outcome
hawthorne effect
people behave different because they know theyre being watched
bias of the researcher
subconciously behave in ways that favor their beliefs
reporter biases
assigning subjects with biases
may skew results in direction that they want
blinding
individuals associated with an experiment or the researcher doesn’t know the treatment that the subjects are receiving
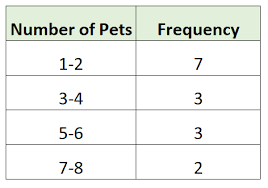
frequency distributions
shows how many of each occurrance happens
often separated by intervals/ranges
can be categorical or quantitative
measure of center
a value at or near the center or middle of a data set
often interpreted as “typical” values for a set
common measures of center include
mean
median
mode
iqr
uppercase sigma
Σ
denotes a sum
x
individual data value
lowercase n
# of values in a sample
uppercase N
#of values in a population
x bar
x̄ sample mean
mu
μ
population mean
unimodal
data set with 1 mode
bimodal
data set with 2 modes
multimodal
data set with more than 2 modes
mode
when data is categorical what measure of center is the best?
median
when the data is quantitative but contains outliers what is the best measure of center?
mean
when data is quantitative and contains no outliers what is the best measure of center?
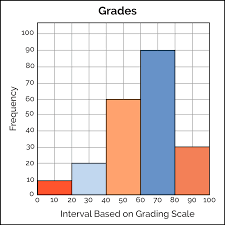
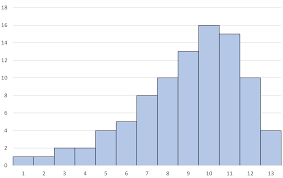
histogram
graph of frequency distribution
makes it easier to interpret pattern
Contains
bars of equal width drawn adjacent to each other (unless there are gaps in the data)
horizontal scale - represents classes of quantitative data or categories
vertical scale that represents frequencies
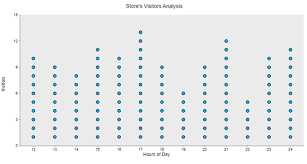
dotplot
shows each value in a data set as a do above a number line
there is no y axis
categorical data displays
pie chars, column charts, stacked charts etc. choose based on data type
misleading graphs
vertical axis can exaggerate differences
y axis doesnt start at 0
skewed stretched y axis
3D can make categories seem bigger or smaller
misrepresenting areas
using wrong type of graph to represent data
inproper scaling
misleading or missing labels
not displaying full data
skewness
measure of symmetry of a distribution
values far from the peak skew a distribution in their direction
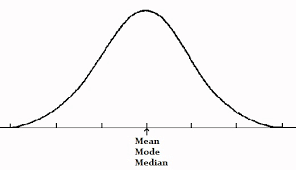
symmetric distribution
unimodal
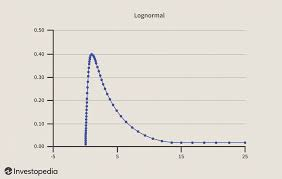
normal distribution
bell curve
right skew
positive skew
left skew
negative skew
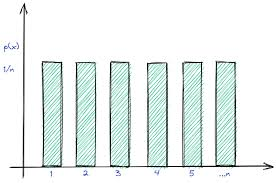
uniform
equal spread
no peaks
no skew
normal/symmetric/uniform distribution
mean=median=mode
right skew
mode<median<mean
left skew
mean<median<mode
range
max value - min value
highly affected by outlier
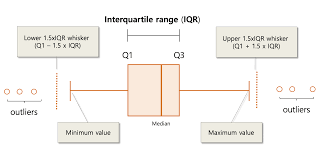
interquartile range (IQR)
not as affected by potential outliers like range. uses q3 and q1 difference to calculate.
five number summary
min q1 median q3 max
boxplot
visual of 5 number summary
standard deviation
measure of how much the data values deviate from the mean
never negative
same units as the data
only 0 when all values are the exact same
larger #s have greater variation
increases dramatically with outliers
sqrt(varience)