IPS2: Pharmacology - Part 1.2 - General Principles of Pharmacology
 Call Kai
 Learn
Learn Practice Test
 Spaced Repetition
 Match
Match Flashcards
 Knowt Play
1/35

There's no tags or description
Looks like no tags are added yet.
Name | Mastery | Learn | Test | Matching | Spaced | Call with Kai | Chat |
|---|
No analytics yet
Send a link to your students to track their progress
36 Terms
Expresses an individual's response to increasing doses of a drug.
a. Graded-dose response
b. Quantal-dose response
a. Graded-dose response
Relates the dosage of a drug to the frequency with which a designated response will occur within a population.
a. Graded-dose response
b. Quantal-dose response
b. Quantal-dose response
Parameters of Graded-Dose Response except:
a. Magnitude of response
b. Efficacy
c. Potency
d. Ceiling dose
e. Slope
f. None
f. None
1) Depicted as a function of the logarithm of the dose administered
2) Proportional to the number of receptors with which a drug effectively interacts
a. Magnitude of response
b. Efficacy
c. Potency
d. Ceiling dose
e. Slope
a. Magnitude of response
Magnitude of response is on the
a. X-axis
b. Y-axis
b. Y-axis
Measure of the ability of a drug to elicit the maximum pharmacologic response.
a. Magnitude of response
b. Efficacy
c. Potency
d. Ceiling dose
e. Slope
b. Efficacy
Highest level on the graph.
a. Magnitude of response
b. Efficacy
c. Potency
d. Ceiling dose
e. Slope
b. Efficacy
1) Relative measure of the ability of a drug to produce half of the maximum response.
2) Defined as the dose needed to achieve 50% of maximum response.
a. Magnitude of response
b. Efficacy
c. Potency
d. Ceiling dose
e. Slope
c. Potency
1) The smallest dose which produces the maximum response or efficacy.
2) No matter how much you increase the dose beyond this, same effect is produced.
a. Magnitude of response
b. Efficacy
c. Potency
d. Ceiling dose
e. Slope
d. Ceiling dose
Indicated changes in response.
a. Magnitude of response
b. Efficacy
c. Potency
d. Ceiling dose
e. Slope
e. Slope
Steep curve implies a small change in dose produces a large change in response.
a. True
b. False
a. True
Graded-Dose Response:
a. Y-axis: response; X-axis: dose
b. X-axis: response; Y-axis: dose
c. Y-axis: efficacy; X-axis: potency
d. X-axis: efficacy; Y-axis: potency
e. a and c
f. b and d
e. a and c
Y axis except:
a. Anti inflammatory effect
b. Efficacy
c. Response
d. Potency
e. None
d. Potency
Grade dose response graph.
a. Hyberbolic
b. Sigmoidal
c. Both
d. None
c. Both
More common grade-dose response graph.
a. Hyberbolic
b. Sigmoidal
c. Both are equally used
b. Sigmoidal
X axis is dose
a. Hyberbolic
b. Sigmoidal
c. Both
d. None
a. Hyberbolic
X axis is log dose.
a. Hyberbolic
b. Sigmoidal
c. Both
d. None
b. Sigmoidal
Maximum response.
a. Magnitude of response
b. Efficacy
c. Potency
d. Ceiling dose
e. Slope
b. Efficacy
The the more potent, the lesser the amount needed for effect.
a. True
b. False
a. True
1) For efficacy, the farther from 0, the higher the efficacy, the more effective.
2) For potency, the nearer to 0, the lower the value, the more potent.
a. Only 1 is true
b. Only 2 is true
c. Both true
d. Both false
c. Both true
Smallest dose that produce efficacy.
a. Magnitude of response
b. Efficacy
c. Potency
d. Ceiling dose
e. Slope
d. Ceiling dose
Degree of changes in response w/ a change in the dose.
a. Magnitude of response
b. Efficacy
c. Potency
d. Ceiling dose
e. Slope
e. Slope
Steep slope.
a. Drastic response with small change in dose
b. Dose can be easily adjusted
c. Dangerous
d. a and b
e. a and c
f. All
e. a and c
Not steep slope.
a. Drastic response with small change in dose
b. Dose can be easily adjusted
c. Safer
d. a and b
e. b and c
f. All
e. b and c
Left or right plotted value
a. Potency
b. Efficacy
a. Potency
High or low plotted value
a. Potency
b. Efficacy
b. Efficacy
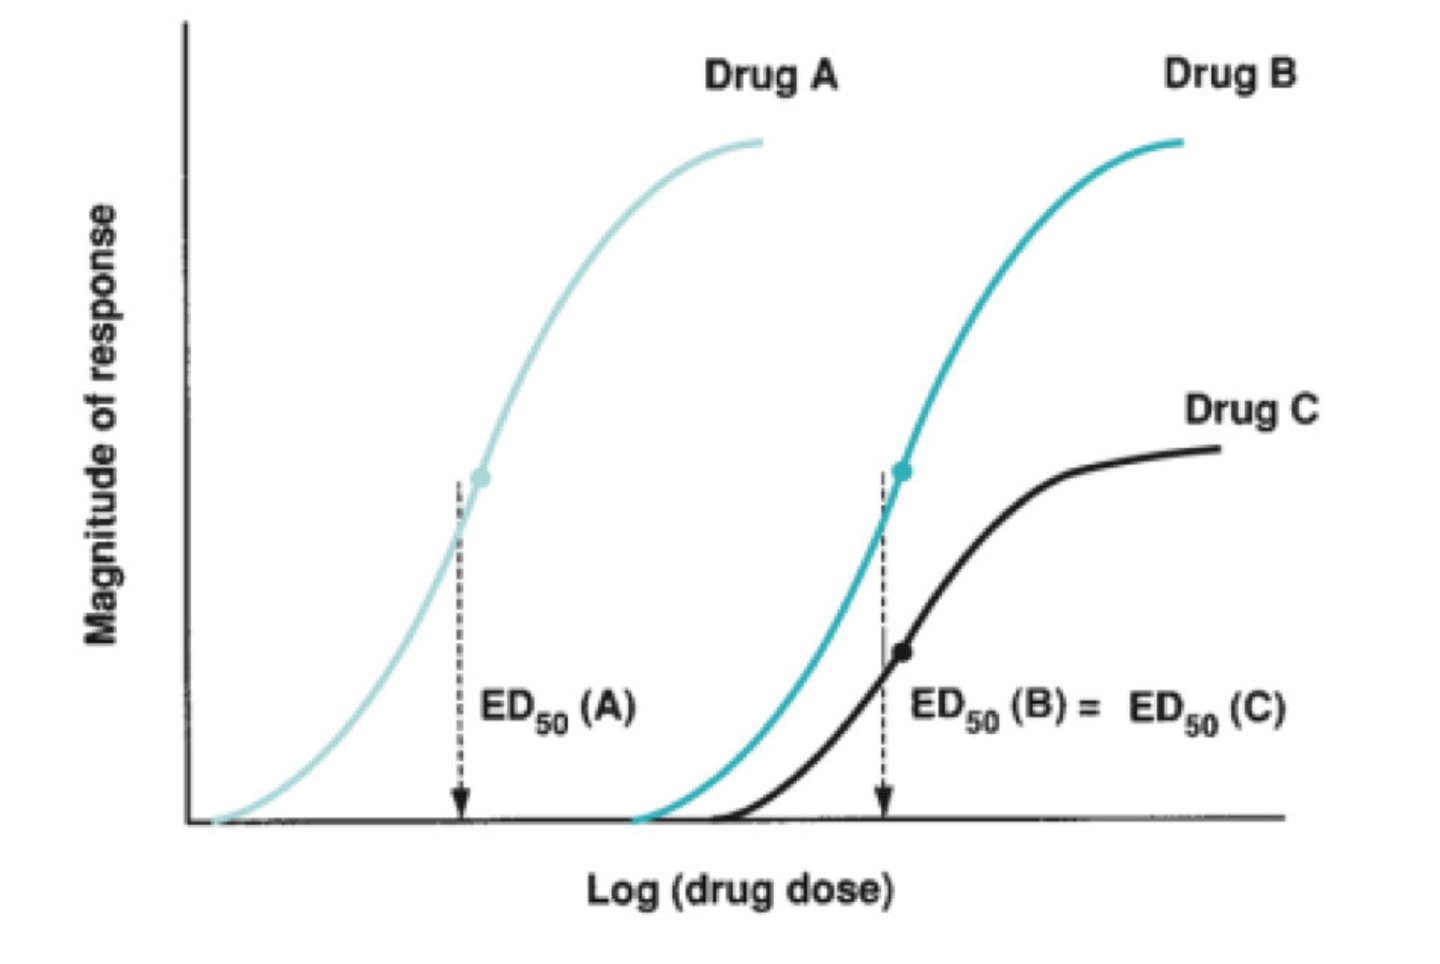
True statements about the graph:
Page 3 notes
a. Drug A is the most effective and potent
b. Drug C is the least effective but more potent than Drug A
c. Drugs A and B are equally effective but the latter is less potent
d. a and b
e. a and c
f. All
e. a and c
In these type of antagonism to drug, the maximum response is unchanged but the ED50 is shifted to right.
a. Competitive antagonism
b. Non-competitive antagonism
a. Competitive antagonism
In these type of antagonism to drug, the maximum response become lower but the ED50 is unchanged.
a. Competitive antagonism
b. Non-competitive antagonism
b. Non-competitive antagonism
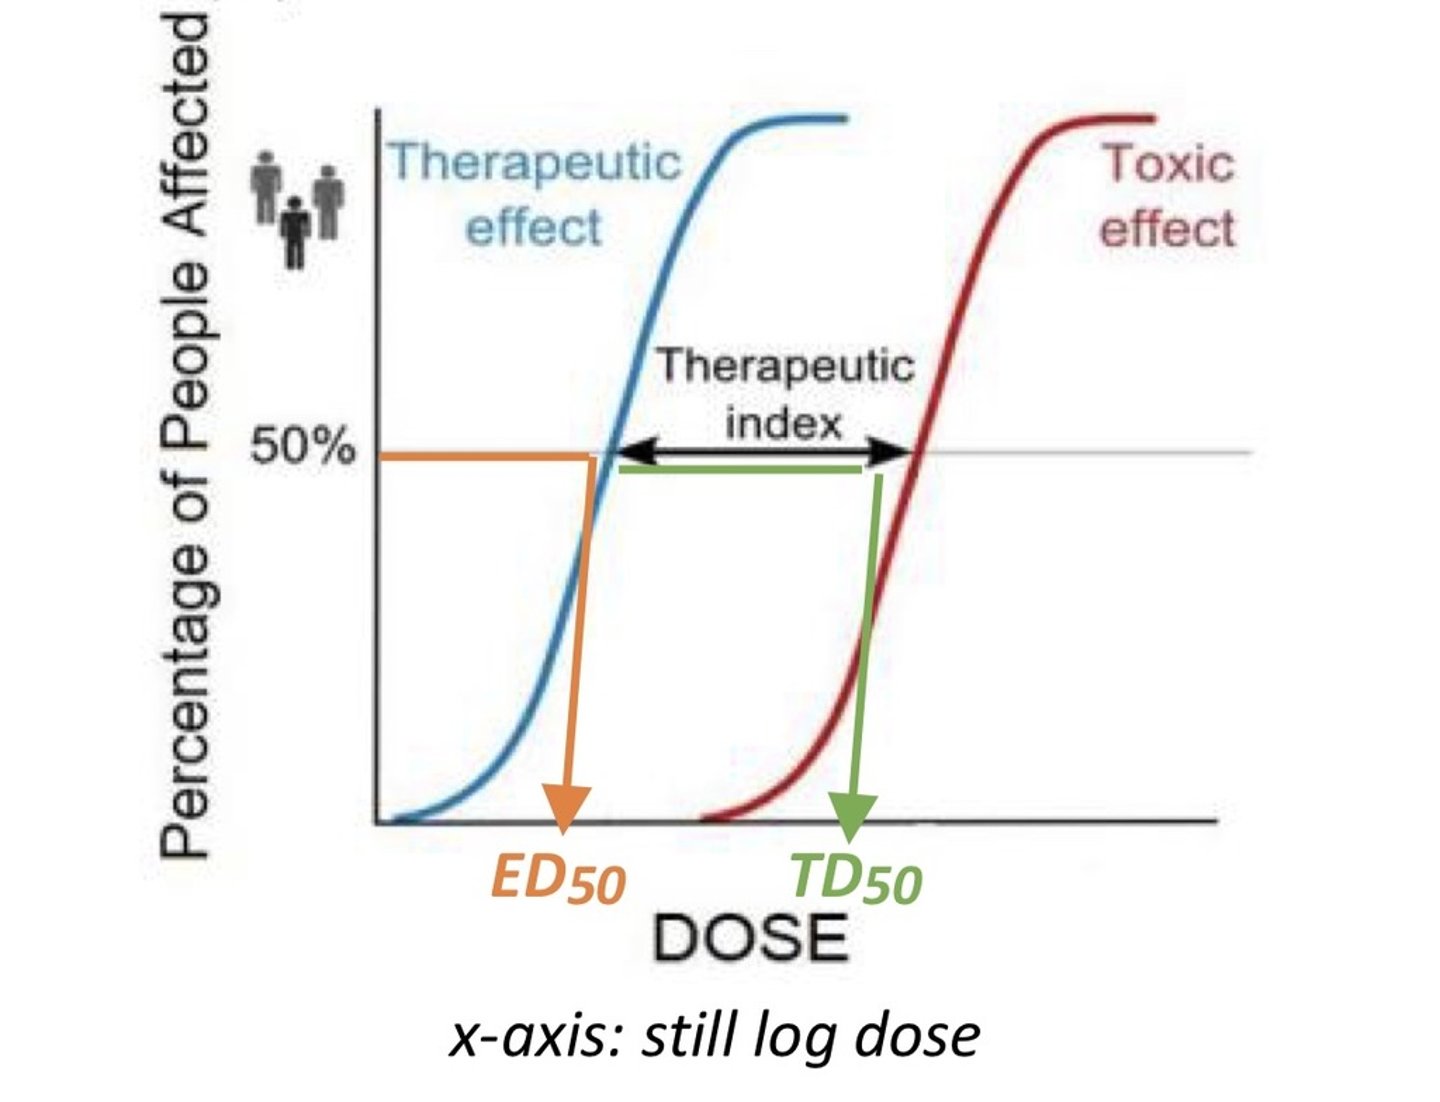
Quantal-Dose Response parameters except:
a. Median Effective Dose (ED50)
b. Median Toxic Dose (TD50)
c. Therapeutic Index
d. Margin of safety
e. Efficacy
f. None
e. Efficacy
Defines as the effective dose in 50% of the given population.
a. Median Effective Dose (ED50)
b. Median Toxic Dose (TD50)
c. Therapeutic Index
d. Margin of safety
a. Median Effective Dose (ED50)
Defines as the toxic dose in 50% of the given population.
a. Median Effective Dose (ED50)
b. Median Toxic Dose (TD50)
c. Therapeutic Index
d. Margin of safety
b. Median Toxic Dose (TD50)
Defined as the measurement of the relative safety of drug which is determined by dividing TD50 over ED50.
a. Median Effective Dose (ED50)
b. Median Toxic Dose (TD50)
c. Therapeutic Index
d. Margin of safety
c. Therapeutic Index
Quantal-Dose Response except:
a. X-axis is log dose
b. Y-axis is cumulative number of patient
c. Beneficial dose is observed at lower doses
d. Toxic dose is observed at higher doses
e. None
e. None
The higher the therapeutic index, the safer the drug.
a. True
b. False
a. True
Quantal-Dose Response Curve