P2 - REVIEWER - MANAGERIAL ECONOMICS
1/44
Earn XP
Description and Tags
P2 - MODULE 1: Lesson 1
Name | Mastery | Learn | Test | Matching | Spaced |
|---|
No study sessions yet.
45 Terms
Managerial Economics
▪ a field of study that integrates economic principles with managerial decision-making processes.
▪ it serves as a bridge between economics and business management, offering insights and tools to help managers make informed choices in the face of scarce resources and dynamic market conditions.
▪ it applies economic theories and methodologies to analyze and solve real-world business problems.
▪ in the realm of managerial economics, decision makers assess the costs and benefits of alternative strategies, examine market trends, and consider the impact of various factors on business outcomes.
▪ by blending economic theories with practical business scenarios, managerial economics equips managers with the ability to optimize decision-making, maximize efficiency, and achieve organizational goals in a constantly evolving business environment.
Economic Activity and The Circular Flow Model
Economic Activity
▪ defined as the production, distribution, and consumption of goods and services in an economy.
That means it includes all the activities that are related to the production, distribution, and consumption of goods and services
▪ is an important concept for understanding the health of an economy.
For example, if the level of economic activity increases, the economy is growing. On the other hand, if the level of economic activity decreases, the economy is in a recession.
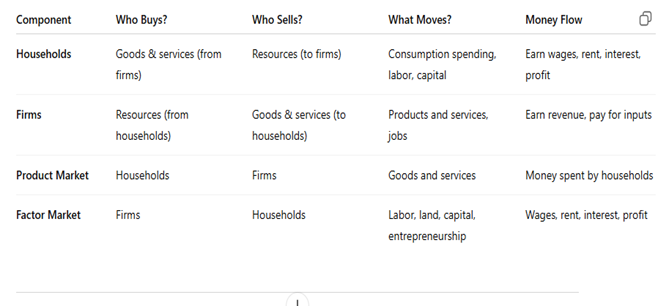
The Circular Flow Model
▪ a fundamental concept in economics that illustrates how money moves through an economy.
▪ it shows the interconnected relationships between two primary groups: households and firms (businesses).
✓ A continuous flow of goods and services is bought and sold between the producers of goods and services (which we call firms) and the buyers of goods and services (which we call households).
✓ A continuous flow of income also moves from firms to households as firms buy inputs to produce the goods and services they sell. And these exchanges take place in product markets and factor markets.
Product Market // Firms // Factor Market // Households
The Circular Flow Model
Product Markets
▪ are the markets for consumer goods and services.
▪ households are buyers and firms are sellers.
Households buy the goods and services that firms produce and sell. The payments from the households to the firms, for the purchases of goods and services, flow to the firms at the same time as goods and services flow to the households.
Factor or Input Markets
▪ are where households sell the use of their inputs (capital, land, labor, and entrepreneurship) to firms.
▪ households are the sellers and firms are the buyers.
Households receive money payments from firms as compensation for the labor, land, capital, and entrepreneurship needed to produce goods and services. These payments take the form of wages (salaries), rent, interest payments, and profit.
Demand and Supply
Supply and demand have been called the “bread and butter” of economics.
a buying side and a selling side.
Economists often say that every market has two sides:
The buying side
of the market is usually referred to as the demand side;
the selling side
is usually referred to as the supply side.
Demand
- refers to the willingness and ability of buyers to purchase different quantities of a good, at different prices during a specific period.
For example, we can express part of a customer’s demand for magazines by saying that he/she is willing and able to buy 10 magazines a month at P200 per magazine and that he/she is willing and able to buy 15 magazines a month at P150 per magazine.
Remember this important point about demand: Unless both willingness and ability to buy are present, there is neither demand nor a buyer.
The Law of Demand
Will people buy more units of a good at lower prices than at higher prices? For example, will people buy more shirts at P500 per piece than at P3,500 per piece?
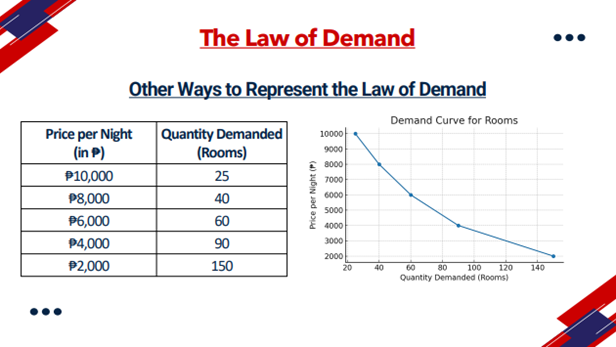
The Law of Demand
- states that as the price of a good rises, the quantity demanded of the good falls, and as the price of a good falls, the quantity demanded of the good rises, ceteris paribus.
- to simply put, the price of a good and the quantity demanded of it are inversely related, ceteris paribus.
The Law of Demand: formula
𝑃↑ 𝑄𝑑↓
𝑃↓ 𝑄𝑑↑, ceteris paribus
where 𝑃 = price and 𝑄𝑑 = quantity demanded.
The Law of Demand
Demand is different from quantity demanded.
Demand
speaks to the willingness and ability of buyers to buy different quantities of a good at different prices.
Quantity demanded
speaks to the willingness and ability of buyers to buy a specific quantity at a specific price.
The Law of Demand
Other Ways to Represent the Law of Demand
Demand Schedule - the numerical representation of the law of demand.
Demand Curve - a (downward-sloping) demand curve is the graphical representation of the inverse relationship between price and quantity demanded specified by the law of demand.
Demand Schedule -
the numerical representation of the law of demand.
Demand Curve -
a (downward-sloping) demand curve is the graphical representation of the inverse relationship between price and quantity demanded specified by the law of demand.
The Law of Demand
Why Does Quantity Demanded Go Down as Price Goes Up?
1. People substitute lower priced goods for higher priced goods.
2. Law of diminishing marginal utility, which states that, over a given period, the marginal (or additional) utility or satisfaction gained by consuming equal successive units of a good will decline as the amount of the good consumed increases.
The Law of Demand
What Factors Cause the Demand Curve to Shift?
✓ income,
✓ preferences,
✓ prices of related goods (substitutes and complements),
✓ the number of buyers, and
✓ expectations of future prices.
✓ Income
As a person’s income changes (increases or decreases), that individual’s demand for a particular good may rise, fall, or remain constant.
▪ Normal goods – If income goes up, demand goes up. If income goes down, demand goes down.
▪ Inferior goods – If income goes up, demand goes down. If income goes down, demand goes up.
▪ Neutral goods – Demand stays the same, no matter if income goes up or down.
✓ Income
As a person’s income changes (increases or decreases), that individual’s demand for a particular good may rise, fall, or remain constant.
▪ Normal goods –
If income goes up, demand goes up. If income goes down, demand goes down.
▪ Inferior goods –
If income goes up, demand goes down. If income goes down, demand goes up.
▪ Neutral goods –
Demand stays the same, no matter if income goes up or down.
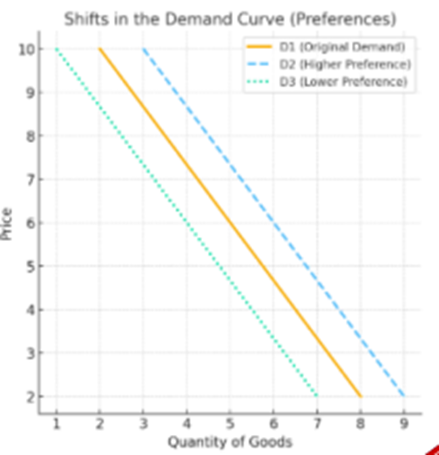
✓ Preferences
It affects the amount of a good a person is willing to buy at a particular price.
▪ If preferences increase -
the demand curve shifts right (more demand).
▪ If preferences decrease -
the demand curve shifts left (less demand).
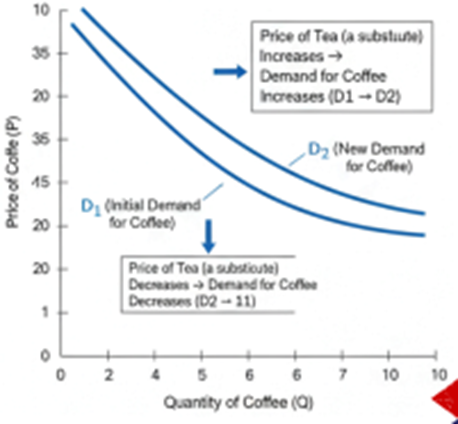
✓ Prices of related goods (substitutes and complements)
Substitutes - Goods that can replace each other.
▪ Rule: If the price of X goes up, the demand for Y goes up (people switch).
If the price of X goes down, the demand for Y goes down.
▪ Price and demand move in the same direction
Substitutes -
Goods that can replace each other.
Y goes up (people switch).
▪ Rule: If the price of X goes up, the demand for
Y goes down.
If the price of X goes down, the demand for
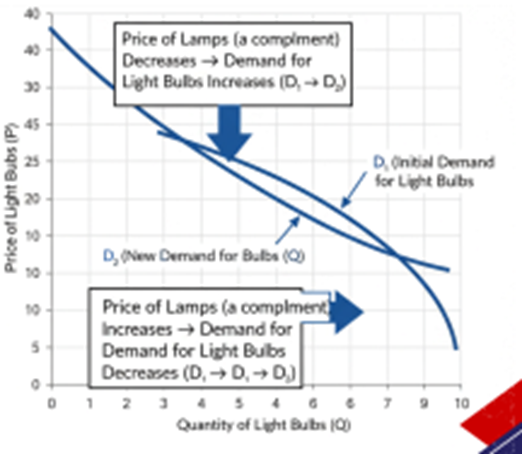
✓ Prices of related goods (substitutes and complements)
Complements - Goods that are used together.
▪ Rule: If the price of X goes up, the demand for Y goes down (people buy less of both).
If the price of X goes down, the demand for Y goes up.
▪ Price and demand move in opposite directions.
Complements -
Goods that are used together.
Y goes down (people buy less of both).
▪ Rule: If the price of X goes up, the demand for
Y goes up.
If the price of X goes down, the demand for
✓ Number of Buyers
The more buyers there are, the higher the demand. The fewer buyers there are, the lower the demand.
✓ Expectations of Future Price
▪ If people expect prices to go up in the future, they buy more now (demand increases).
▪ If people expect prices to go down in the future, they wait to buy later (demand decreases now).
(demand increases).
If people expect prices to go up in the future, they buy more now
(demand decreases now).
▪ If people expect prices to go down in the future, they wait to buy later