Analytical Chemistry module 2
 Call Kai
 Learn
Learn Practice Test
 Spaced Repetition
 Match
Match Flashcards
 Knowt Play
1/64

There's no tags or description
Looks like no tags are added yet.
Name | Mastery | Learn | Test | Matching | Spaced | Call with Kai | Chat |
|---|
No analytics yet
Send a link to your students to track their progress
65 Terms
For purely random errors, what do the results of many measurements of an experimental quantity follow?
a Gaussian distribution, a bell shaped curve
for infinite measurements, what do we define?
true population mean as μ (mu) with a spread of standard deviation σ (sigma)
for finite number of measurements, what do we define?
mathematical mean x̄, with a spread of standard deviation s
for a large number of replicate measurements,
calculated mean x̄ approaches true mean μ
calculated spread s approaches true spread σ
what is the formula for mean/average?
x̄ = (Σxi) / n
what do different symbols mean in the mean/average formula?
x̄ is the sample mean/average
Σ is the addition of things ( of all measured values xi)
xi or x are the individual values in the data set
n is the total count of values in the sample
what is the standard deviation formula?
s = √ [ Σ(xi - x̄)² / (n - 1) ]
what do different symbols mean in the standard deviation formula?
s is the standard deviation
Σ is the sum of ( addition of everything together)
xi is the individual value in the data set
x̄ is the sample mean/average
n is the number of values in the sample
the smaller s ( standard deviation)
equals to a more precise measurement
this doesnt relate to accuracy
what is variance?
its the square of standard deviation
s2
what is another name for percent relative standard deviation ( %RSD)?
coefficient of variation
what is the percent relative standard deviation formula?
(s / x̄) * 100
how do you calculate the range of data set?
highest value minus lowest value
what can you use %RSD for?
when you need to compare relative spread of two very different means
both means can have different s, but the same %RSD
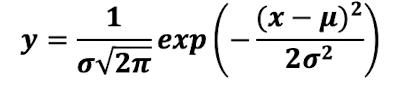
what is the formula for Gaussian distribution?
σ is the standard deviation
μ is the mean
x is the input value
what is z = +2 ?
it is a measure value at x̄ + 2s
what is z = -2?
is a measured value at x̄ - 2s
what is the probability of measuring a value in a certain range equal to?
to area under normal error curve in that range
what does 𝝁±𝟏𝝈 cover in standard deviation and probability?
it covers 68.3% of expected values
what does 𝝁±2𝝈 cover in standard deviation and probability?
it covers 94.5% of expected values
what does 𝝁±3𝝈 cover in standard deviation and probability?
covers 99.7% of expected values
what does standard deviation measure?
measures amount of dispersion for a subject set of data from the mean
what does standard uncertainty measure?
measures how far the sample mean of the data is likely to be from the true population mean
what is the formula for standard uncertainty?

ux becomes smaller with what?
with increased number of replicate measurements (n)
what is more replicate measurements equal to?
to a higher certainty ( smaller ux )
what does confidence interval represent?
a spread around the sample mean
what can you say with a certain confidence? ( like 90%, 95%, or 99% confidence)
that true population mean is found within the confidence interval
what is the confidence interval formula?
value “t” is called student’s t

where can student’s t be found?
can be found as a tabled value for certain degrees of freedom and the desired confidence level
student’s t values get lower with what?
with more replicate measurements
student’s t values get higher with what?
with increasing confidence level
degrees of freedom
related to number of replicate measurements (n) used to calculate mean
what is the formula for degrees of freedom?
deg. of freedom = n - 1
when will ux and tux decrease?
with more replicates
s approaches true standard deviation when?
when there are more replicates
x̄ changes and approaches true mean when?
when there are more replicates
standard uncertainty (ux ) or confidence intervals often used to quantify what?
random error associated to a measured sample mean
how do you state sample mean and its error ( uncertainty) ?
x̄ +- ux ( n = ……)
or x̄ +- tux (n =……)
also state the type of error used and number of replicate measurements used
both ux and tux are both what?
they are both absolute errors (e)
what is the formula for % relative error? ( %e)
%e = ( e / x̄ ) x 100
how does the absolute error of a mean determines number f sig figs?
error is rounded to 1 sig fig
if tux is rounded to two sig figs, then x̄ is rounded to two sig figs as well
what is the rounding exception?
error with first digit of “1” can round to two sig figs
if tux is rounded to two sig figs, then x̄ is rounded to two sig figs as well
what is the Null Hypothesis? H0
is a statement that two data sets are drawn from populations with properties such as standard deviation and mean
if H0 is true …
variations between different data sets arise from random variations in measurements
what is alternative hypothesis? HA
where data sets are different
different mean and standard deviation
when do we reject Ho
reject for less than 5% probability that two data sets are drawn from same population
same mean and standard deviation
if Ho is rejected, then …
we accept HA
what is an outliner?
a point that is far from other points of the same measured quantity
what is Grubbs test used for?
is a statistical test used to decide if an outliner should be rejected from data set
what is the formula for Grubbs test?
standard deviation and mean are calculated including xout

when do you keep xout?
if Gcalc < Gcrit
when do you reject xout ?
if Gcalc > Gcrit
what do we do if xout is rejected?
then mean and standard deviation need to be recalculated without xout
what is the F-test used for?
its used to decide if standard deviation of two data sets is significantly different from each other
how do you calculate critical F-value?
larger standard deviation should be divided by smaller one
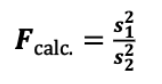
if Fcalc > Ftable then what happens next?
we reject Ho
this means that both sets have different standard deviation
what is the student’s t-test?
it is used to decide if the means of two or more data sets are significantly different from each other
compare a measured result with a known value
compare replicate measures
paired t-test for comparing individual differences
what is F-test used for?
used to compare the variances of two or more populations or samples to see if they are significantly different
what is the t-value formula?

what is the formula for spooled ?
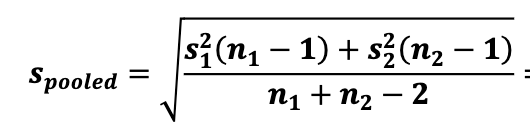
what is the formula to calculate t value with spooled ?
usually used when standard deviations are different

what are the two tailed t-test?
are unusual t-tests
HO is rejected when the result of measurement has less than 5% probability of being observed
a measured value is significantly different from known value in two tailed t test
it happens when the value is beyond the 2.5% line on either end
one tailed t-test
H0 is rejected when the result of measurement less than 5% probability of being observed on one particular end of the probability curve