CH. 2 DEFINITIONS [UNIT 1]
1/53
There's no tags or description
Looks like no tags are added yet.
Name | Mastery | Learn | Test | Matching | Spaced | Call with Kai | Chat |
|---|
No analytics yet
Send a link to your students to track their progress
54 Terms
Central tendency of a set of data
Mean, median, and mode
Mean
Average
Median
50th percentile, the middle value when the set is ordered
Mode
Most common value
Range
Max value - min value
Standard deviation
Measure of the deviation/difference of the individual data values from the mean of those values
Normal curve
Symmetric bell-shaped distribution (i.e. mean = mode = median) where about 68% of scores fall within one standard deviation of the mean
P-value
Probability of the data assuming that there are no differences between the two groups
What affects the p-value?
Effect size, variability of the data, sample size
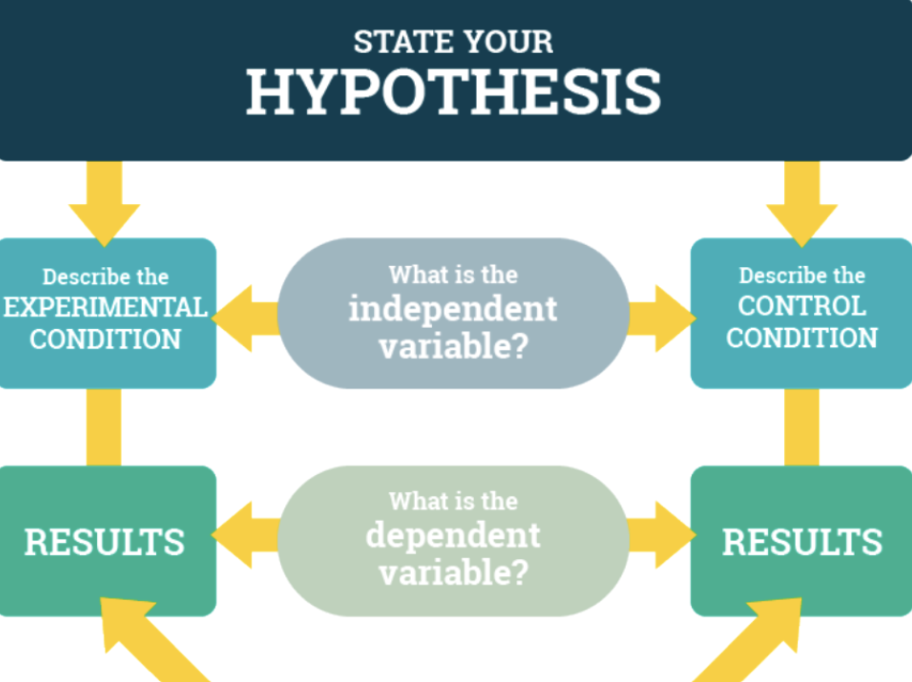
Independent variable
Causes changes in something else (dependent variable)
Difference between independent + dependent variables
What is the experimenter manipulating and measuring?
Descriptive
Allows us to summarize collected data
Inferential
Allows us to make inferences about the larger population based on the results from our smaller sample
Basic Research
Answers fundamental questions about behaviour (Ex. Biopsychologists study how nerves conduct impulses from skin receptors)
Applied Research
Investigates issues that have implications for everyday life + provides solutions to everyday problems
Empirical
Based on a systematic collection + analysis of data
Scientific method
Develop General Theories
Make Observations
Think of Interesting Questions
Formulate hypotheses
Develop Testable predictions
Gather Data to test predictions
Refine, alter, expand, or reject hypotheses
Laws
Principles that are so general + applicable to all situations in a given domain of inquiry
Stage Theory of Cognitive Development (Swiss Psychologist Jean Piaget 1952)
Children pass through a series of cognitive stages as they grow, mastering in succession before movement to the next cognitive stage can occur
Hypothesis
General statement about relationships between variables
Operational
Refers to the measurement properties of a variable, shows exactly what’s being measured
Research Design
Specific method a researcher uses to collect, analyze, and interpret data
Descriptive Research
Designed to provide a snapshot of the current state of affairs
Correlational Research
Assess the relationships between and among two or more variables
Experimental Researc
Assess the causal impact of one or more experimental manipulations on a dependent variable (cause + effect)
Sample
The people chosen to participate in the research
Representative Sample
Age, sex, gender orientation, socioeconomic status ethnicity, etc…
Generalizability
Won’t apply well to anyone who wasn’t represented in the sample
Archival Research
Data that’s been previously collected
Psychological Tests
Measures developed by psychologists to assess ones’ score on a psychological construct (Ex. extroversion, self-esteem, aptitude for a particular career)
Validity
Exists when a measured instrument actually measures what you think it’s measures
Reliable
Exists when a test/survey give the same responses time to time or in different situations
WEIRD bias
Western, educated, industrialized, rich, and democratic
Naturalistic Observation
Research based on the observation of everyday events
Correlation coefficient
Can be either + or -, ranging in value from -1.0 through 0 to 1.0
Pearson Correlation Coefficient ( r )
The closer the coefficient is to -1 or +1, and the further away from zero, the greater the size of the association between the two variables (Ex. r =-.54 is stronger than r = .30)
Scatterplot
Visual image of the relationship between two variables
Third Variable
Not part of the research hypothesis but causes both observed variables to correlate
Independent Variable
Manipulated by the researchers so that there’s more than one condition
Dependent Variable
Outcome/score on the measure of interest that is dependent on the actions of the independent variable
Experimental Manipulation
Occurs prior to the measured dependent variable
Initial Equivalence
Using random assignments to conditions
Descriptive Statistics
1st step in understanding how to interpret the data you collected
Normal Distribution
Data distribution that is shaped like a bell
Arithmetic Mean ( M )
Most commonly used measure of central tendency; computed by calculating the sum of all of the scores of the variable and dividing this sum by the number of participants in the distribution, denoted by the letter N
Dispersion
Refers to the extent to which the scores are al tightly clustered around the central tendency
Standard deviation ( S )
Most commonly used measure of variability around the mean
Inferential Statistics
Provides researchers with the tools to make inferences about the meaning of results
P values
Used to determine whether or not effected detected in the research are present
Protection from harm
Participants’ physical + mental wellbeing must be protected
Use of Deception Minimized
Researchers must balance the use of deception, (Ex. not disclosing the true purpose of the study, with potential harm to the participants)
Debrief Participants
Participants must be fully informed about the purpose of the research and their participation
Care for vulnerable participants
Researchers must respect childrens’ rights + other vulnerable population to participate in research and to have the above requirements safeguareded by an advocate (Ex. a parent)
Confounding variable
Something that varies together your independent variable and you’re not controlling for it