Modeling with Rasters IV
1/12
There's no tags or description
Looks like no tags are added yet.
Name | Mastery | Learn | Test | Matching | Spaced |
|---|
No study sessions yet.
13 Terms
Linear Scale Transformations Advantages
Direct transformation and transparent
mathematically straightforward and easy to interpret
Consistency across layers (Directly comparable)
Applying the same linear scaling to all layers, they are directly comparable
no issue of different functions introduction inconsistent behaviour
Preserves relationships in the data
preserves natural spacing and order of values in the original data
No tuning of parameters needed
forget about midpoint, spread or any other parameter
won't have to think about things like what is the proper mid point of spread, this issue of relatability is gone
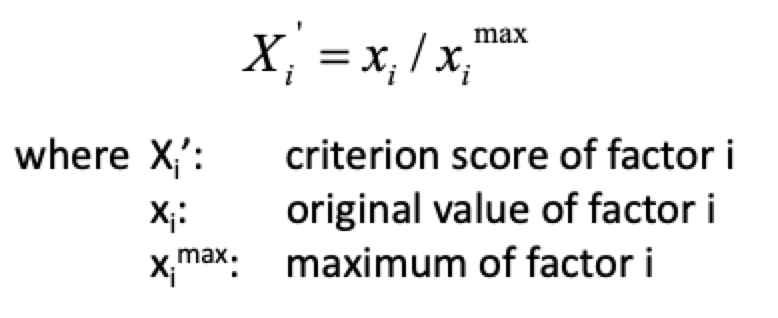
Maximum Score Procedure
scores between 0 and 1
always assigned higher values to higher input values
cannot apply to factors you wish to minimize
equation for criteria to maximize, benefit

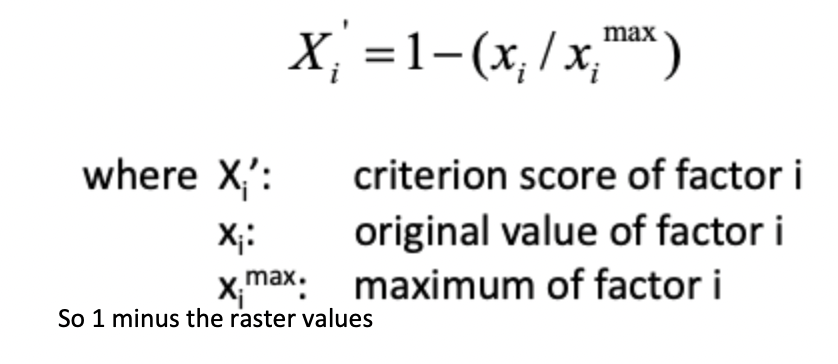
Inverse of Maximum Score Procedure
Needed to invert the max score equation so that lower values = higher suitability
If you don't do this the layer will cancel each other out, but this puts them on the same scale, not more mins or max, just thinking about what is suitable for the raster
criteria to minimize, cost

When to use Maximum Score
When…
you are fine with linear scaling, no need for non linear transformation
you have +ve values or you can shift range of values to +ve
working with benefits where higher values = more suitable
the highest logical vales represents the highest suitability
directionality is consistent
data range is not highly skewed, or influenced by extreme outliers
When NOT to use Maximum Score
data includes both costs and benefits(unless you invert costs)
data includes negative and positive values(unless you invert costs)
suitability is not linearly related to the input values(i.e., mid point is most suitable
you nee to combine multiple facets with very different ranges max score can distorts relative importance
data distribution is highly skewed - outliers disproportionately affect the scaling
you ned to reflect more complex relationships- like diminishing returns or thresholds effects
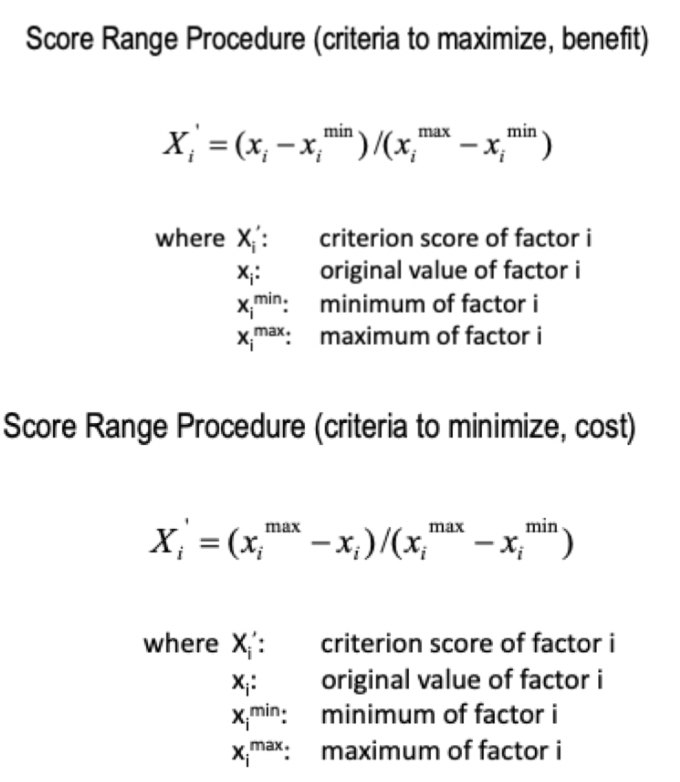
Score Range Procedure
Standardized by dividing in the numerator the pixel vales by minimum by the range of the data
No inversion the base does not change
Gives more weight to lowers values, done in raster calculator

When to use Score Range Procedure
when linear scaling is needed with a min values of 0, max of 1
if trying to reflect true suitability or proportional importance across full range of data
consistent scaling needs: used same score range equation for:
both cost and benefit criteria, no need to invert costs
rasters that include both positive and negative values, no range shift needed
When NOT to use Score Range Procedure
non linear relationships
outliers present
extreme emphasis on High/Low values needed
Weighted Sum with LST Varibles Assumptions
linearity
compensatory nature(high scores in one factor can offset low scores in another)
Independence(factor are treated independent of each other)
Normalization of factors(apply max score or score range and you have normalized your data)
Analytical Hierarchy Process
Structured technique for organizing and analyzing more complex decision problems
functions as bother a method to derive weights through a pairwise comparison approach, AND a decision rule since it defines hoe to rank alternatives and based on those weights
provides a comprehensive and rational frameworks for:
structuring a problem
representing and quantifying its elements at objective and tribute levels
relating those element to overall goals
evaluation alternative solutions
Pairwise Comparisons
developed by Saaty(1980) in the context of the AHP
“best fit” set of weights derived from a “sqaure reciprocal”
matrix used to compare all possib;le pair of critera(and/or objectives)
Approach
develop pairwise comparison matrix
computing criterion weights
estimate consistency ration
Pairwise Comparisons: Pros
only two criteria at a time are considered meaning granularity and systematic comparison and encourages consistency and transparency
We are only comparing 2 criteria at a time, so it is easier
Pairwise Comparisons: Cons
scalability(10 evaluation criteria = 45 pairwise comparisons)
subjectivity and dependency on expertise still exists here