Costs
 Call Kai
 Learn
Learn Practice Test
 Spaced Repetition
 Match
Match Flashcards
 Knowt Play
1/18

There's no tags or description
Looks like no tags are added yet.
Name | Mastery | Learn | Test | Matching | Spaced | Call with Kai | Chat |
|---|
No analytics yet
Send a link to your students to track their progress
19 Terms
Define the term ‘variable costs’
Costs that vary with output
Define the term ‘fixed costs’
Costs that do not vary with output
Total cost
Total fixed cost + Total variable cost
What is the formula for Average Fixed Cost
AFC = TFC/Q
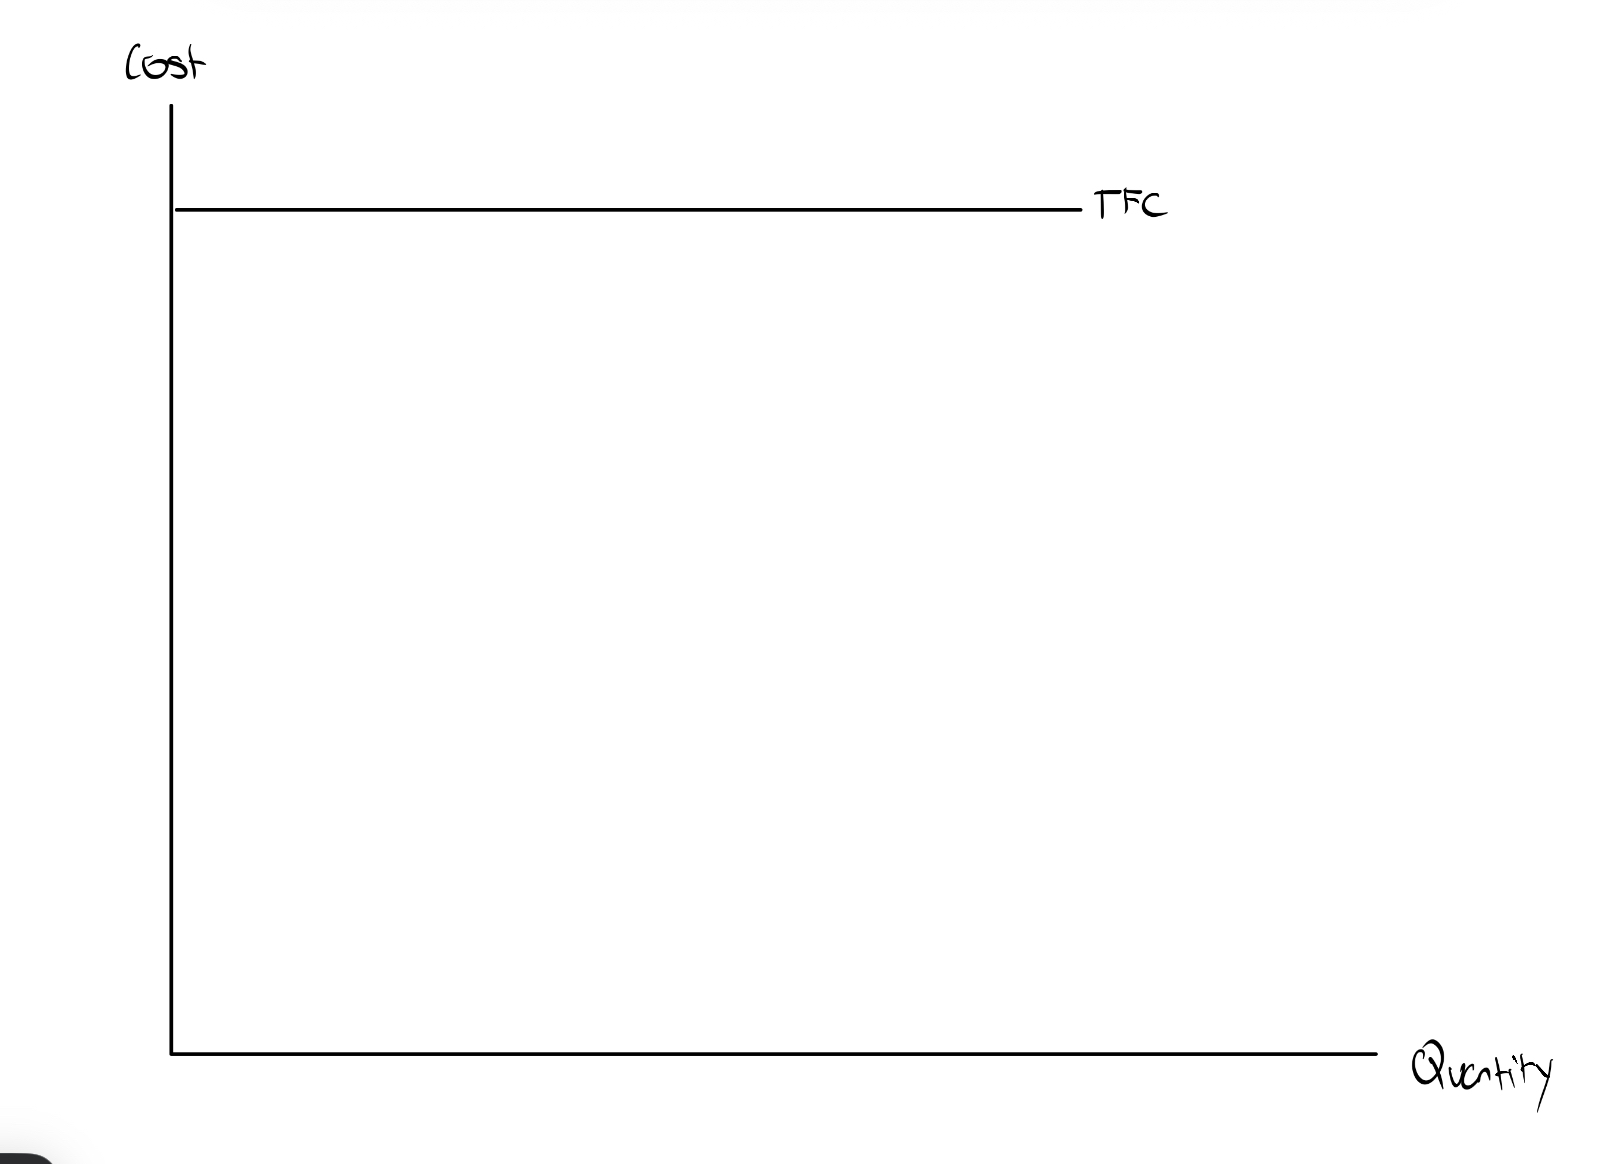
Draw a total fixed cost curve
Draw and explain the AFC curve
AFC falls as output increases, as fixed costs are spread out along more units of output.

Define the term ‘marginal cost’
The additional cost of selling one extra unit
What is the formula for marginal cost?
Percentage change in total costs/Percentage change in quantity
Explain what happens to MC, when productivity increases.
An increase in productivity means workers are more efficient, allowing them to produce a higher volume of output per hour. Assuming nominal wages remain constant, the labour cost paid per hour is now spread across a larger number of units. Therefore, the cost of producing one extra unit falls, meaning marginal cost decreases.
Explain what happens to MC, when productivity increases.
An increase in productivity means workers are less efficient, allowing them to produce a lower volume of output per hour. Assuming nominal wages remain constant, the labour cost paid per hour is now spread across a smaller number of units. Therefore, the cost of producing one extra unit rises, meaning marginal cost increases.
What is the Law of diminishing marginal returns.
In the short run, as more factors of production are employed, the additional productivity will eventually diminish.
What is the evaluation point for the law of diminishing marginal returns?
The law of diminishing marginal returns only applies in the short run. In the ling run, all factors of production are variable, meaning that productivity wont diminish when more factors of production are employed.
Draw and explain the MC curve

State the formula for Average Variable Costs
AVC = TVC/Q
Draw and explain the AVC curve
MC is below AVC as the cost of producing the next unit is lower than average. As a result, MC drags AVC down which is why AVC is now decreasing.
MC is above AVC as the cost of producing the next unit is higher than average. As a result, MC drags AVC up which is why AVC is now increasing.
Lowest point AVC=MC
An increase in MC ≠ increase in AVC - Only applies when MC is ABOVE AVC and vice versa

State the formula for Average Total Cost
ATC = (TC/Q) = (AVC + AFC)
Draw the ATC curve

Why do these curves only apply in the short run?
Fixed costs are only present in the SR, so these costs don’t apply in the long run since all factors of production are variable.
Draw and explain how LRAC is derived.
In the long run, firms are able to plan to increase the scale of production as all FOP’s are variable
This larger scale means that the firm is able to produce more units of output, so moves onto a new SRAC curve in which average costs are lower.
In the LR, a growing firm is likely to keep repeating this process, in order to expand production, with each time a more efficent SRAC is generated
LRAC is the line of best fit between the lowest points of the SRAC curves
