Ch. 9: Labour Market Decisions of Firms (Micro) Demand for Labour
1/19
There's no tags or description
Looks like no tags are added yet.
Name | Mastery | Learn | Test | Matching | Spaced | Call with Kai |
|---|
No analytics yet
Send a link to your students to track their progress
20 Terms
Wage Elasticity of Demand
Depends on:
Percentage of labour costs in total costs
Number of subs for labour
Price elasticity of th prod. or service
Labour Productivity
The output per worker
Gross Domestic Product
GDP
The value of all final goods and services produced in a year
Workers are more productive
Increases as output increases
Productity Growth: Macro Influences
The economy as a whole
Structure of the economy
Industrial composition: Manufacturing or services
Economic conditions
Recession or expansion
Govt. policies:
Fiscal Policies: Spending and taxation
Productity Growth: Micro Influences
Individuals business firms
Scale of business operations: Large businesses are more productive
Management technique: Educated managers are better at motivating staff an using better tools and equipment leading to higher productivity
Firm’s Demand for Labour
Dervied from th demand for final goods and services that require labour as an input
Also influenced by the productivity of lavour improve through experience and education
Market’s view of the value of the services
Productivity Growth: Micro and Macro
The economy as a whole
Quantity and quality of capital: Employees become more productive as the quality and quantity of the tools increase
Labour Force; Characteristics of the labour force (age, health, education, etc)
Quasi-Fixed Labour Costs
Non-wage to hiring employees that are not related to the hours of work
Hiring costs: Advertising, screening, recording keeping, payroll, etc
Training: Materials and salaries of trainers
Opportunity Costs: Lost production from those in training
Marginal Revenue
Revenue from selling one more product
Short Run
A period when at least one factor of prod. cannot be changed
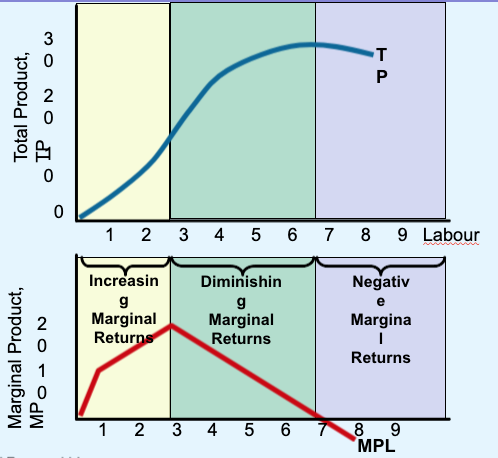
Law of Diminishing Returns
LDR
States that in the short run a point will be reached at which the extra contribution of the next worker to total output will be less than that of the previously hired worker
Contribution of the next worker to total output is the Marginal Product of Labour (MPL)

Why the Long Run Demand Curve Slopes Down
Long Run: All factors of production are variable
Scale Effect: Cost goes down as quanitity demand increases
Hire more if selling more
Subsitution Effect
Sub. Capital (machinery) for labour, making it cheaper and faster
Marginal Product of Labour
MPL
Can covert the contribution of each successive worker into a dollar of revenue
Marginal Revenue: Addition to total revenue as a result of selling an extra unit of output
MPL x MR= MPL
Employer’s Decision Rule for Hiring
Wage rate > MRP (Marginal Revenue Product)= Don’t hire
Wage rate < MRP= Hire
Wage rate = MRP= Indifferent, need to watch that line!
Scale Effect
The change in the number of employees hired as a result of changes in the amount sold
Two Reasons for Increases in Demand for Labour
Increases due to greater productivity of labour
Improvement in MPL
Can also increase due to shifts in demand for final foods or services, tus increasing MR
Demand for Labour in a Given Occupation can Change…
Increases in demand for final goods and services to make them
Change in the price of substitutes: Unions vs non-unions
Change in the price of complements: Price of steel drops= increase in demand for steel workers
Change in Quantity Demand in Response to a Change in Wage Rate
= Percentage change in the quantity of workers demanded/ percentage change in the wage rate
Ed= %△ / %△WR
Ed> 1.0 (elastic)
Cross Elasticity of Demand
Increase in wages paid to one occupation can lead to changes in another occupation
Increase= sub effect
Decrease= complementary effect
Coefficent= %△OccA / %△WROccB