queuing
1/39
There's no tags or description
Looks like no tags are added yet.
Name | Mastery | Learn | Test | Matching | Spaced |
|---|
No study sessions yet.
40 Terms
reasons for wait
servers
not enough
too slow
customer
too many
people arriving before you
business perspective
should reduce amount of time customers wait
customer perspective
find queues to be fair cuz served in the order you arrive
queuing models
gives the amount of service you should be providing
affected by wait times which can be mitigated by # of employees
more = shorter line but more labor expense
less = longer line but more cost of unhappy customers
units
entity that waits in queues
ex.
customers
commuters
jobs
printers
subassemblies in manufacturing
emails
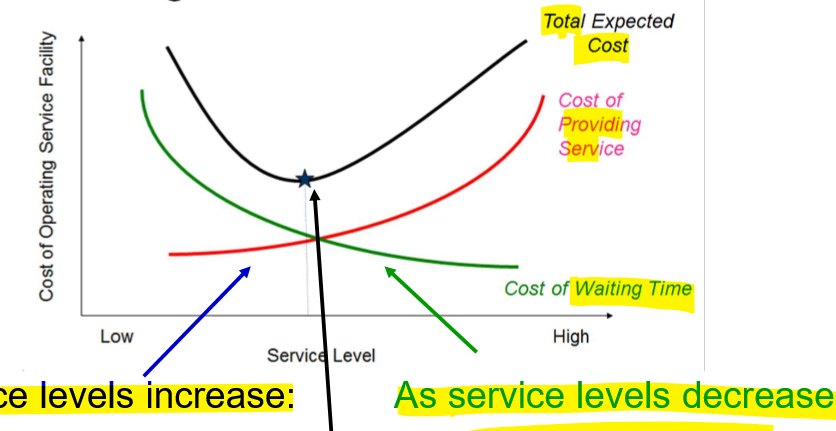
trade-offs in queuing models
graph
queuing costs (service and unhappy customers) v. service levels
optimal service level
not directly above cost intersect
cuz not found through formula
as service inc.
cost of service inc. but cost of unhappy customer dec.
as service dec.
cost of service dec. but cost of unhappy customers dec.
performance measures
used to determine:
effect of changing # of servers
Effect of changing arrival rate
effect of reducing avg. service time
to eval. efficiency and effectiveness
types
avg. # of customers waiting in line
avg. # of customers in system
avg. waiting time in queue
avg. time in system
line-up actions
customers will do one of the following
wait in line
not join the line
leaving right away
jockey
when multiple lines
if find that ur line is too long and the other is shorter, then move to it
initially join the line then leave
meld
multiple lines become one big line
queuing theory
deals w/ queues
in early 1900s by A.K. Erlang
through studying congestion and waiting times on phone lines
psyc. tips for queue manage.
perception of wait
tendency to overestimate waiting time
feels longer than it is
acceptable waiting time depends on:
type of service
urgent or no?
type of waiting
in person v. through phone
more willing if in person cuz already allocated time and effort to the endeavor
type of customer
do they have kids w/ them?
distractions
provide them
things to do
ex.
tv.
magazines etc.
avoid line-up whenever possible
plan for the endeavor beforehand
through ex.
appointments etc.
whether to provide awareness of time?
provide only if customer is unable to do it themselves
ex.
position in phone line
time till boarding a plane
modify arrival behav.
incentives to come at non-peak hours
ex.
make it cheaper etc.
idle resources out of sight
dont let customers see staff not doing anything
segment customers
into who will wait vs. who is willing to pay extra to not wait
only if high volume
think long term
dont let long lines be apart of ur company’s reputation
friendly server
alter the impression of the wait
ex.
apologize for the wait
disneyland ex. of dealing w/ queues
park pass can be used to virtually line up for an attraction
it will tell you what time your turn will be at
a way of making you do other things (that will cost money) while waiting
tell what times are busy for diff. meal times
virtual queues for restaurant
will tell you when they’re ready for you and food will already be ready by the time you get there
queuing configurations
follow FCFS
first come first serve
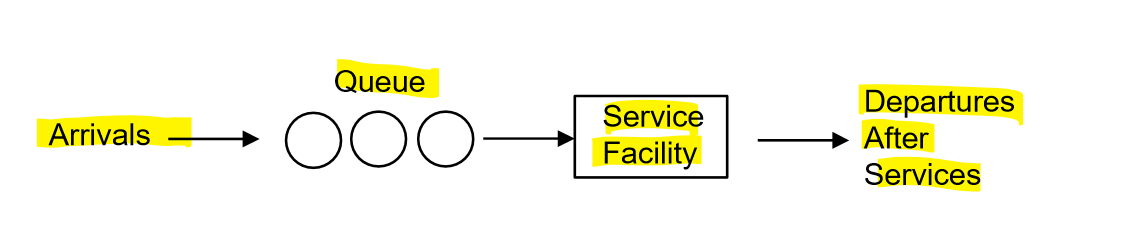
parts of a queuing system
arrivals → queue → service facility (where the service itself occurs) → departure after services
defined by # of channels/servers and # of phases
types:
singe server, single phase
single server, multi-phase
multi server, single phase
multi server, multi phase

single server, single phase
1lineup and 1 server
ex.
one banking machine
a car wash
small business w/ one cashier
a dive board at a pool
single server, multi-phase
1 lineup leads to 1 server then from there another lineup leads to another server that provides the main service
ex.
fast food drive-thrus
1st asks for your order
2nd gives you the food
assembly lines
multi server, single phase
1 lineup leads to multiple server of which you choose 1
ex.
bank tellers
checking in at an airport
NOT like in a big grocery store
multiple separate lines
that are single server, single phase
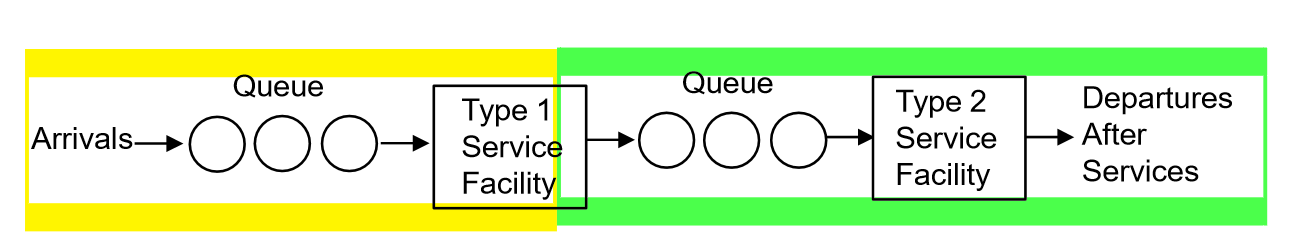
multi server, multi phase
1 line leads to multiple servers of which you choose one who then pass you over to a type 2 server that will complete the service
ex.
health care
auto repair
job shops
calling pop.
where arrivals come from
character. (each has alternatives):
size
big / infinite
most common
# in line < # that could come to line
small /finite
pre-set max. that can join line
arrival pattern
distribution
random
poisson
based on independent arrivals
pre-determined
based on appointment
attitude
patient
will wait
impatient
will leave w/out service
through
balking
not joining line at all
reneging
join and then leave
the system
customers arrive to it at a random time
then, either:
if server idle, customer receives service right away
if server busy, customer must wait in the queue before being served
then time is taken to process customer
customer leaves system when finished
queue time + service time = system time
to describe and calculate performance need to know
prob. distribution of inter-arrival times
prob. distribution of service times
number of servers
avg. arrival rate
denoted as:
lambda λ
avg. # of customers arriving in a time period
modelled by poisson distribution
because time between arrivals is independent
so should be an integer
ex.
2 arrivals per minute
λ = 2
poisson prob. distribution
the prob. of x customers arriving in a time period
P(x) = ((λ ^x)*(e^-λ ))/x!
x = the actual number of arrivals
λ = the mean/ avg. # of arrivals
will give a percentage
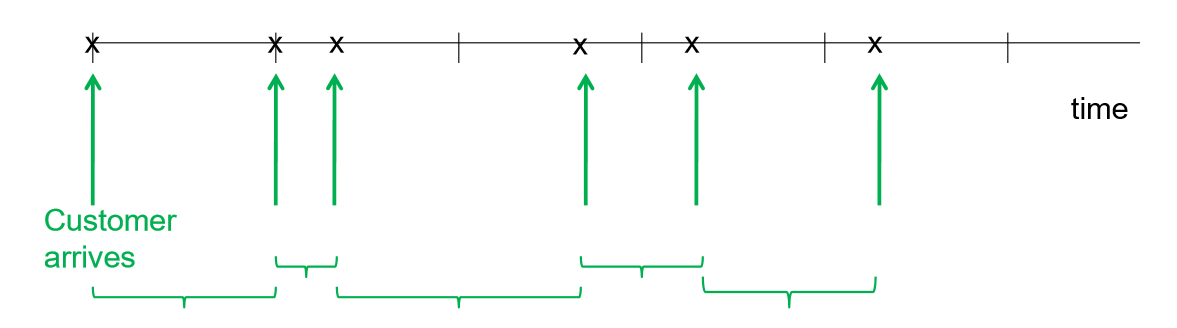
avg. inter-arrival time
1/ λ
modelled by exponential distribution
so does not have to be an integer
ex.
2 arrivals per minute
λ = 2
inter-arrival time
1/ lambda = ½ minutes
in seconds
60 seconds/ lambda
60 seconds/ 2 = 30 seconds
this is what causes a queue to form
avg. service rate
# of customers that can be served by 1 server
denoted as:
mu μ
follows the poisson distribution
ex.
serve 3 customers per minute
μ = 3
avg. service time
the time needed to provide the service
does not include queue time
denoted as
1/μ or 1/ service rate
follows the exponential distribution
ex.
serve 3 customers per minute
μ = 3
service time = 1/μ = 1/3 minutes
to get seconds:
60 seconds/ μ
60 seconds/ 3 = 20 seconds

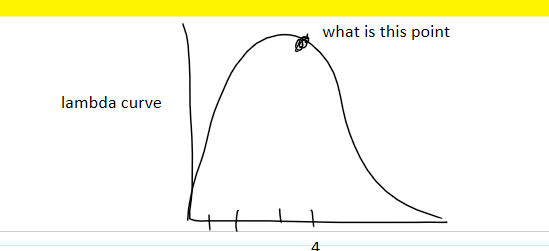
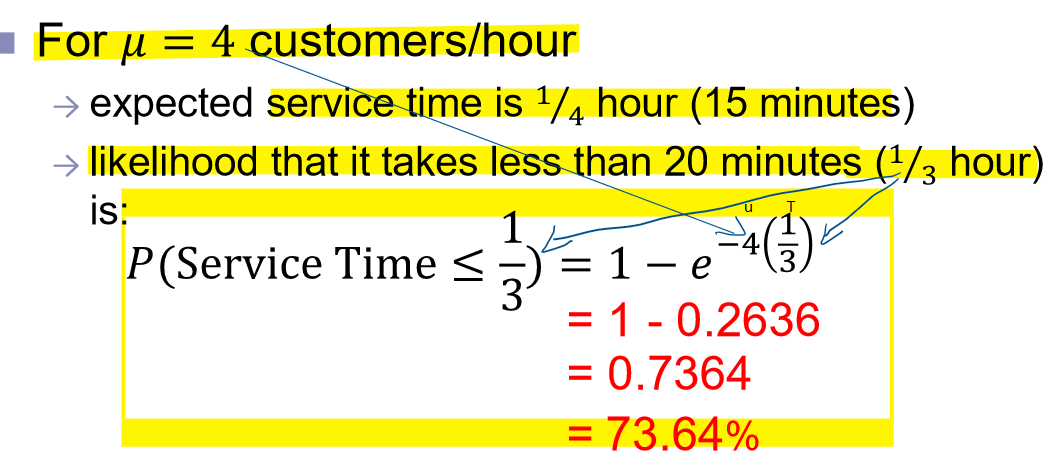
prob. distribution of service time
P(service time <=t) = 1-(e^-μt)
to solve:
make sure the service rate, service time and t is in the same units
per hour, minutes etc.
variability
if arrivals are less than amount of people servers can serve, easy to assume that there should not be any waitin in line
NOT TRUE
the quantities are only avg.s so in real life there can be more arrivals in certain time periods than others or some service times are taking too long compared to others
therefore, no guarantee that there will not be a line
kendall notation
describes the character. of a queuing model
M/ /
most common: M/M/1
1st M
prob. distrib. for arrival process
poisson
2nd M
prob. distribution for service time
exponential
1 = # of servers
use when:
customers arrive w/out appointments
system is stable
first come first serve
no balking or reneging
system has reached a steady state
M
markovian* inter-arrival times
markovian = arrival+service or poisson+exponential
M/M/3
3 servers
queuing theory elements
s = # of servers
lambda = avg. arrival rate
mu = avg. service rate
first in, first out
first come first serve
idle time
w/in a time period
time between end of service and arrival time of next service * number of customers
total work time
reciprocal of idle time
service time*#of customers
how queues form
occurs when there’s a lagging in the system
components of chart
customer #
arrival time
# in system
wait
duration
start time
service time
duration
end time
start time = end time of last customer
wait = start time - arrival time
if balking occurs
from wait → end time
- - - -
if reneging
from start time → end time
- - -
the time they waited will be under wait time
next person’s start time = end time of person before reneger
steady state
at start of day start at an “empty and idle” state then business activity increases till you reach a normal or steady state of operation
observed rate of arrival = avg. rate of arrival = lambda
steady- state can occur at diff. times
ex.
restaurants reach at lunch and dinner time
traffic reaches at morning and evening
stable system
when:
lambda<mu
arrival rate is less than service rate
utilization (U)
U = p = lambda/ (# of servers*mu)
make sure arrival and service rate are in the same units
p = traffic ratio
if less than 1, system is stable
if not queue explodes → too big
% of time servers are busy
high U is good if the units are items not people
M/M/1 performance measures
utilization rate(%)
U = λ/μ
prob of 0 customers(%)
% of time servers are not busy
aka idle time
Po = 1-(λ/μ )
OR
Po = 1 - U
prob. of a customer waiting (%)
customer waits when server is busy in M/M/1
Pw = U
OR
Pw = 1 - Po
λ/μ
avg. # of customers in queue (units)
Lq = λ²/(μ(μ-λ))
OR
Lq = L-(λ/μ)
Lq = L - U
avg. # of customers in system (units)
in queue + being served
L = Lq +λ/μ
L = Lq + U
OR
λ/(μ-λ)
avg. time customer in queue
in time in same units as given in og problem
ex. to get minutes from hours
hours* minutes in an hour = minutes
Wq = Lq/λ
OR
W - service time
W - 1/ μ
OR
λ/ (μ(μ-λ))
avg. time customer in system
in time in same units as given in og problem
in queue + being served
W = L/λ
OR
W = 1/(μ-λ)
OR
w = Wq + service time
W = Wq + 1/μ
prob. of n customers in system
prob. of an exact amount
Pn = (1-(λ/μ ))*((λ/μ ) ^n)
OR
Pn = Po*(U^n)
prob. of more than k customers in system
Pn>k = (λ/μ ) ^k+1
OR
Pn>k = U^k+1
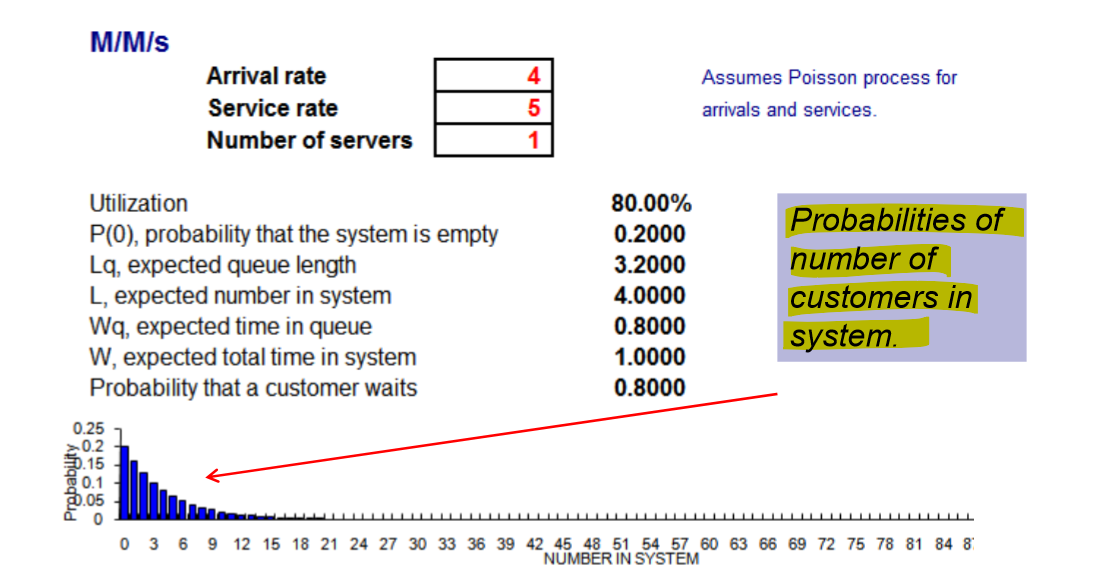
Q.xls
calc. performance measures for M/M
where s can be any number of servers
expected = avg.
decision making for queues
answers:
how busy should a server be
tradeoff between higher server utilization and long queues
multiple single-server queues v. multiple server queue
do we need more servers
increase service speed v. inc. servers
how busy should a server be
ex.
service time = 6 minutes
work backwards to get mu
(60 minutes/ hour)*(1 service/6 minutes = 60 services/ 6 hours = 10 service/hour
so, service rate = 10
when comparing diff. arrival rate up to 10 and seeing U, Wq (time in queue), and Lq (people in queue)
observation 1: when U too high, Wq and Lq get extremely high
can save resources but too much system congestion
observation 2: up to around 70% U, no sig. changes in Wq or Lq till then
to reduce wait time need to reduce variation
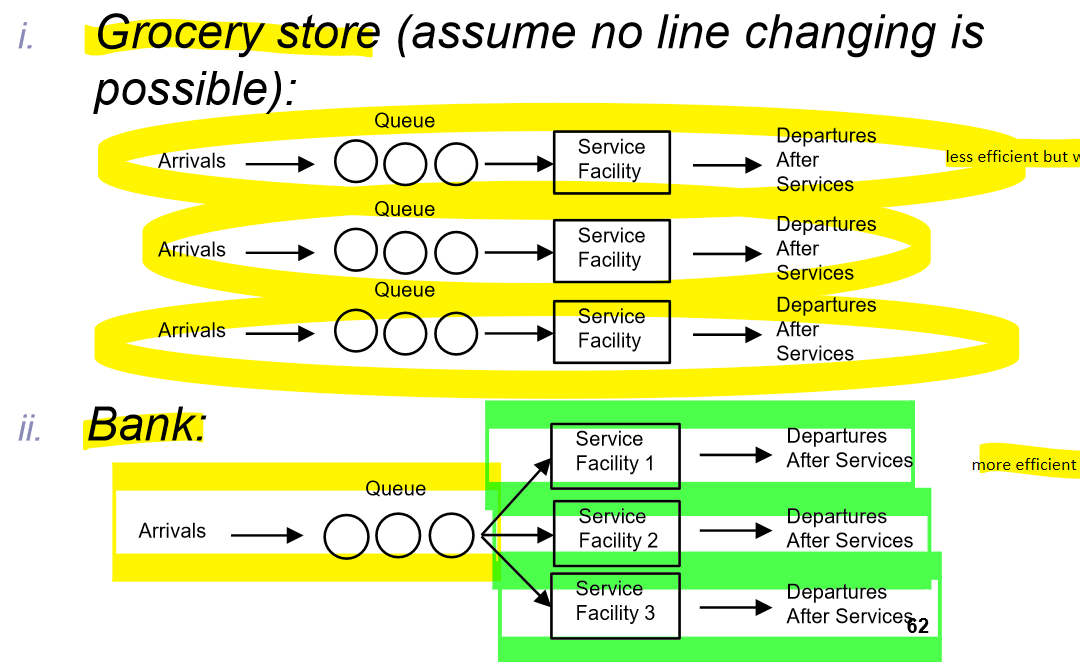
multiple single-server queues v. multiple server queue
multiple single server
less efficient
cuz cant switch lines (jockey)
but good if:
you want customer to be engaging in other things like buying
if want to reduce traffic
there’s a prep time needed
ex. putting things on a conveyor belt beforehand
mostly used in grocery stores
multiple server queue
if goal is to get through most people as fast as possible
more efficient
ex. used in banks
can be enforced
cash machines
washroom stalls
fast food
between both
U will be the same but all other performance measures will be diff.
do we need more servers (eCycle case Study)
ex.
received $30,000 waiting fee
between when city trailers get to facility and service begins
a $60/ hour fee for waiting at the dock including unloading
1 loading dock
2 employees
paid $24/ hour
mu = 4 per day
lambda = 3 per day
need to answer 3 things:
how long do the trailers wait at the late of 60/ hours
is the 30,000 invoice correct
find W (avg. time (days) in system)
1/(μ-λ) = 1/ (4 - 3) = 1 day
find L (avg. # of trailers in system)
λ/(μ-λ) = 3/(4-3) = 3
use 1 and 2 to get cost per day
3 trailers per day for 8 hours a day for $60 per hour
3×8×$60 = $1440
get weekly
$1440×5 = $7200
get monthly
(52 weeks/ 12 months)*$7200 = $31,176
therefore, 30,000 invoice is correct
what are the current costs
are the trailers or the employees more expensive
get cost of workers per day
2 workers work for 8 hours a day at a rate of $24 per hour
2×8*$24 = 384
get weekly
$384×5 = 1,920
get monthly
$1,920*(52 wks/12 months) = $8,314
compare to the 31,176 you got for the trailers
conclude that more costs come from trailer
around 79%
cen reduce by getting more crew
how does the change in crew size affect costs and what is the optimal crew size
assuming that each extra worker = 1 more trailer unloaded per day
go through step 1 again while adding the 1 extra worker until the total daily cost hits a minimum
other process improvements
lower unloading time
through use of pallets or conveyor belts
increase loading docks
dont use city trailers in the first place
have them arrive by appointment/ set times
flexible crew size
other people can come help if one is taking too long
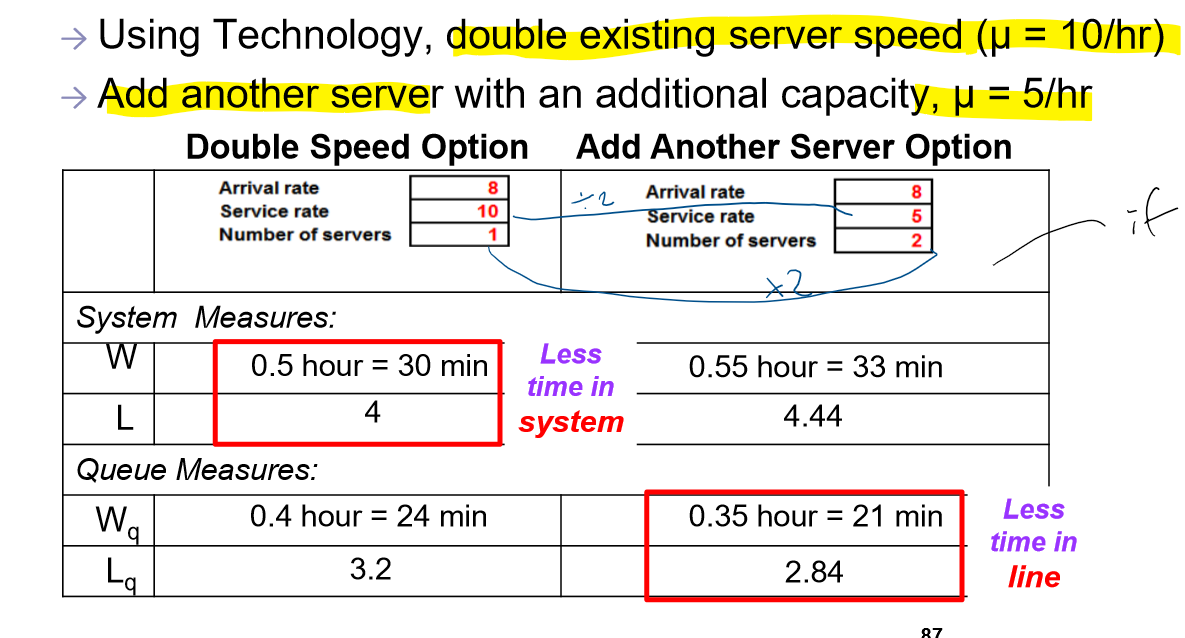
increase service speed v. inc. servers
depends on:
if want to shorten wait time = add server
if want to shorten service time = speed up service
using queuing theory v. simulation
simulation
more accurate
performance measure more extensive
more flexible
can be used in many situation
queuing theory
more convenient
dont need software
quicker
dont need tech