Investments - Formulas
1/24
There's no tags or description
Looks like no tags are added yet.
Name | Mastery | Learn | Test | Matching | Spaced | Call with Kai |
|---|
No analytics yet
Send a link to your students to track their progress
25 Terms
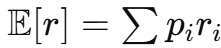
Expected return - E[r]
Excel: =SUMPRODUCT(p_range; r_range)
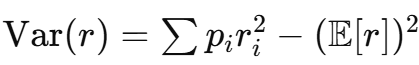
Variance - σ2
Excel: =SUMPRODUCT(p; r2) - (SUMPRODUCT(p; r))2
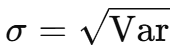
Standard deviation from variance - σ
=SQRT(variance_cell)
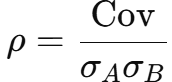
Covariance
Excel: =COVARIANCE.S(rA_range; rM_range)
Correlation (sample, time series)
Excel: =CORREL(rA; rB)
Mean vs geometric mean
Arithmetic: =AVERAGE(r); Geometric for periodic simple returns: =PRODUCT(1+r)^(1/n)-1
Sharpe Ratio
Excel: =(E[r]-rf)/sigma
![<p>Excel: <code>=(E[r]-rf)/sigma</code></p>](https://knowt-user-attachments.s3.amazonaws.com/8805e912-606f-4a78-a480-a4a1786dd81c.png)
Implied rfr_frf from Sharpe and (μ, σ)
rf = μ − S σ
Normal VaR at 95% (returns)
Excel: =mu + NORM.S.INV(0.05)*sigma
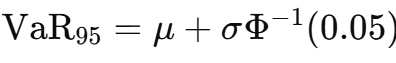
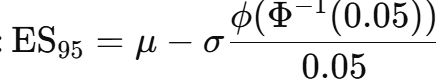
Normal ES at 95%
Excel: =mu - sigma*NORM.S.DIST(NORM.S.INV(0.05);FALSE)/0.05
Historical VaR at q
Excel: =PERCENTILE.EXC(r; q)
Interpreting VaR number
95% VaR of −12%: on a typical day you lose ≤ 12%; 5% chance you lose more
Interpreting ES number
Average loss conditional on being in worst 5% outcomes
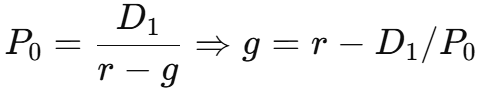
Gordon with next dividend D1
Gordon when given D0
Multi-stage DDM — structure
PV of each stage’s dividends + terminal
Excel — PV of years 1–5 constant D1_5
=SUM(D1_5/(1+r)^{SEQUENCE(5)})
Terminal value at T with perpetual growth g
TVT = CF_{T+1}/(r-g)
Multi-stage DDM (years 1–5 = D15; 6–10 = D610; then g)
Stage 1 annuity PV:
=PV(r; 5; D1_5; 0; 0)Stage 2 annuity PV at t=5:
=PV(r; 5; D6_10; 0; 0)then PV today:=PV(r; 5; 0; -that; 0)TV at t=10:
=D6_10*(1+g)/(r-g)then PV today:=PV(r; 10; 0; -TV; 0)Fair price = sum of three PVs
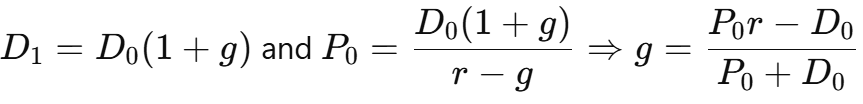
DDM when given D0
D1 = D0*(1+g); P0 = D1/(r-g). Solve g: = (P0*r - D0)/(P0 + D0)
HPR with dividends and split
=(P1*Shares*Split + Shares*Div - Shares*P0)/(Shares*P0)