Unit 4 Natural and Human Populations
1/45
There's no tags or description
Looks like no tags are added yet.
Name | Mastery | Learn | Test | Matching | Spaced |
|---|
No study sessions yet.
46 Terms
1. Order of Life for Smallest to Largest
Individual, Population, Community, Ecosystem
2. Exponential growth
a population that does not have resource limitations; J-shaped curve (ex. 2,4,8,16)

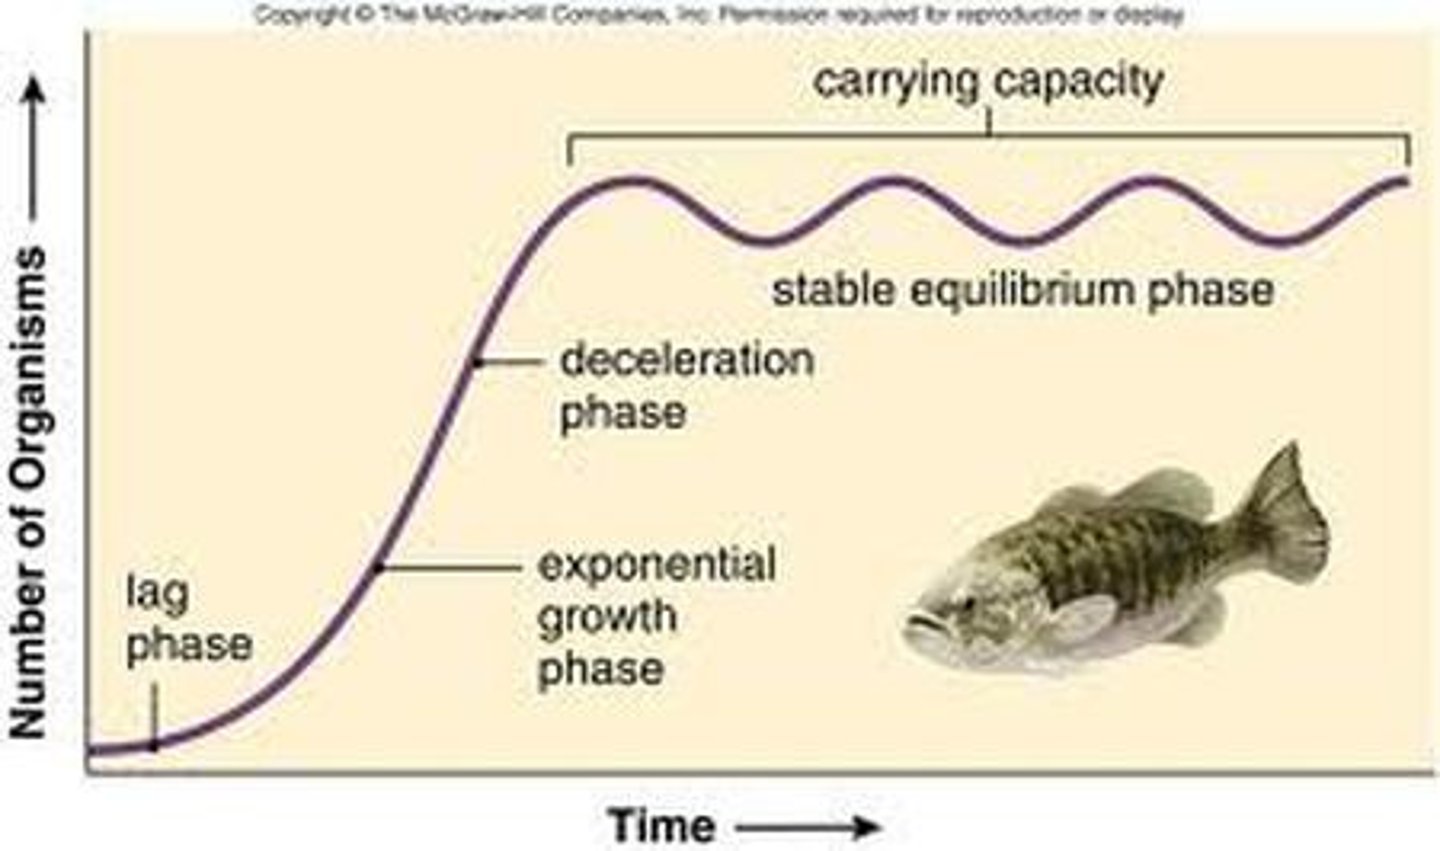
3. Logistic curve
a plot that shows how the initial exponential growth of a population is slowed and finally brought to a standstill by limiting factors; S-shaped curve (diagram 2)
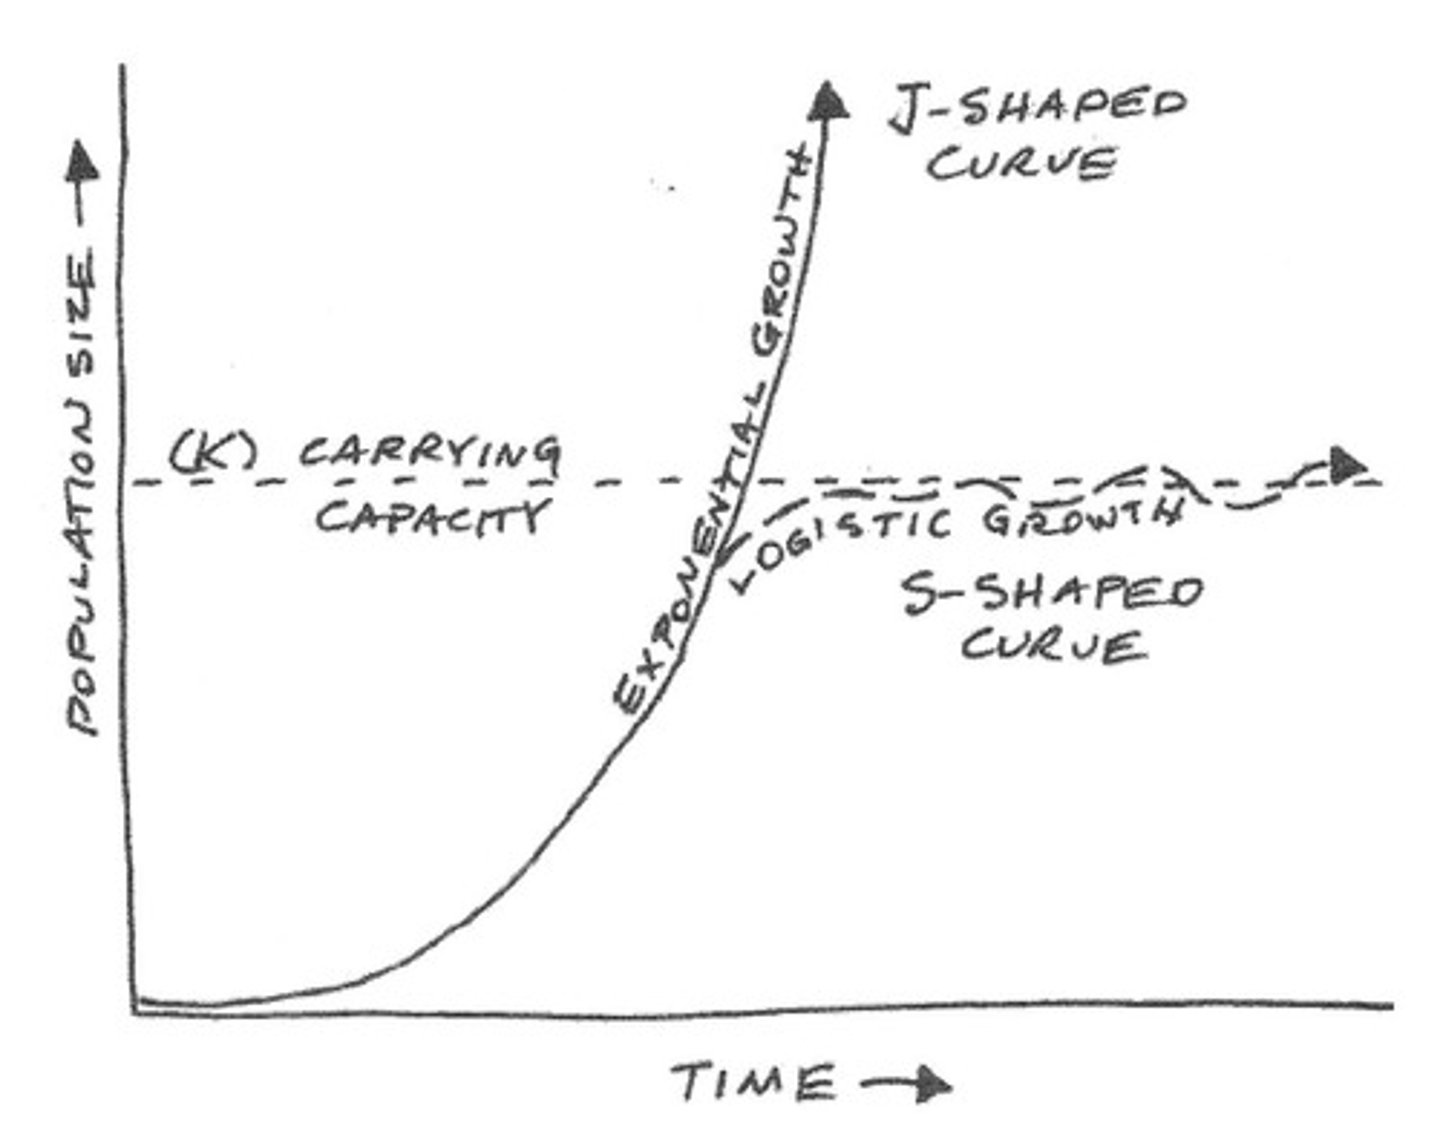
4. Carrying capacity (K)
the number of individuals of a given space that can be sustained indefinitely in a given space; determined by biotic potential and environmental resistance (diagram 2)
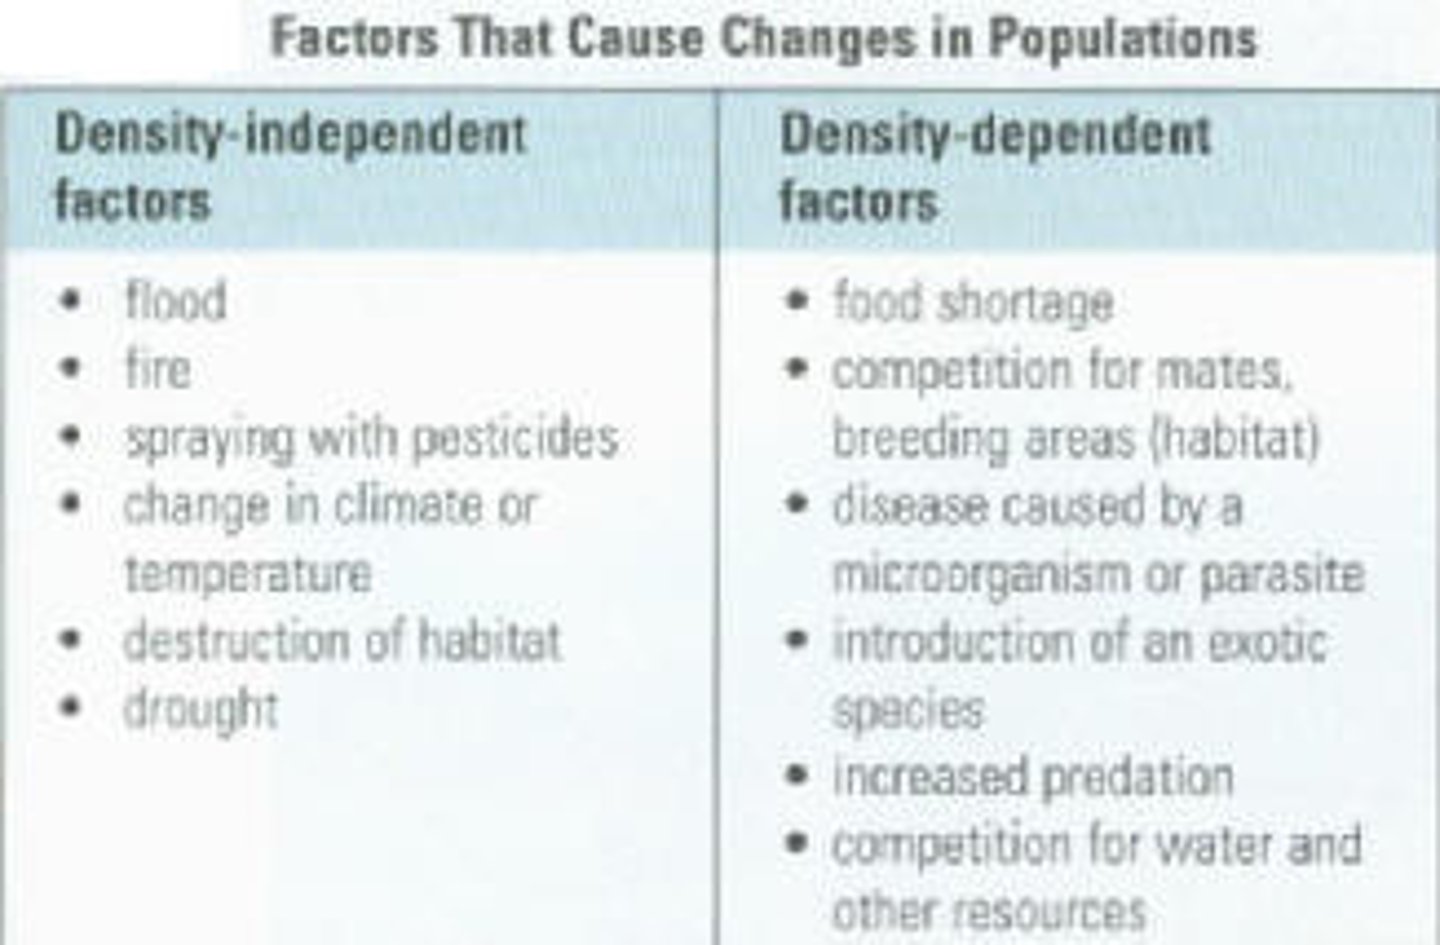
5. Density-Dependent Limiting Factors
conditions that have a greater effect on the denser populations; an example is the transmission of infectious disease or food resources (higher density = spreads easily)

6. Density-Independent Limiting Factors
affect all populations regardless of size or density; examples are natural disasters like flooding or hurricanes
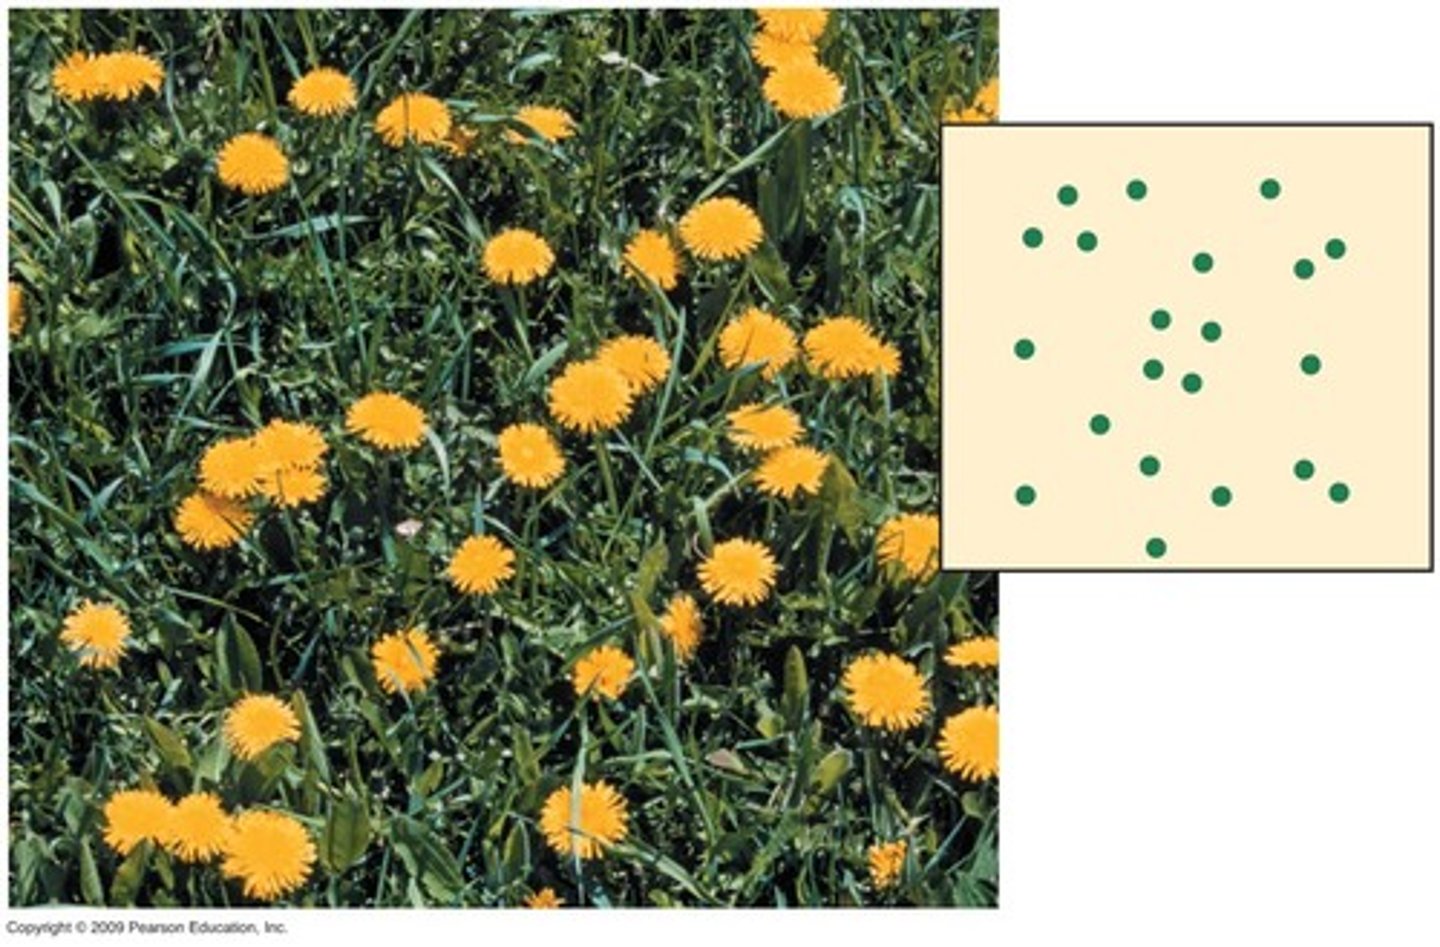
7. Random Dispersion
occurs when a population is spread through a habitat by chance alone; an example would be dandelions on a hillside
8. Uniform Dispersion
is the result of intraspecific competition (same species competing) and leaves the population dispersed in an orderly fashion, an example is seabirds during breeding season (penguins) show planet earth shallow seas 20 min in

9. Clumped Dispersion
occurs when it is beneficial for the population to congregate together. This could be the result of isolated resources, like a watering hole in the dry season, or the safety of the species from predation

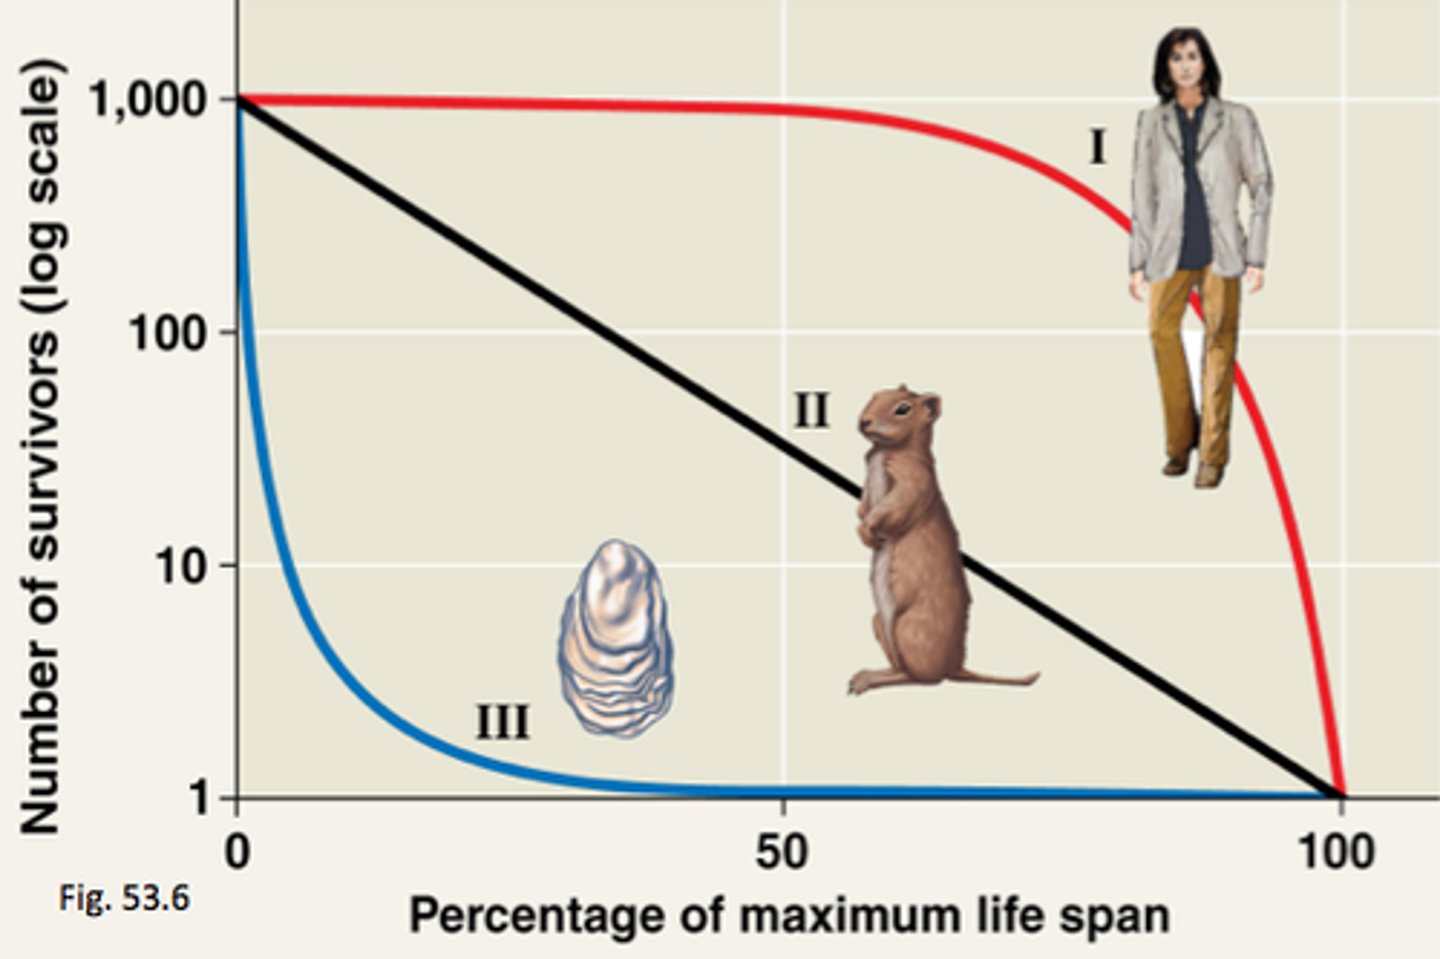
10. Type I Survivorship Curve
younger organisms have high probability of survival and almost all individuals reach middle age, but after middle age there is an increasing probability of death ex. humans (K-strategists)
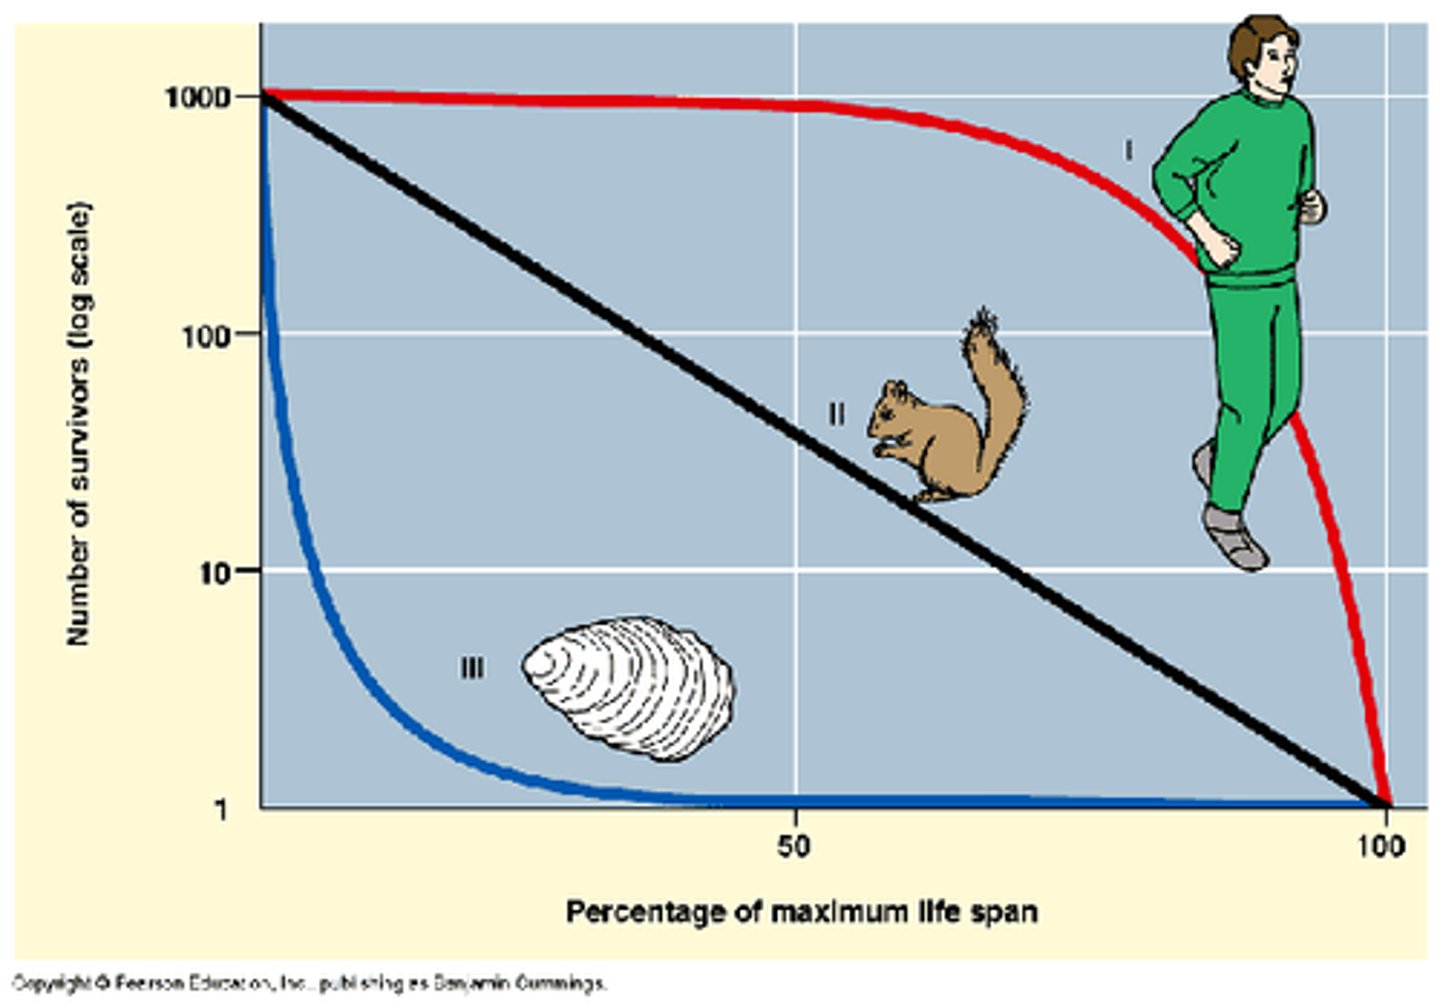
11. Type II Survivorship Curve
probability of death is equally likely in all age groups ex. song birds
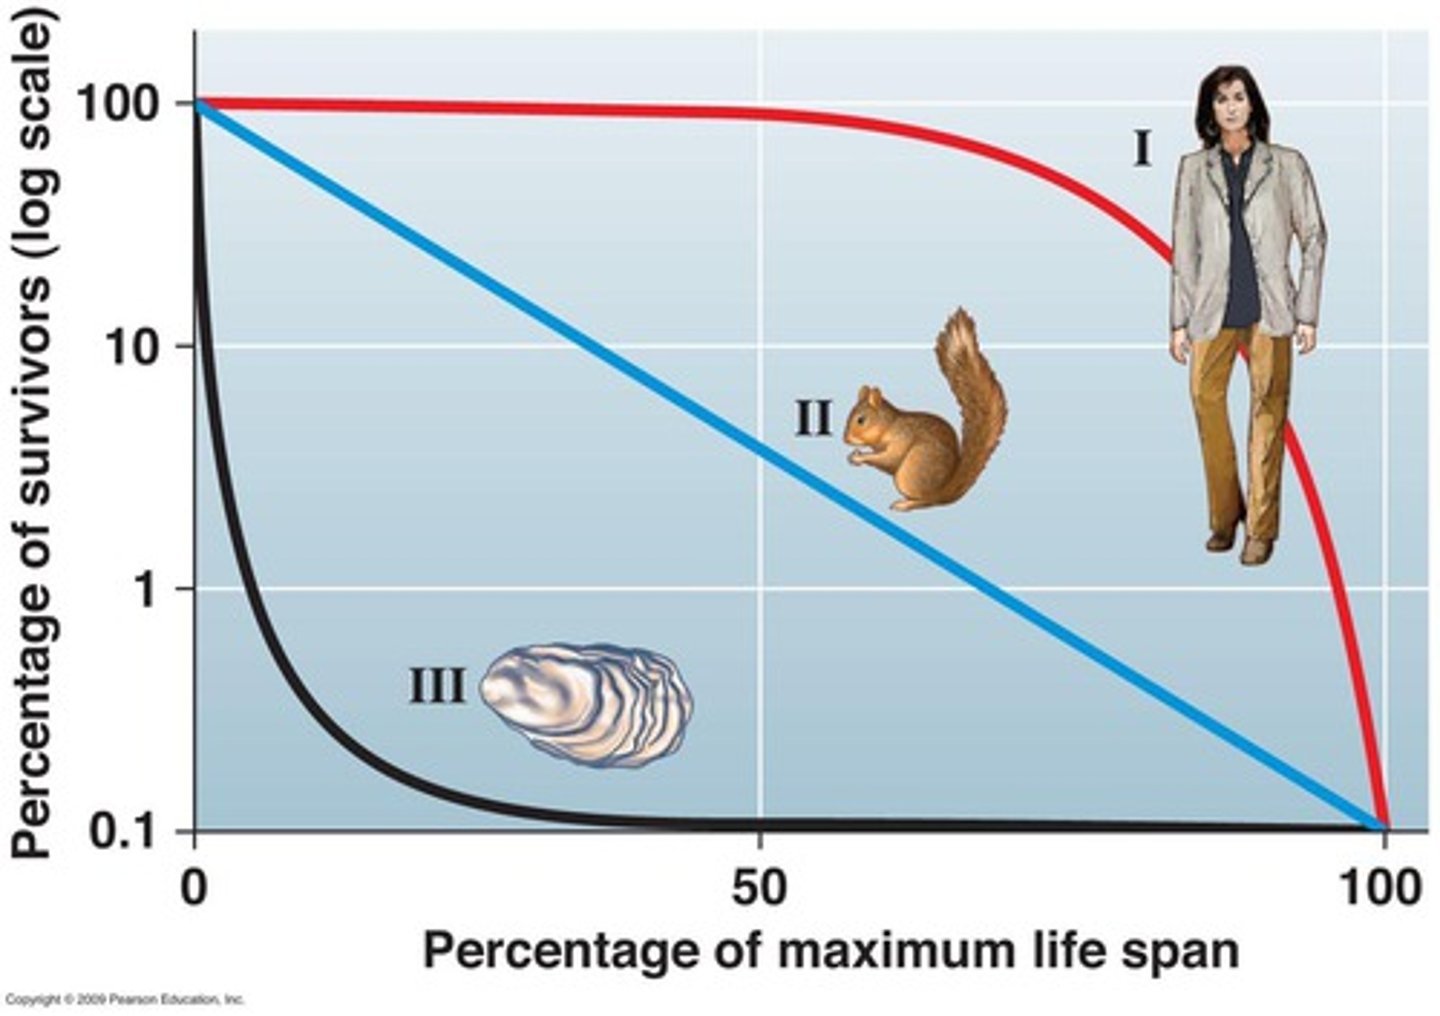
12. Type III Survivorship Curve
likelihood of death is very high at young ages, & most of individuals in pop die off quickly within 1st part of life. The few that survive to adulthood have high probability of surviving for some time ex. plants and insects (r-strategists)
13. r-strategist
reproductive strategy in which organisms reproduce early; bear many small; unprotected offspring which has small chance of surviving to maturity (ex. insects, mice)
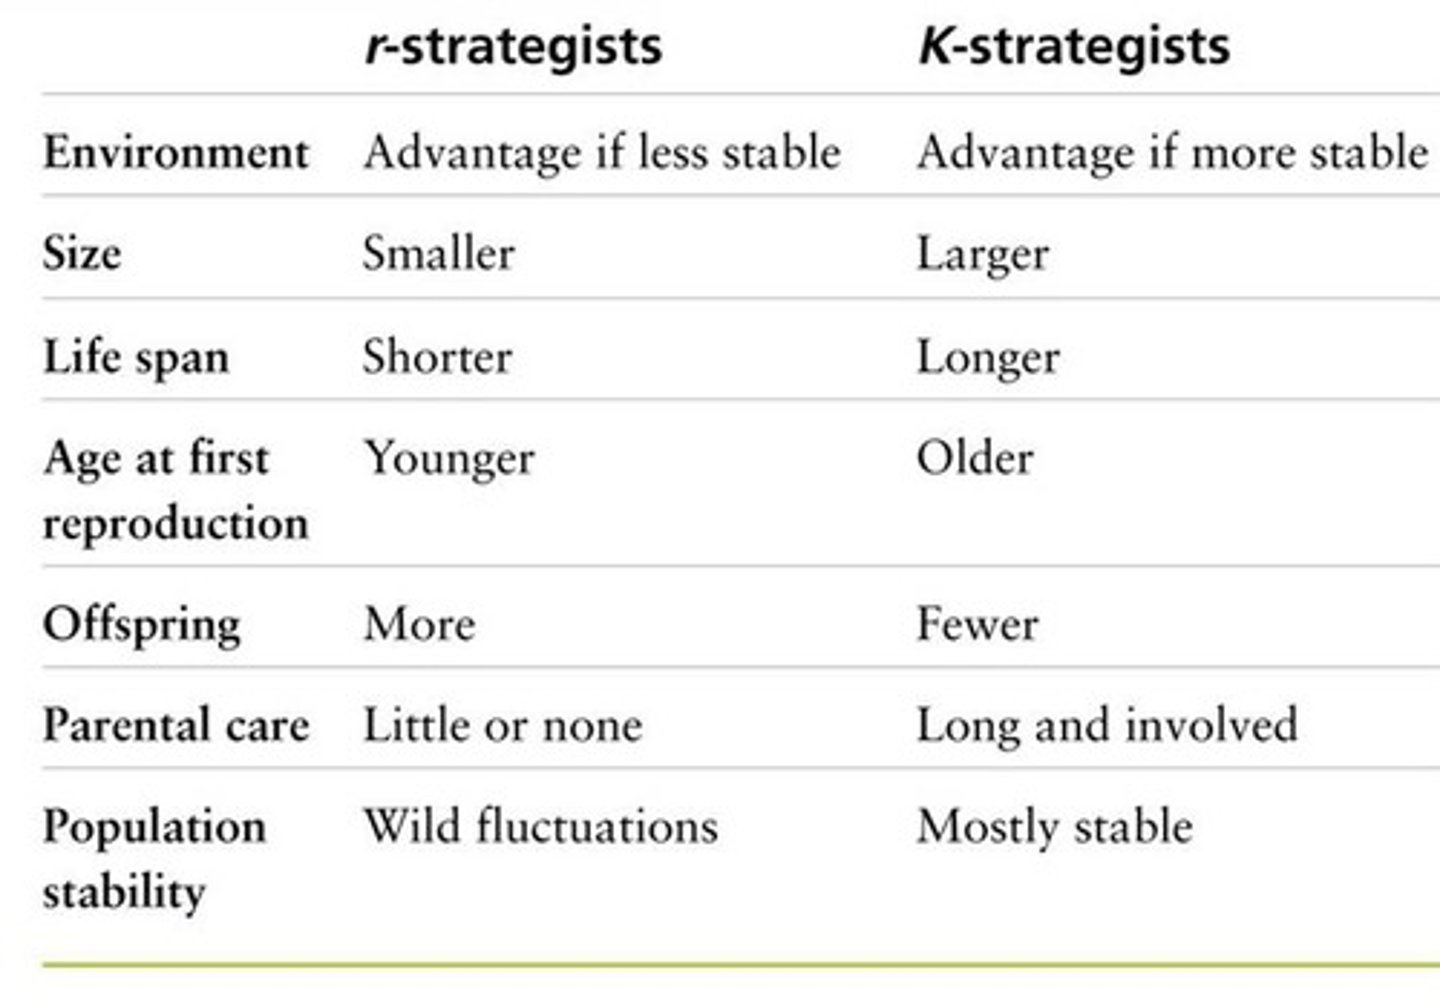
14. K-strategist
reproduce late in life; few offspring; care for offspring each of which has a relatively high probability of surviving to maturity (ex. elephants)

15. What Does Anthropogenic Mean?
caused or produced by humans
16. The Tragedy of the Commons
(1968 paper by ecologist Garret Hardin) Global commons such as atmosphere & oceans are used by all and owned by none. When no individual has ownership, no one takes responsibility. Examples: overfishing in the oceans, over pumping of the Ogallala Aquifer or spewing various air pollutants into the atmosphere
17. Ecological Footprint
it is the amount of the environment necessary to produce the goods and services needed to support a particular lifestyle. US is highest - Africa is lowest

18. The TWO factors that contributed to the exponential growth of humans
• The Agricultural Revolution led to food surpluses for the first time in human history
• The Industrial Revolution improved living conditions and modern medicines, leading to longer lifespans and decreased infant mortality
19. World Population
8.1 billion; U. S. Population: 336 million
20. Top Three Most Populated Nations
1) India 1.44 bil; 2) China 1.41 bil; 3) U.S.
21. Most Important Factor Affecting Population Growth
low status/education of women
22. Methods or Ways to Decrease Birth Rate
family planning, contraception, economic rewards and penalties (ex. one child policy in China)
23. Malthus said
"human population cannot continue to increase exponentially; consequences will be war, famine and pestilence (disease)."
24. Growth Rate (r) using CBR and CDR
(r) = (CBR - CDR) / 10
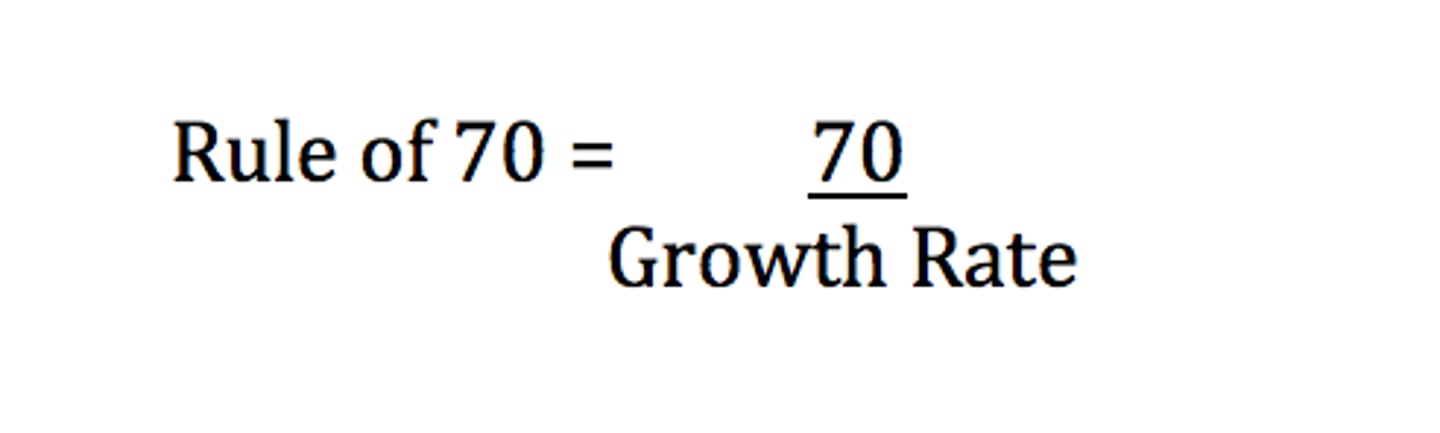
25. Rule of 70
to find doubling time of population, equals 70 divided by the percent growth rate. For example, if a population is growing at 5% annually, it doubles in 14 years; 70/5 -14 years.
26. Life Expectancy
the average number of years a newborn infant can expect to live
• Life Expectancy: 75 years (developed countries); 64 years (developing countries)
• Globally, life expectancy = 48 years (1955), 66 years (1998), 73 years (2025, projected)
• Life expectancy in Africa is less 50 years
27. Crude Birth Rate (CBR)
the number of live births per 1,000 people yearly in a population. Depends on education level and employment of women, cultural expectations, cost of raising a child and availability of birth control
28. Crude Death Rate (CDR)
the number of deaths yearly per 1,000 people in a population. Depends on working conditions, medical care, good nutrition, access to clean water, and general living conditions
29. Total Fertility Rate (TFR)
is an estimate of the average number of children a women will have during her childbearing years; useful for projection population change
• Highest TFR = Africa at 5.3 children per woman
• World TFR around 2.4 children per woman
30. Replacement Level Fertility
the number of children a couple must have to replace themselves (averages 2.1 in developed nations, 2.7 in less developed nations
31. Infant mortality rate
the number of babies out of every 1000 that die within their first year of life. Infant mortality is the single most important measure of a society's quality of life - because it reflects the general level of nutrition and health care
32. The TWO Main Indicators that Illustrate the Quality of Life of a Country are
life expectancy and infant mortality rate
33. Age Structure Diagrams
broad base, rapid growth (African nations); narrow base, negative growth (Japan and some eastern European nations) uniform shape, zero growth (United States) (diagrams 4)

34. Pre-reproductive group
not yet mature enough to reproduce 0 -14 years old
35. Reproductive group
capable of reproduction 15 - 44 years old
36. Post reproductive
beyond their reproductive years. 44 plus years of age
37. Per Capita
average per person; statistic divided by the total population
38. Immigration
the arrival of individuals from outside a population
39. Emigration
the movement of individuals out of a given population
40. Population Change
= (births + immigrations) - (deaths + emigration)
41. Percent Change Formula
= (New - Old) / Old x 100
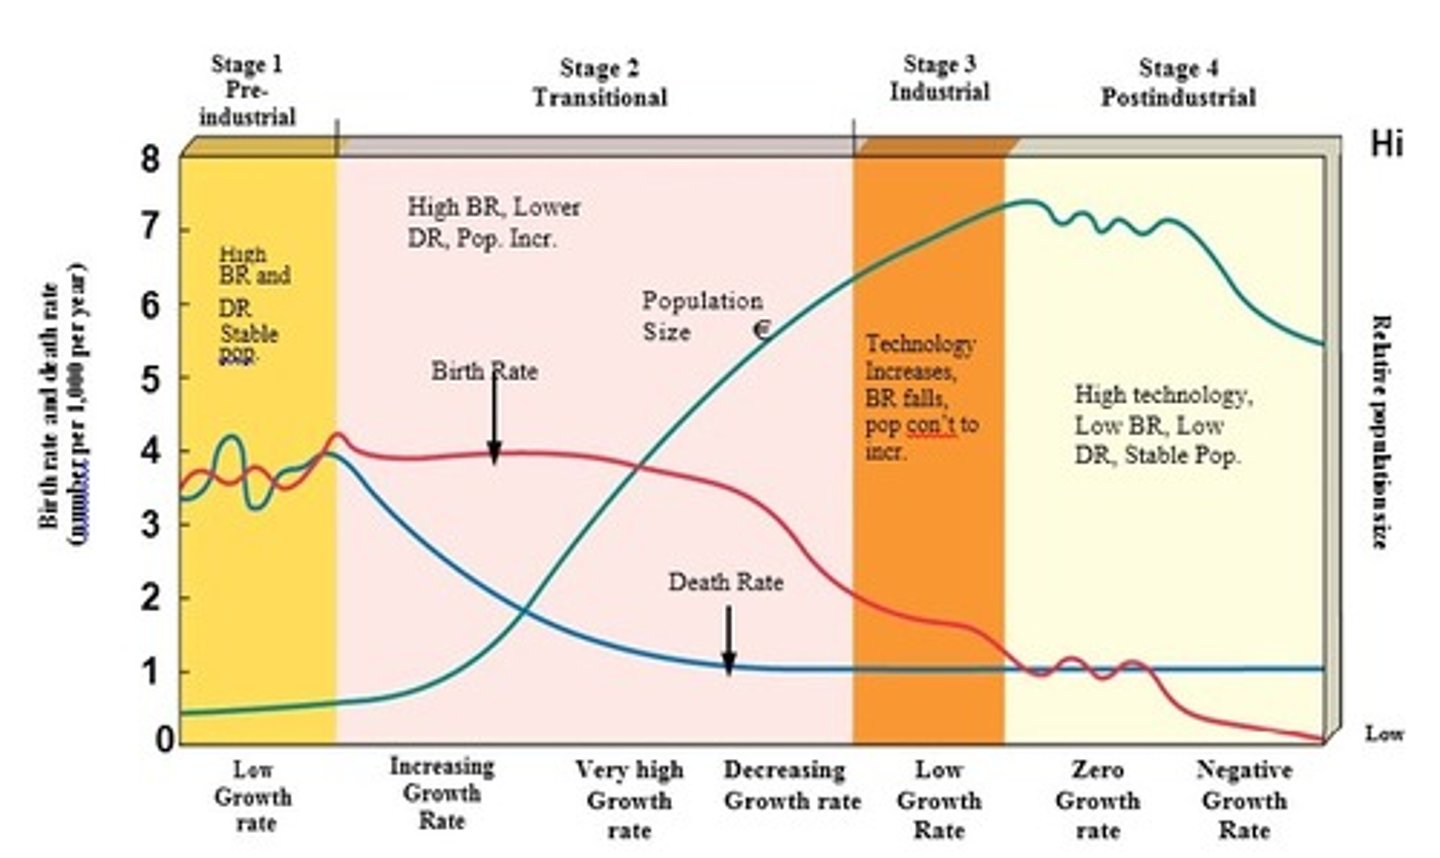
42. Demographic Transition Model
model shows how countries can transition from high birth/death rates to low ones through industrialization (KNOW THIS!)

43. Pre-industrial
1st stage in Demographic Transition Model (stable pop size)
• Harsh living conditions, high infant mortality rates, high death rate; need a high birth rate. Population growth is small (or zero)

44. Early developing (Transitional)
2nd stage in Demographic Transition Model (pop grows rapidly)
• Industrialization begins, rise in food production, improved health care, reduction in death rate, birth rate remains high. Population grows rapidly (2.5-3%/year)

45. Late developing (Industrial)
3rd stage in Demographic Transition Model
• Industrialization is widespread. Birth rate drops and approaches the death rate. Better access to birth control, reduced infant mortality, increased job opportunities for women, high cost of raising children, HS and college educations. Population grows but at a slower rate.

46. Developed (Post Industrial)
4th stage in Demographic Transition Model (stable pop size)
• Birth rate declines further, equals death rate → Zero Population Growth. 37 countries (mostly western Europe, 12% of world's population) are in this stage