Theme 4A - Inequity bruh
1/13
There's no tags or description
Looks like no tags are added yet.
Name | Mastery | Learn | Test | Matching | Spaced | Call with Kai |
|---|
No analytics yet
Send a link to your students to track their progress
14 Terms
State microeconomic objectives of the government
AE
Equity: fairness in the distribution of output among individuals
Fairness is a normative idea (everyone has differing views on what is considered fair)
NOTE: Different between equity and equality
Equality: achieved when every member receives an equal portion
Equity: About whether the item is split fairly
State causes of inequity
In a free market, everyone pays the same price -> different income level lead to different abilities to afford goods or services -> the prices of essential goods and services might be too high -> unaffordable to lower-income groups
The distribution of incomes being too unequal
Explain how does income inequality lead to inequitable distribution of goods and services
Dollar votes: consumers "vote" for the goods and services they want by spending their money -> the more income or savings a person has, the more dollar votes they can cast
In a free market economy, the mix of goods and services reflects the country’s income distribution
Those with high income levels can cast more dollar votes -> causes producers to channel or divert more scarce resources into luxury goods for the rich, and away from goods for the poor -> unfair distribution of resources, as too many scarce resources are used to satisfy the rich, while the poor get too few
Free market does NOT consider fairness in terms of who gets to consume the good (and how much)
Explain widening income inequality a concern
Not a problem
As it is a natural result of the free-market economy and capitalism
These people who believe this, their income does not fall (inflation rate is lower than the growth in nominal income)
Should be a concern
Lower income earners might experience a rise in their overall annual real income over the years, but the relative rate of their increase in real income is likely still much lower than those who are more skilled and educated -> greater income disparity over time
This greater sense of relative poverty creates increased dissatisfaction -> social unrest, higher crime rates and sense of insecurity at work -> undermine the efficiency and the law and order of a country
Not concerned about inequality but bothered by absolute poverty
Believe in redistribution from the rich to the poor to achieve a higher level of social welfare
Define income inequality + total income of country
(Def.): Refers to the extent to which income is distributed in an uneven manner among a population
Total income of country = wage for workers, rent for landowners, interest for capital owners, profits for entrepreneurs
Describe Gini coefficient
The Gini coefficient: measures the degree of inequality in income distribution across a population
Value is between 0 and 1
0 = perfect income equality
Closer it is to 1, the greater is the income inequality within the nation
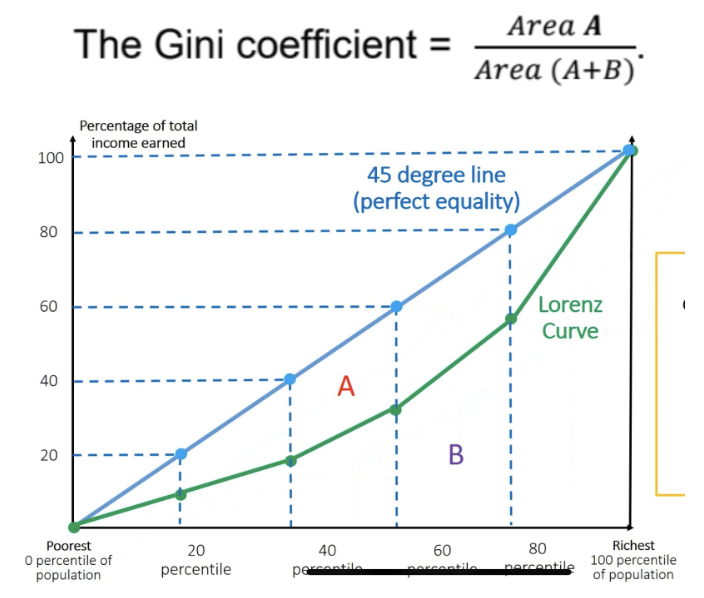
Calculated using Lorenz curve
The Lorenz Curve is a graph showing the cumulative proportion of households
The further the Lorenz Curve is from the 45 degrees total equality line -> larger will be the Gini coefficient -> more uneven the income distribution
LOOK at the axis!
Distance between blue and green = different between ideal and reality
Area A = all the shortfalls between ideal and reality (B is always constant, only A changes)

Explain how to determine level of income inequality using Gini
Compare relative Gini with other countries
If the Gini coefficient of a country is higher than most countries -> higher income inequality
How Gini coefficient changes over time
If the Gini coefficient of a country increases over time -> widening income inequality within a country over time
Describe the causes of income inequality
Unequal factor endowments
Greater wealth inequality means a larger difference between individuals’ starting points (in terms of possessing more or less factors of production) -> greater inequality of income
Households that own moe FOP earn higher income (rent, interest, profit) -> rich provide children with better education + children inherit wealth -> jump-starting the process of wealth accumulation for the next generation
Differences in prices of same FOP
2 people at both workers -> but one may have more skills and training than the other
A highly skilled individual working as a professional is likely to earn more than an unskilled individual working in a menial occupation
Does making income equal solve inequity?
No. Making income equal does not necessarily solve inequity, because inequity is about fairness in access to opportunities, not just equal outcomes
For example, imagine two people earn the same income (one is healthy and lives in a city with good schools and transport, while the other has a disability and lives in a rural area with poor healthcare and few job options)
Even though their income is equal, their ability to succeed and enjoy the same quality of life is not.
True equity means giving each person the support they need based on their situation, not just giving everyone the same amount.
Describe movement along labour demand curve
Market labour demand curve: shows the number of workers that firms are willing and able to hire at different wage rates, ceteris paribus
When the wage rate rises, the MC now exceeds the MB of hiring an additional unit of labour
A profit-maximising firm will lower its employment of labour -> either produce less output or substitute capital (machinery) for labour
Describe causes of shifts in labour demand curve
Change in price of output due to a change in demand for the good
Demand increase -> price increase -> additional revenue that each worker contributes increase -> labour demand increase
Change in labour productivity
Increase in productivity -> rise in output per worker -> increase worker revenue contribution to form
Change in capital productivity
Advancement in tech -> increase productivity of capital -> companies replace workers with machines to reduce MCOP
Describe movement along labour supply curve
Market labour supply curve: shows the number of man-hours that workers are willing and able to hire at different wage rates, ceteris paribus
Increase wage rate -> increase opportunity cost of leisure (income forgone) incentivizes people to work more -> increase quantity of labour hours supplied
Describe causes of shifts in labour supply curve
(Def.): number of people willing and able to work in that country/industry/profession at every wage rate
Causes:
Change in how many people who can become qualified
Affected by government policy
Government increase intake numbers -> supply increase
More price inelastic and there is difficulty in securing time requisite qualifications -> labour supply lower
Change in population demographics
Aging population -> labour supply fall
Change in foreign labour policy
Influx of migrant workers -> high supply of workers in low-skilled industries -> wage rates fall
Eg. In 2022, SG government introduced its Overseas Networks and Expertise (ONE) Pass and other “targeted enhancements” to the country's work pass framework
The five-year work pass allows foreigners earning at least S$30,000 a month to start, operate and work for multiple companies in Singapore at the same time
Change in attractiveness of job rule
Eg. Some people are attracted to join the health care sector as nurses or nursing assistants because of the opportunity to care for others
Long working hours discourage many from joining this profession. If the working conditions could be improved (Eg. shorter shift duration) -> more people willing to join this profession at the same wage rate
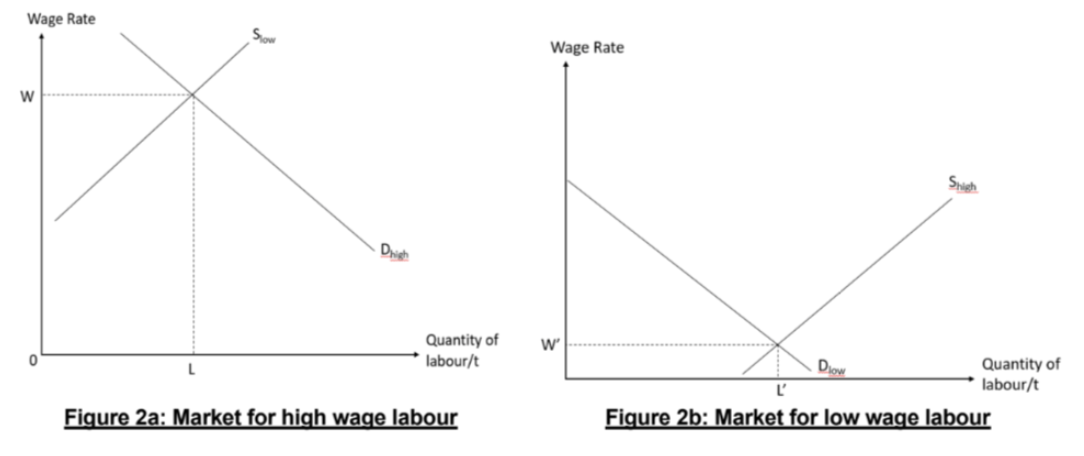
Draw diff types of labour market curves (eg. high demand)
A high market demand and a low market supply of labour will give rise to a higher wage rate for workers in that occupation
Eg. Computer programmers:
High demand: generate high revenue for companies
Low supply: requires extensive knowledge, skills and talent
NOTE: look at the axis! (Wage rate against quantity of labour)
If there were perfect factors of mobility, supply of industries with higher wage rates would rise and supply of labour in industries with lower wage rate would fall as workers move from lower wage rates to more attractive industries with higher wage rate -> wage equality
