3 - representations of data
1/13
There's no tags or description
Looks like no tags are added yet.
Name | Mastery | Learn | Test | Matching | Spaced |
|---|
No study sessions yet.
14 Terms
what is an outlier
an extreme value in a set of data
general formula to find outliers
LOWER OUTLIER:
less than Q1 - k(IQR)
UPPER OUTLIER:
greater than Q3 + k(IQR)
k is often 1.5, but in the question they will lyk what to use as k
method of finding outliers using standard deviation
outlier boundaries generally lie ± 2 standard deviations from the mean
the ‘2’ number can also vary from question to question, so they will lyk
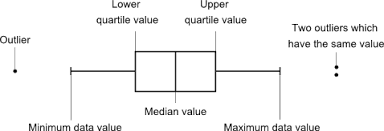
what is a box plot
aka box and whisker plot
diagram used to represent key features of a data set
useful for comparing data
how to draw a box plot
box with lines for lower quartile, median and upper quartile
whiskers reaching to smallest and largest value WITHIN OUTLIER BOUNDARIES
crosses (in the picture its dots but draw crosses) outside the diagram = outliers
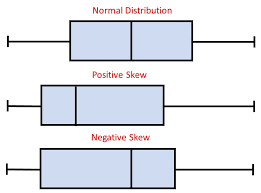
how to find skew from box plots
ignore whiskers - only look at the central box
what does a cumulative frequency graph look like
points plotted against the upper class boundary of the group (“by the end of this group, we have...”)
0cf point plotted at the lower class boundary of the first group (basically the lowest recorded value)
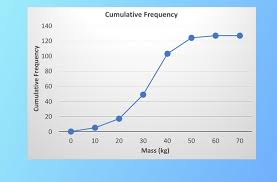
things you can find with cumulative frequency graphs
median value, UQ value, LQ value, values of any percentiles
for median, go 50% of the way up the y axis then follow it along and the corresponding x value is the answer
same goes for UQ (75%) and LQ (25%) and any percentiles (use the given percentage)
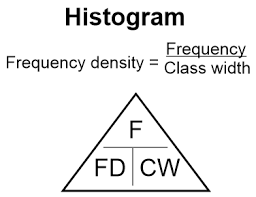
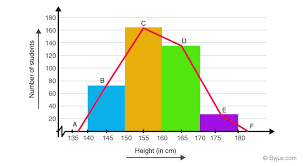
what are histograms used for
to represent grouped continuous data
histogram formula
area is directly proportional to frequency on the graph
how to draw a frequency polygon
join the midpoints of each bar on the histogram with straight lines
what to do if there are gaps in your histogram
use true class boundaries
how to compare data
no. of marks on the question = no. of statements you should make:
one about an average (mean, median)
one about spread (range, IQR, SD)
one about skew
and give a therefore - eg. “therefore the red team are more consistent”
(underlined means should be used with box plot comparisons)
out of mean, median, SD and IQR, what differentiates them
affected by extremes:
mean
SD
not affected by extremes:
median
IQR