STOR 155 - Normal Distribution, Geometric Distribution, & Binomial Distribution
1/14
Earn XP
Description and Tags
From Lecture 12,13, & 14
Name | Mastery | Learn | Test | Matching | Spaced | Call with Kai |
|---|
No analytics yet
Send a link to your students to track their progress
15 Terms
Continuous random variable
a random variable that takes an uncountable number of possible values within a given range, often represented by intervals on the real number line.
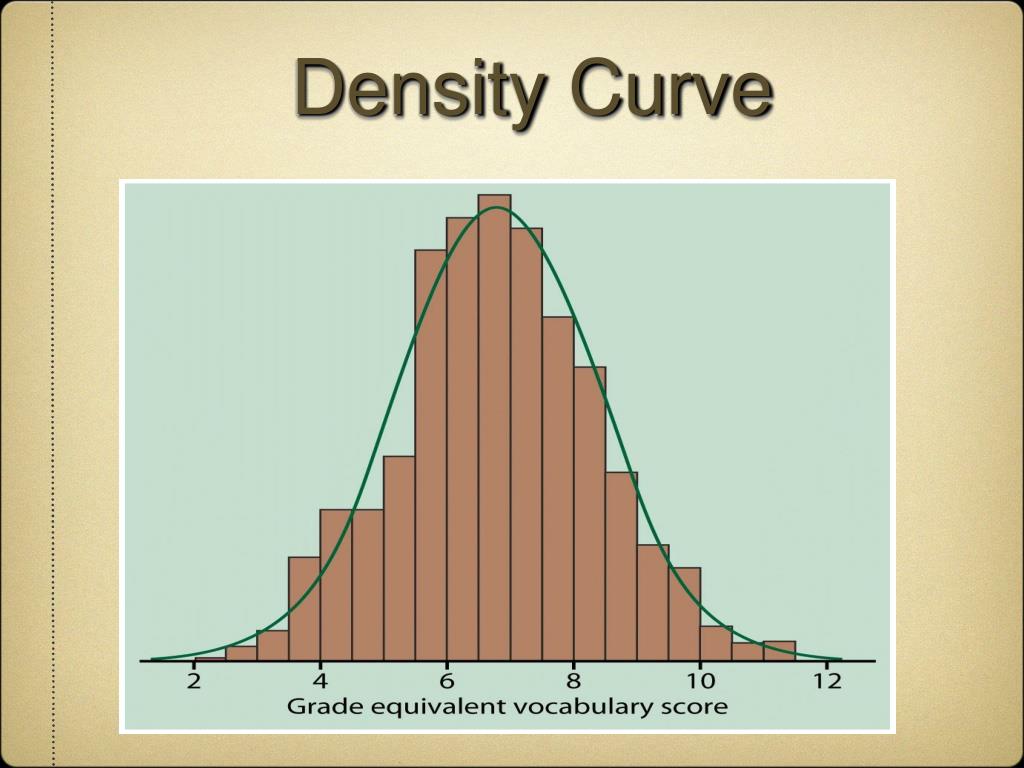
Density Curve
a mathematical model describing the limiting histogram for a variable when the population is large and the bin width is small. A small rule for density curve is that the area under the curve must be 1.

Median
The “equal area point”, i.e. the point on the x-axis where 0.5 of the area is to the left and 0.5 of the area is to the right.
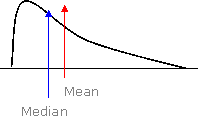
Mean
The “balance point” is where the total area under the curve is evenly distributed on either side.
Normal Density Curve
It’s a bell-shaped curve representing a normal distribution, characterized by its mean and standard deviation.
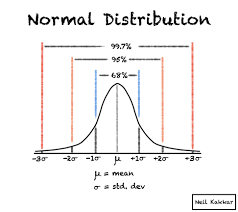
68-95-99.7 Rule
A rule stating that for a normal distribution, approximately 68% of the data falls within one standard deviation of the mean, 95% within two standard deviations, and 99.7% within three standard deviations.
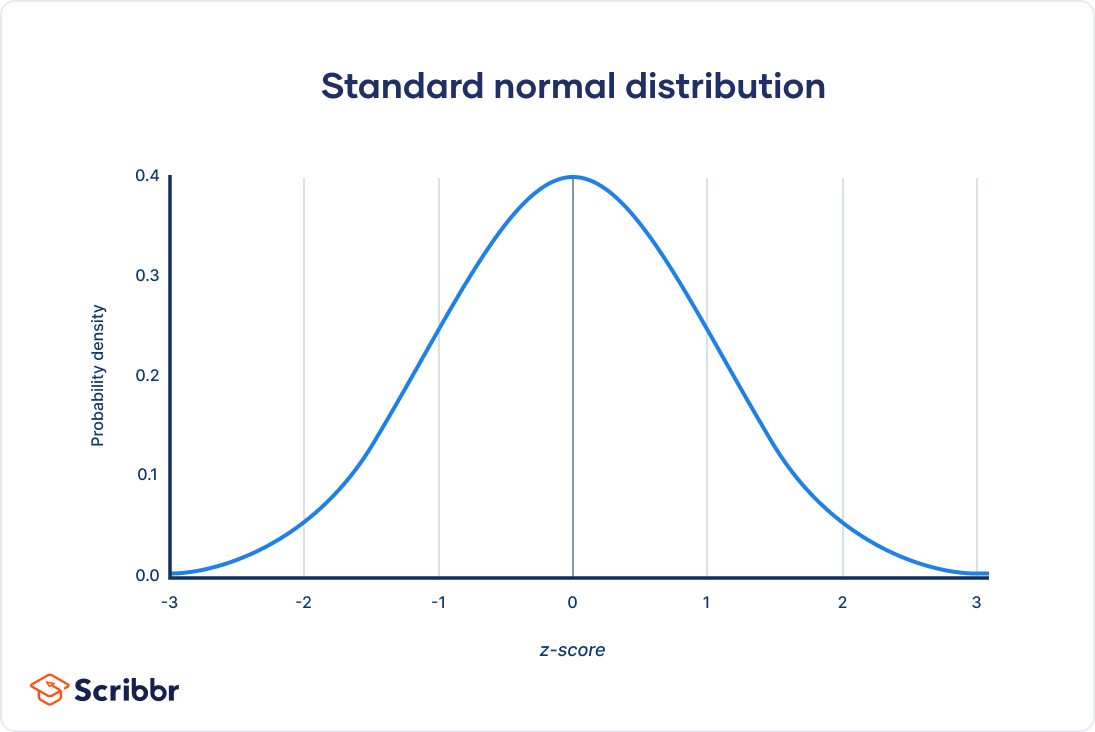
Standard Normal Density Curve
A special case of the normal density curve with a mean of 0 and a standard deviation of 1, is used for standardization of normal distributions.
Z-score
It tells you how many standard deviations the observation is above (+) or below (-) the mean
Bernoulli Distribution
It is a random phenomenon with two possible outcomes: success or failure. Success occurs with some fixed probability (p).
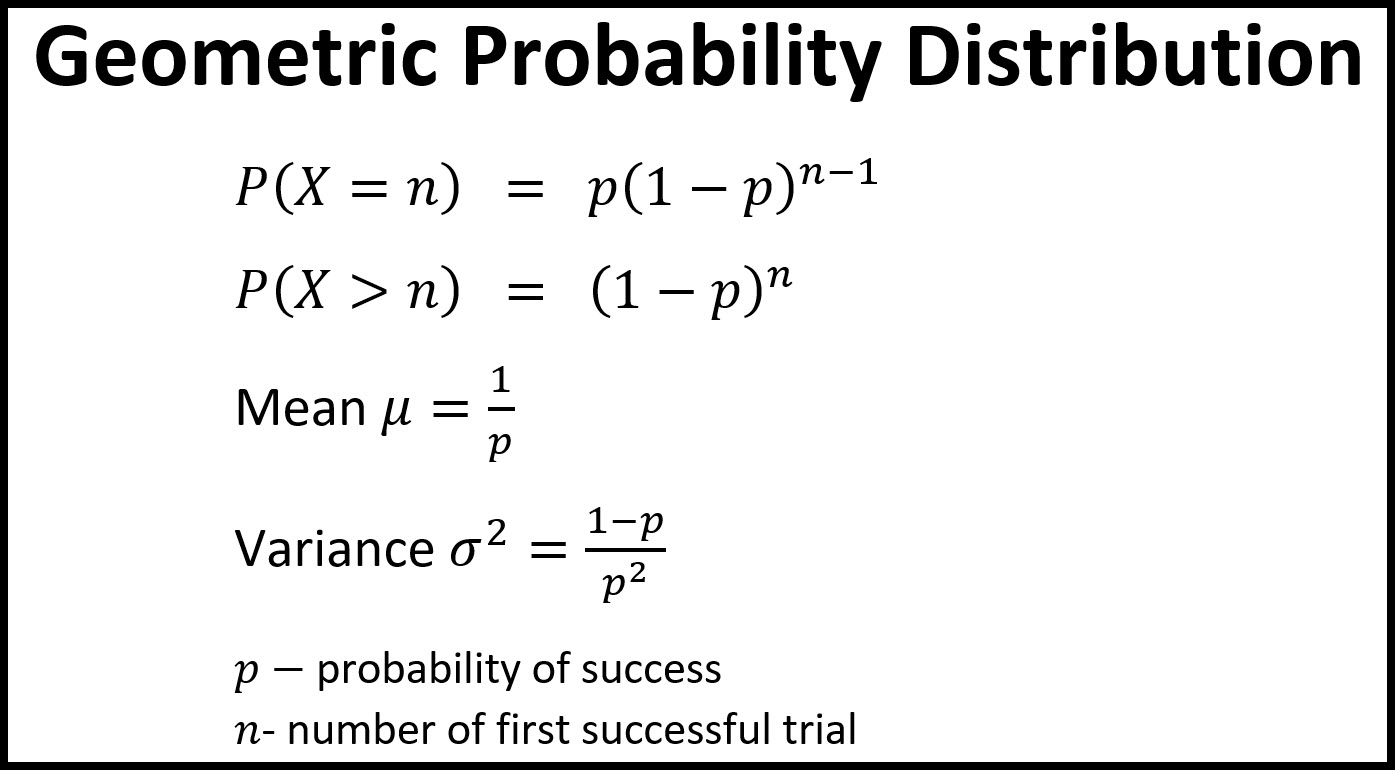
Geometric Distribution
The number of independent Bernoulli trials needed to observe the 1st success when all trials have success probability (p). The notation for this is X~Geo(p)
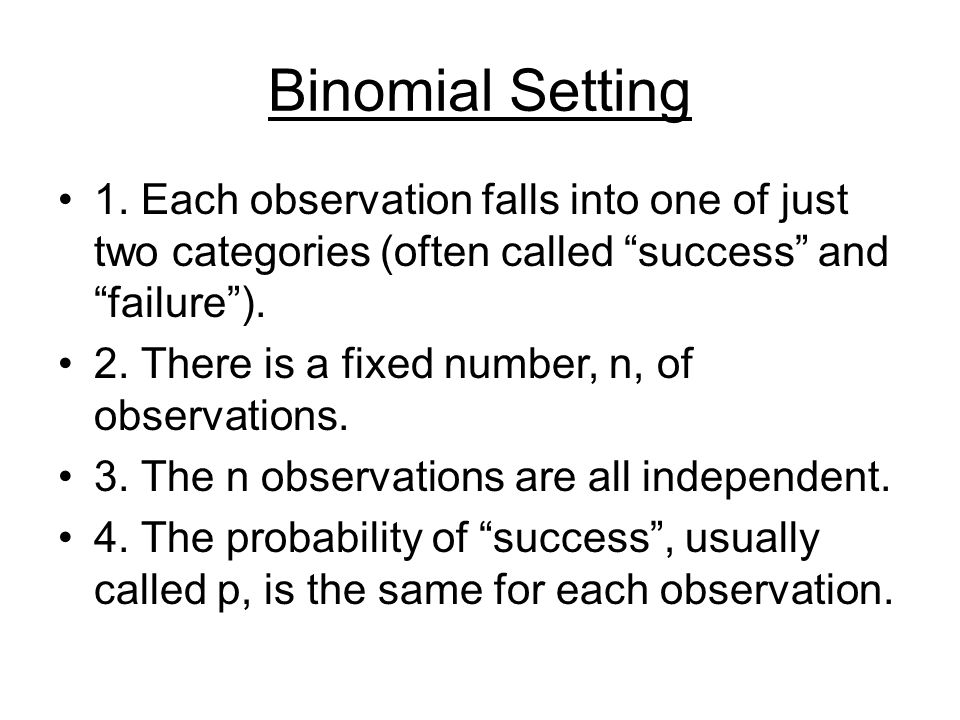
The Binomial setting
If the X= # of successes, X has a binomial distribution with parameters n & p. The notation for this is X~Bin(n,p)
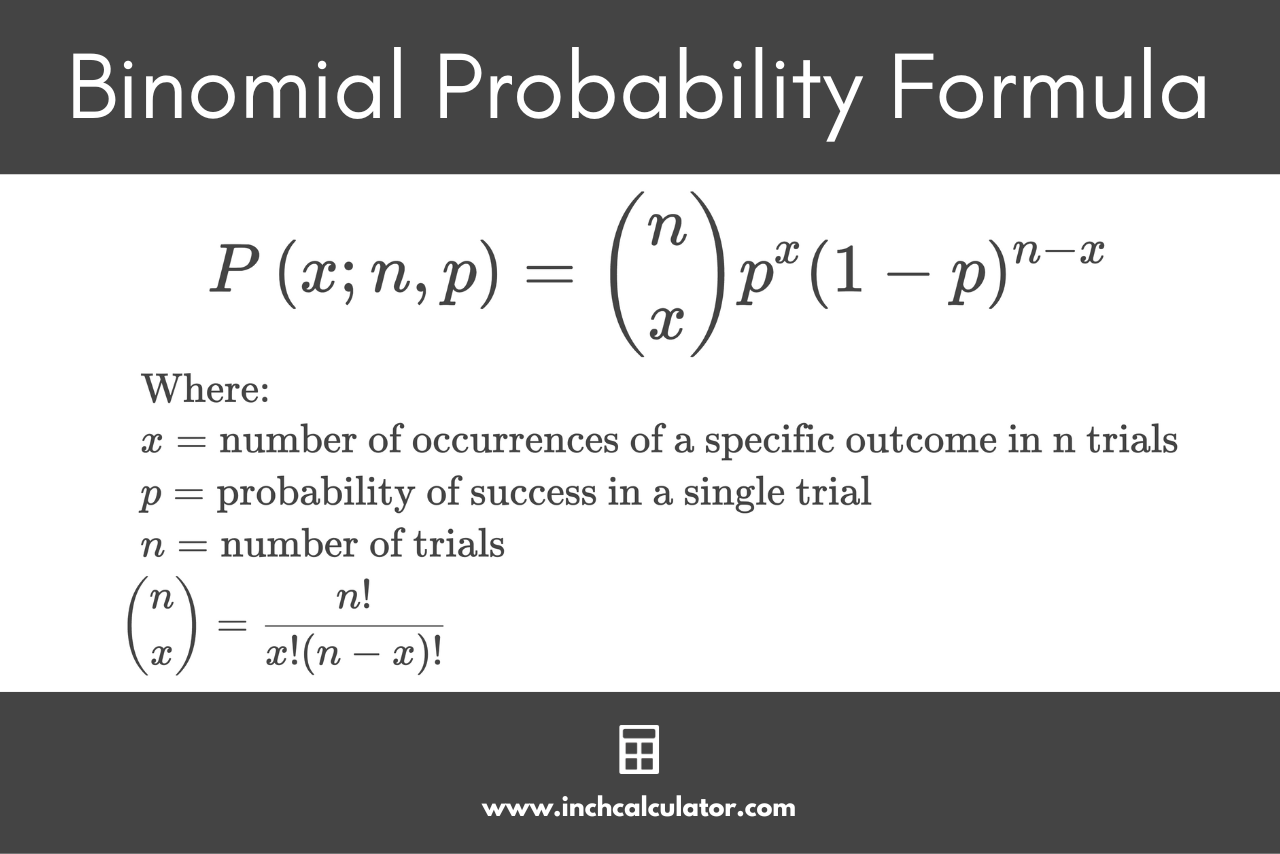
Binomial Distribution
The 2 common uses for it: 1. N independent replications of an experiment with two possible outcomes 2. sampling n individuals independently from a large population with proportion (p) classified as success.
Mean and variance for a binomial random variable
What is the connection between binomial & normal distributions?
As the # of trials n becomes large, the associated binomial is well-approximated by a normal distribution.
Bin~(n,p) = N(np, sqrt of np(1-p))
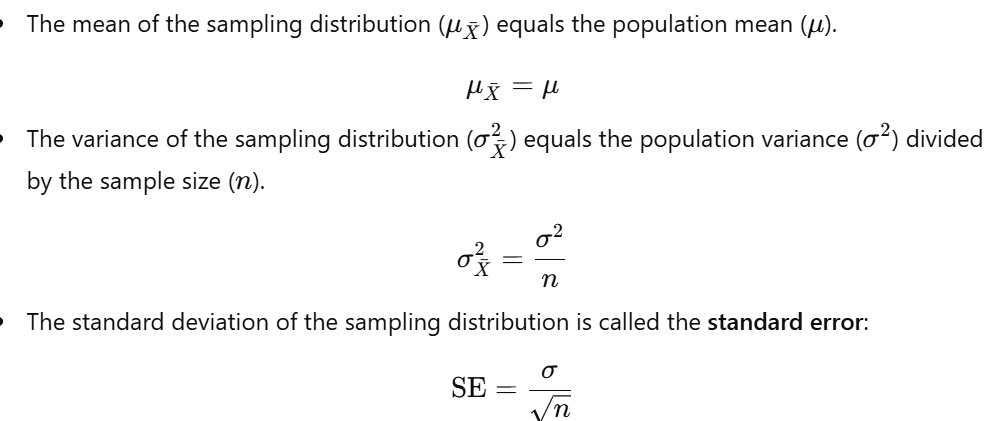
The central limit theorem
Regardless of the population’s distribution, the sampling distribution of the sample mean will approach a normal distribution as the sample size (n) becomes large, provided its independent and identically distributecd.