IB Economics: 2.11
1/43
There's no tags or description
Looks like no tags are added yet.
Name | Mastery | Learn | Test | Matching | Spaced |
|---|
No study sessions yet.
44 Terms
Characteristics of a market structure
- Market Power (price-controlling ability)
- Product differentiation
- Barriers to entry
TR
P x Q
MR
ΔTR / ΔQ
Explicit Cost
A payment made by a firm to an outsider to aquire an input.
Implicit Cost
The income sacrificed by a firm that uses a resource it owns (basically an opportunity cost)
Total Cost
Explicit + Implicit Costs
MC
ΔTC / ΔQ
Profit
TR - TC
AC
TC / Q
Normal Profit
TR = TC
Abnormal Profit
TR > TC
Loss / -ve Economic Profits
TR < TC
Characteristics of perfect competition
1. Large number of firms in the industry
2. All the firms sell a homogenous or identical product
3. No barriers to entry and exit to/from the industry.
Price-takers in perfect competition
Because there are many substitutes, the demand curve for a good in a perfectly-competitive market is perfectly inelastic.
This means the firm has no ability to influence the price, therefore has no market power.
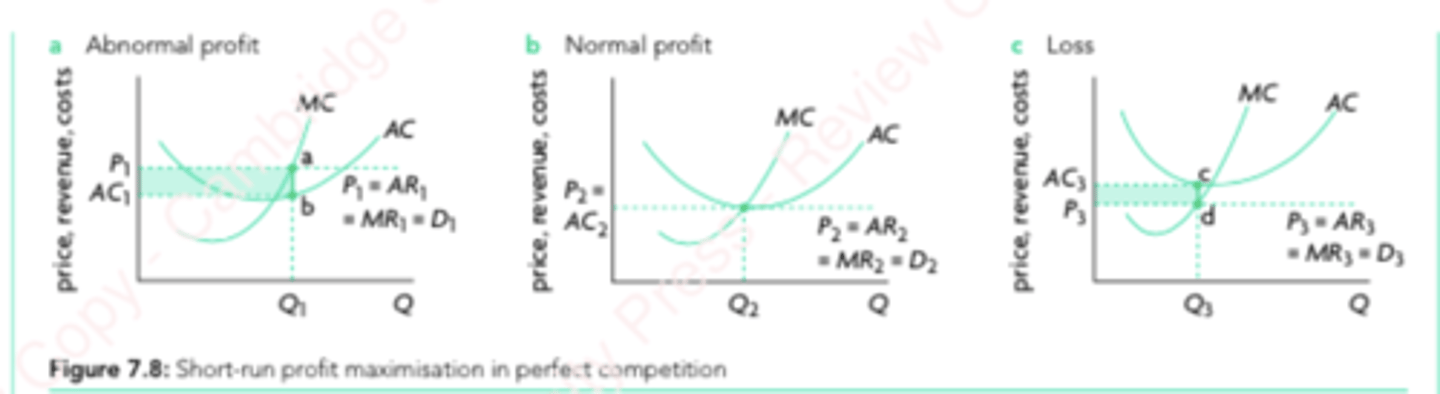
Profit in the short run vs long run in perfect competition
In the short run, firms can make abnormal profits or losses. This changes the state of the market, as firms may enter or leave the market.
If firms leave the market (when making losses), the market supply reduces and prices increase. Firms make normal profits.
If firms enter the market (when making abnormal profits), the market supply increases and prices reduce. Firms make normal profits.
Therefore, in the long run, firms only make normal profits.
Benefits of perfect competition
Allocative Efficiency
Low prices for consumers
Competition leads to the closing down of inefficient producers
Market responds to consumer tastes
Criticisms of perfect competition
Unrealistic
Cannot take advantage of economies of scale
Lack of product variety
Limited ability to engage in new product development
Perfect Competition Graphs
Output and Price are MC = MR
AR = MR = D curve is perfectly elastic
MC intersects AC at its lowest point
Placement of AC curve above/below AR = MR curve gives profit type.
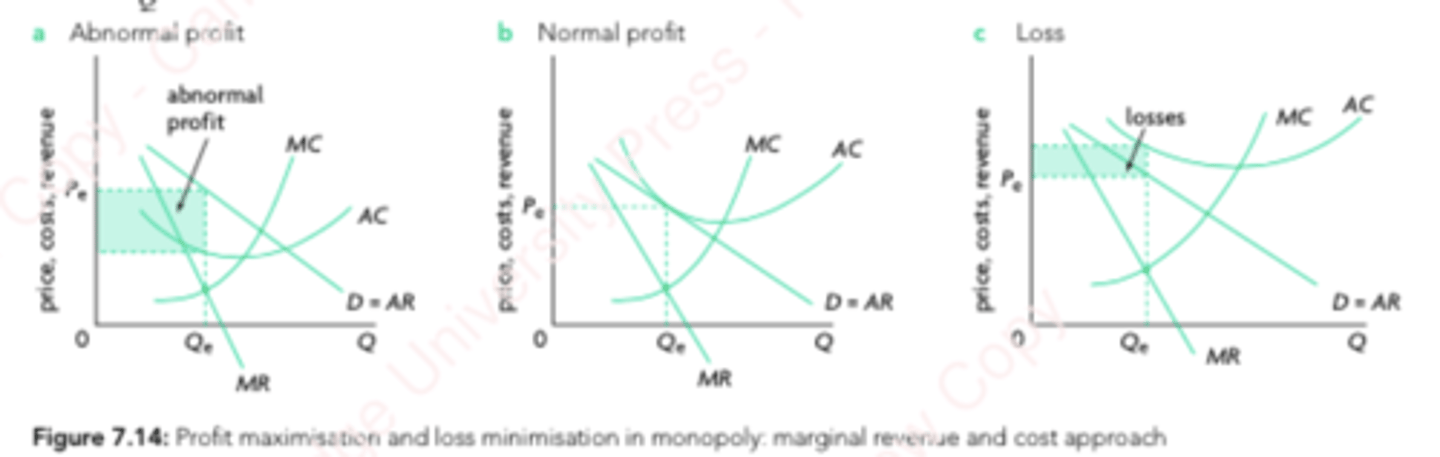
Characteristics of Monopoly
Single/dominant firm in the industry
A unique good/service is sold, with no close substitutes
High barriers to entry, which restricts other firms from entering the market.
Barriers to Entry
Natural Monopoly
Economies of scale
Branding
Legal Barriers (patents, licenses, copyrights, tariffs/quotas)
Control of essential resources
Aggressive tactics
Benefits of Monopoly
Economies of scale
Likely to engage in research development for product development and technological innovation
Criticisms of Monopoly
Welfare loss and allocative inefficiency
Higher price and lower output
Loss of consumer surplus
Negative impacts on the distribution of income
Lack of competition may result in higher costs and less product development
(No incentive to efficiency or innovation)
Monopoly Graphs
Output is when MC = MR
Price is read from that level of output but from AR curve
MC intersects AC at its lowest point
Placement of AC curve above/below AR = MR curve gives profit type.
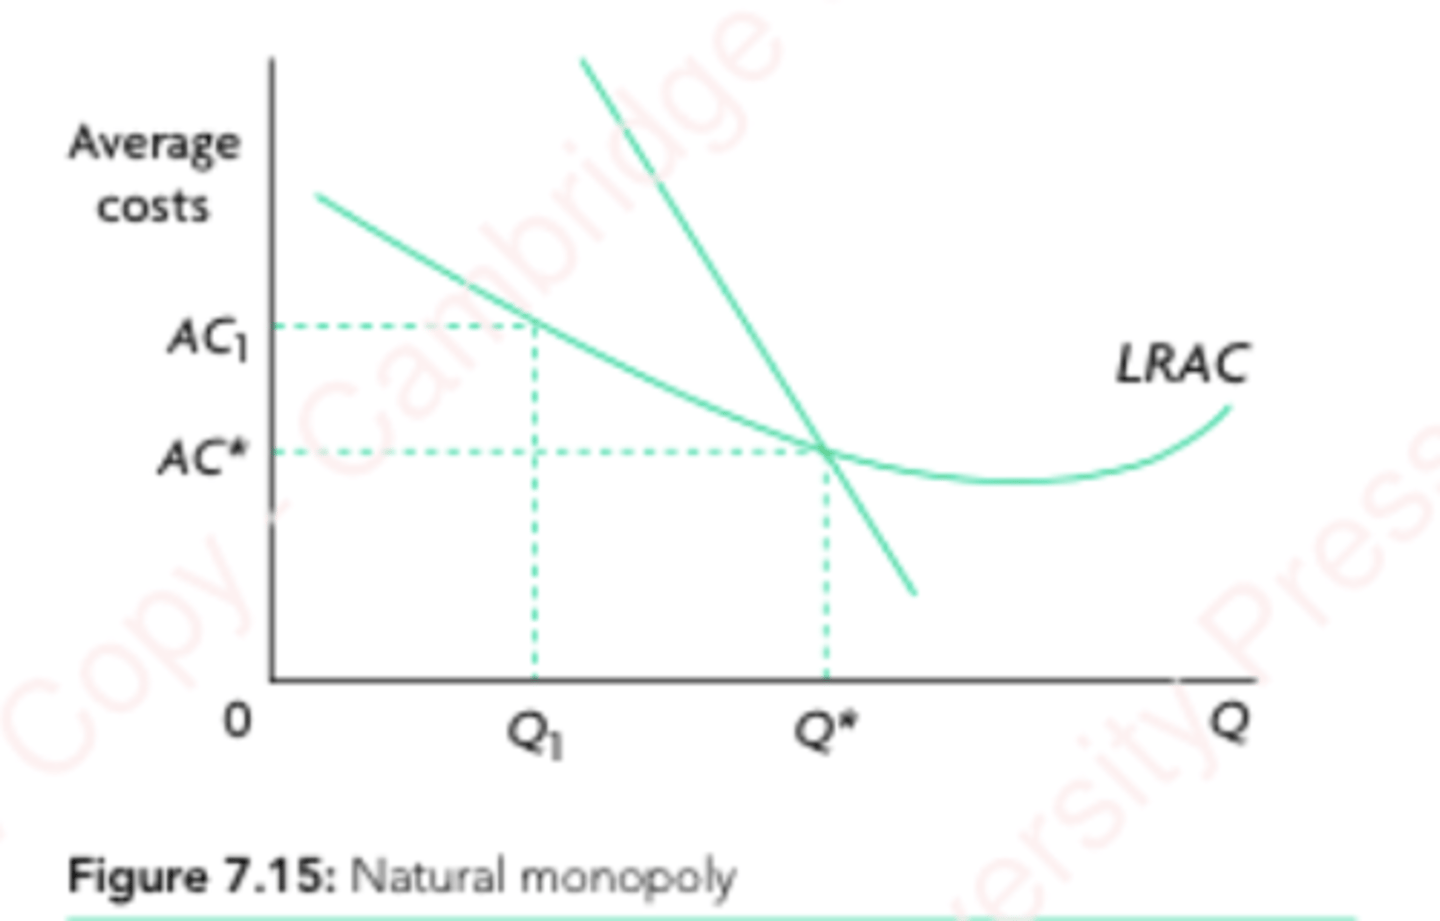
Natural Monopoly
Operate in a market with high fixed costs (railways, telecom, utilities).
Lot of potential for economies of scale
Competition is undesirable because it is rational for one firm to supply the entire market. There will be duplication of resources and not exploitation of full economies of scale.
Natural Monopoly graph
LRAC curve is shaped like first half of economies of scale (because natural monopolies exploit economies of scale).
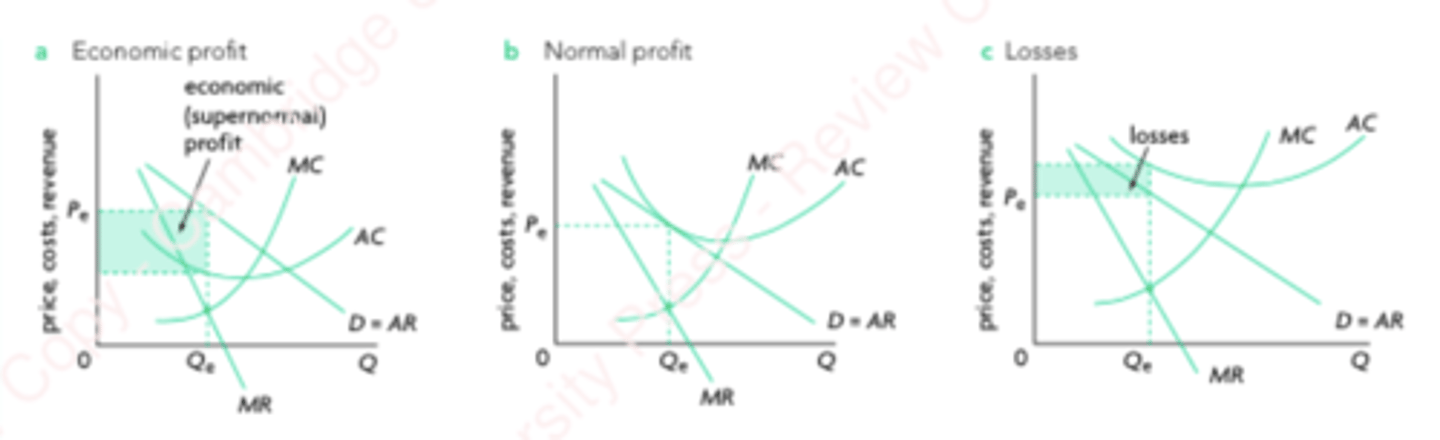
Characteristics of Monopolistic Competition
Fairly large number of small/medium-sized firms in the industry
Low barriers to entry
There is product differentiation
Product Differentiation in Monopolistic Competition
Physical differences
Quality differences
Services
Product image
Profit in the short run vs long run in monopolistic competitiion
In the short run, firms can make abnormal profits or losses. This changes the state of the market, as firms may enter or leave the market.
If firms leave the market (when making losses), the market supply reduces and prices increase. Firms make normal profits.
If firms enter the market (when making abnormal profits), the market supply increases and prices reduce. Firms make normal profits.
Therefore, in the long run, firms only make normal profits.
Monopolistic Competition Graphs
Output is when MC = MR
Price is read from that level of output but from AR curve
MC intersects AC at its lowest point
Placement of AC curve above/below AR = MR curve gives profit type.
AR and MR curves are less steep than monopoly in monopolistic competition due to higher elasticity. But they are not as steep as in perfect competition.
Characteristics of Oligopoly
Small number of large firms in the industry.
Firms are interdependent, so the actions of one affect the others.
Products may be either differentiated or not
Non-price competition
High barriers to entry
Interdependence in oligopoly
Can be used for strategic behaviour by making changes based on those of your competitors'
Conflicting incentives may result in collusion, competition/cheat.
Collusion
Agreement between firms to limit competition between them, usually by fixing price and lowering quantity produced.
Non-price competition
Product development
Advertising
Branding
Customer services
Warranty
Credit, discounts, upgrades, etc.
Game theory and nash equilibrium
Shows that there is sometimes a conflict between the pursuit of individual self-interest and the collective firm interest. This is the prisoner's dilemma. Although they could be better by cooperating, each firm, trying to make itself better off, ends up making both itself and its rival worse off.
Collusive Oligopoly
Firms agree to collude - to limit competition, increase market power and profits.
Cartel
Formal agreement to take actions to limit competition, increase market power and profits.
E.g. OPEC
There can be difficulties due to number of firms and cost differences that may lead to price wars.
Non-collusive oligopoly
Firms are independent but follow each others' actions strategically. However, no collusion may lead to price rigidity.
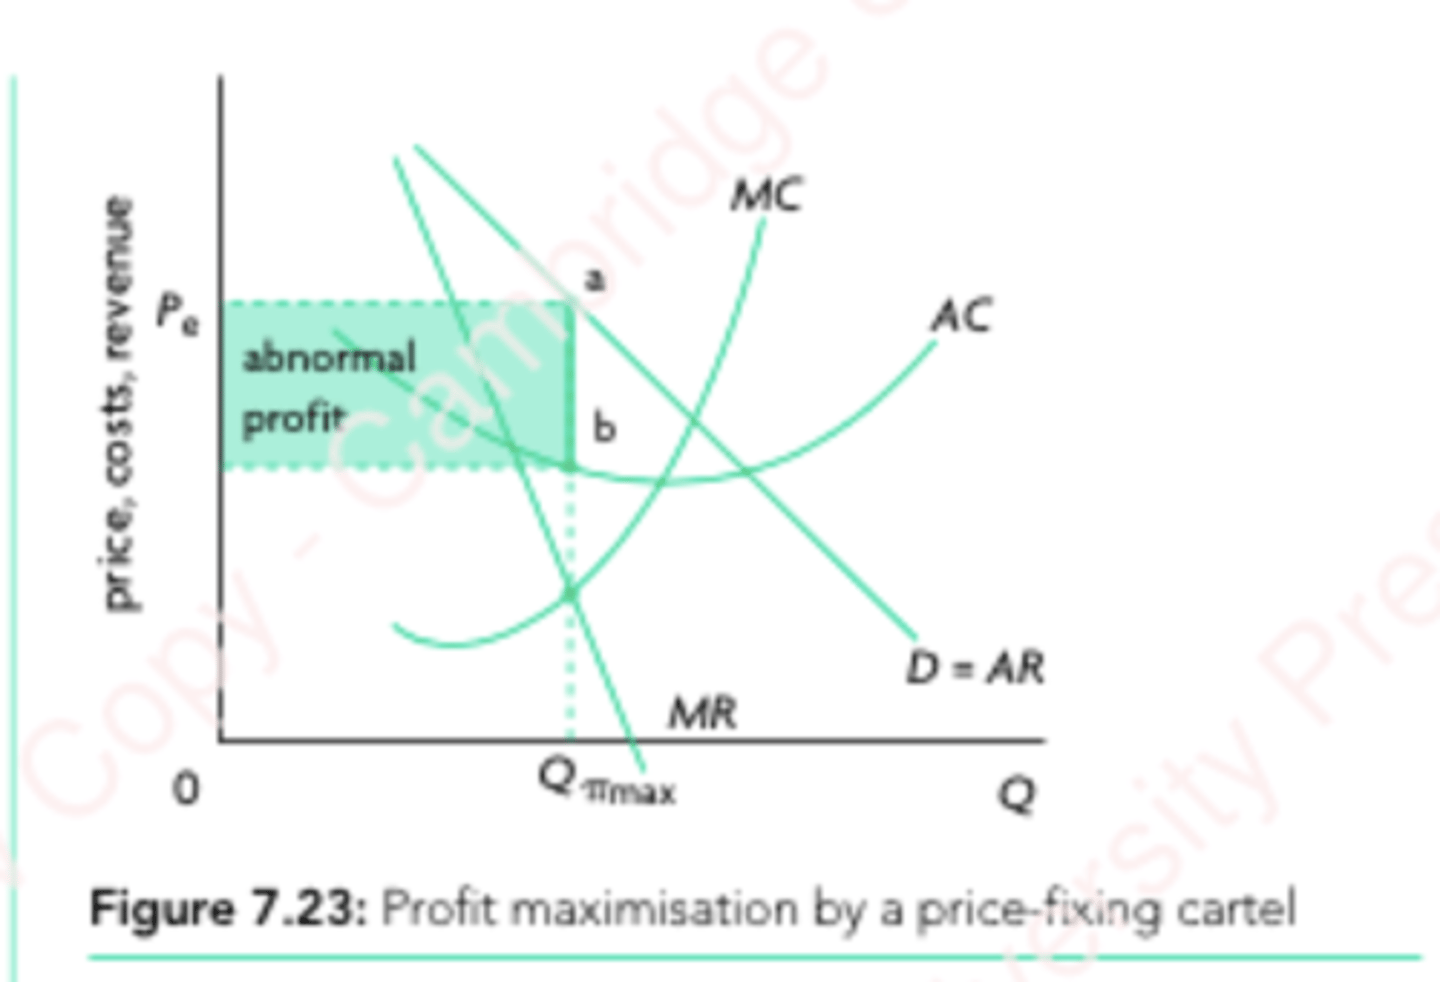
Collusive oligopoly graph
Benefits of Oligopoly
Economies of scale can be achieved due to the large size of the Product development and technological innovations can be pursued due to high abnormal profits
Product development leads to increased product variety.
Criticisms of Oligopoly
Allocative inefficiency
Negative impacts on distribution of income
Price rigidity
Collusion
Profit-maximizing level of output
MR = MC
Revenue Maximizing Level of Output
MR = 0
Allocative Efficiency
P = MC
or MC = AR
Productive Efficiency
MC = AC (lowest point on the AC Curve)