2.1 VOCAB AP STATS
1/3
There's no tags or description
Looks like no tags are added yet.
Name | Mastery | Learn | Test | Matching | Spaced | Call with Kai |
|---|
No analytics yet
Send a link to your students to track their progress
4 Terms
Percentile
the pth percentile of a distribution is the value with p% of observations less than or equal to it
Ex: If my BMI is at 45th percentile; then 45% of girls my age have a BMI that is less than or equal ti mine
If one is at the 100th percentile then basically they are higher than everyone else
Ex: If my MCAT score is at the 100th percentile, then 100% of MCAT test takers have a score that is less than or equal to mine; but no one has more
If one is at the 0th percentile, then basically they are lower than everyone else
Ex: If I am at the 0th percentile for cancer risk, then 0% of people have a risk that is lower than or equal to mine
25th percentile: Q1
50th percentile: Median
75% percentile: Q3
ALWAYS START AT 0
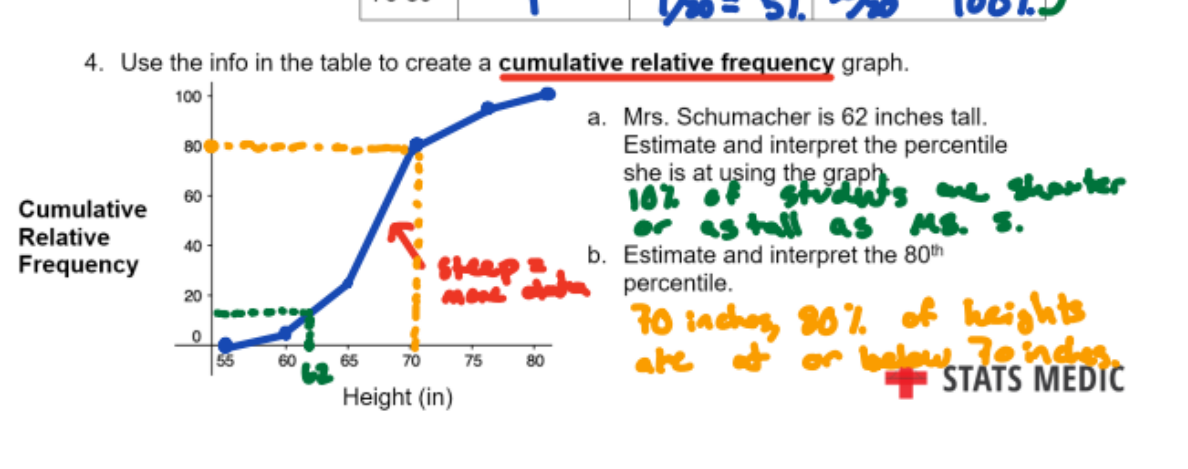
Cumulative Relative Frequency Graph
plots a point corresponding to the percentile of a given value in a distribution of quantitative data. Consecutive points are then connected with a line segment to form the graph
Baiscally; steep means that like more ppl fall in that range
Flat means less people fall in that range
Standardized score (Z score)
The standardized score (z score) for an individual value in a distribution tells us how many SD from the mean the value falls, and in what direction. To find the standardized score (z score) compute:
Z = value - mean/ SD
Ex: If the test avg as a 80% and I got 75% and the SD was 5 then I would do
(75 - 80)/5 = -1
REMEMBER; always do the value 1st and the mean 2nd
NEGATIVES DO MATTER
filler
filler