Exploring Data
 Call Kai
 Learn
Learn Practice Test
 Spaced Repetition
 Match
Match Flashcards
 Knowt Play
1/22

There's no tags or description
Looks like no tags are added yet.
Name | Mastery | Learn | Test | Matching | Spaced | Call with Kai | Chat |
|---|
No analytics yet
Send a link to your students to track their progress
23 Terms
2 ways to explore data
summarising
tabular or numerically (descriptive statistics)
displaying
graphically (boxplots, histograms, bar charts, scatterplots)
frequency table
describes data by showing the number of objects / events for each data category
contingency tables
two-way or multi-way frequency tables to summerise the relationship between 2 or more categorical variables
descriptive statistics includes
measures of central tendency
mean, median, mode
measures of dispersion
range, quartiles, variance, standard deviation
mean
average
x
adding all numbers in a set of values and dividing by total number of cases
median
middle value in an ordered set of values
useful to know when extreme values are present to find midpoint
mode
value that occurs most frequently
can have more than one mode in a dataset
no mode when all items occur the same number of times
range
the difference between the largest and smallest observations in the dataset
quartiles
three points that divide the data into 4 groups
Q1- lower quartile or 25th percentile
Q2 - sample median or 50th percentile
Q3- upper quartile or 75th percentile
interquartile range
IQR = Q3 - Q1
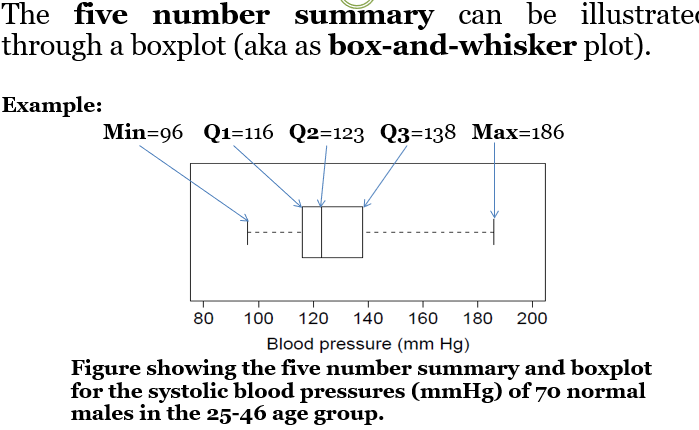
5-number summary
5 values (minimum, Q1, Q2, Q3, maximum) provide a numerical summary of a set of data called the 5 number summary
variance and SD
these related measures give the idea of variability by calculating the extent to which each observation deviates from the mean
SD calculation
the standard deviation is the square root of the variance and is most used when reporting results
how is variance calculated
the difference between each data point and the mean is calculated, but the average of all the deviations cannot be used since negative values will cancel out the positive ones
hence, the differences are squared, then summed up and divided by the number of cases to obtain the variance
variance
how spread out a set of numbers is from its average value (the mean)
small variance means data points are close to the mean
large variance means the numbers are spread far apart
SD
measures data variability around the mean of a sample of the population
SE
Indicates the indicates the precision of the estimated mean of a population
always smaller than the SD
boxplot
normal distribution
symmetrical around midpoint
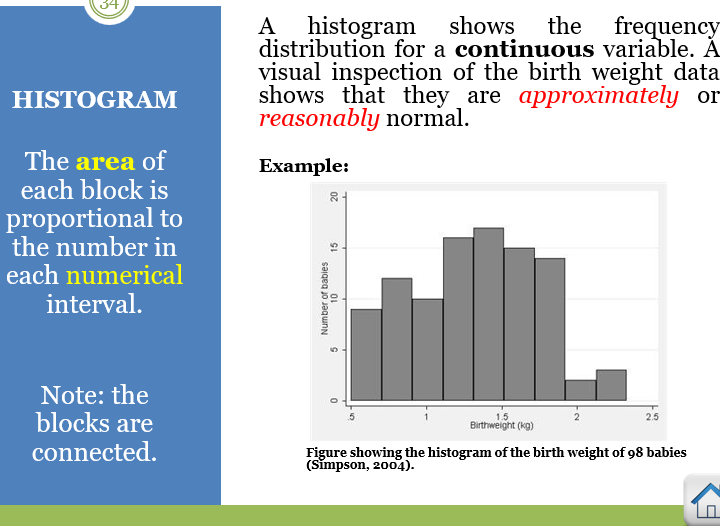
bell shaped (histogram)
required for accurate stats representation
histogram
scatterplot
useful for examining relationship between 2 continuous variables
bar chart
used for categorical variables
height = size of group
scatterplot relationships
linear
strong (clustered points) or weak (scattered points)
positive (increase y and x axis) or negative