Disease Gene Mapping
1/53
There's no tags or description
Looks like no tags are added yet.
Name | Mastery | Learn | Test | Matching | Spaced | Call with Kai |
|---|
No analytics yet
Send a link to your students to track their progress
54 Terms
What is disease gene mapping and why is it important?
Disease gene mapping identifies the genomic regions and genes responsible for diseases. It helps understand disease mechanisms, enables molecular diagnosis, guides genetic counselling, and can reveal new targets for treatment.
How does disease gene mapping differ for rare and common diseases?
Rare diseases (<1 in 2,000): Usually caused by single-gene (monogenic) mutations. Harder to diagnose (“diagnostic odyssey”). Require specialist care.
Common diseases (>1 in 2,000): Usually polygenic (involving many small-effect variants). Easier to diagnose but have higher public health impact.
Both can be mapped genetically to uncover molecular causes.
Define monogenic and polygenic disease.
Monogenic: Caused by mutation in a single gene (e.g. cystic fibrosis, sickle cell anaemia).
Polygenic: Caused by variants in multiple genes plus environmental factors (e.g. diabetes, hypertension).
What are the key genetic concepts underlying disease gene mapping?
Genetic variation
Homologous recombination
Independent assortment
Allele frequencies
These determine how genes and variants are inherited and distributed across populations.
What is genetic variation and the effects?
Differences in DNA sequences between individuals in a population. They can be inherited or arise from environmental causes (e.g. radiation, drugs).
Effects:
Alters protein function (e.g. missense mutations)
Affects gene regulation (when/where/how a gene is expressed)
Influences phenotype (observable traits and disease risk)
Can also be silent (no effect on phenotype)
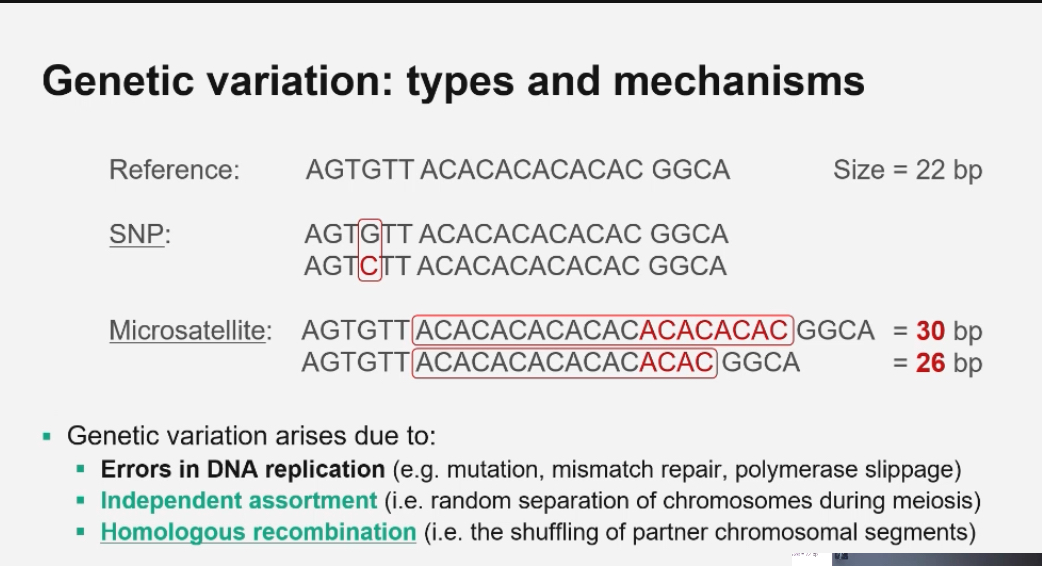
What are the main mechanisms creating genetic variation?
1. DNA replication errors → mutations, polymerase slippage
2. Independent assortment → random distribution of chromosomes during meiosis
3. Homologous recombination → exchange of chromosome segments between homologous chromosomes
What is homologous recombination?
It’s the reciprocal exchange of DNA segments between homologous chromosomes during meiosis, producing new allele combinations.
Normal (allelic) homologous crossing over
Occurs during meiosis I.
Homologous chromosomes align correctly (gene-for-gene, same loci).
Crossing over happens between non-sister chromatids.
DNA exchange occurs at the same locus on both chromosomes (allelic).
The exchange is reciprocal and equal (same length of DNA swapped).
No DNA is gained or lost.
Result: recombinant chromatids with new allele combinations but normal copy number (1 copy).
Purpose: increase genetic diversity without changing chromosome structure.
Non-allelic homologous recombination (NAHR)
Also occurs during meiosis I.
Chromosomes contain repetitive DNA sequences along its lemgth
Repetitive sequences cause misalignment when a repeat at one locus on one homologous chromosome aligns with an identical repeat at a different locus on the other homologous chromosome, leading to DNA exchange between non-allelic positions.
The repeats themselves are not the problem.
The problem is the DNA between the repeats → this is called intervening DNA.
That intervening DNA often contains genes.
When repeats misalign and crossing over happens:
the intervening DNA gets duplicated on one chromatid,
and deleted on the other.
That’s what causes copy number variation (CNVs) and disease.
Crossing over still occurs between homologous sequences, but they are non-allelic.
The exchange is reciprocal but unequal (different lengths of DNA swapped).
Outcome:
One chromatid gets extra repeats → duplication (2 copies).
The other loses repeats → deletion (0 copies).
DNA is not actively copied; imbalance comes from unequal exchange.
Result: copy number variation (CNVs) that can cause disease.
What is the difference between a mutation and a polymorphism?
Mutation: A rare DNA variant (low population frequency).
Polymorphism: A common variant (≥1% frequency).
Both represent DNA changes compared to the reference sequence, but frequency distinguishes them.
What is Minor Allele Frequency (MAF)?
The frequency of the less common allele in a population.
MAF < 1% = mutation
MAF ≥ 1% = polymorphism
MAF helps determine if a variant is rare or common and varies across populations.
Example of allele frequencies (APOE rs7412 C>T variant):
C (major allele): 67%
T (minor allele): 33%
Minor allele frequency (MAF) = 0.33
What does “allele frequency” mean? + Why does allele frequency vary across populations?
It’s the proportion of a particular allele among all copies of a gene in a population.
Because of genetic drift, founder effects, natural selection, migration, and differences in ancestry.
What is the relationship between allele frequency and effect size in disease?
Rare alleles → larger effect sizes (cause monogenic disorders)
Common alleles → smaller effects (contribute to complex traits)
Effect size quantifies the impact of a genetic variant on a particular trait or disease risk
What is meant by ‘mapping’ a disease gene?
We know what disease causing genes/gene were looking for but how do we find the position?
It’s the process of identifying the chromosomal location of a gene responsible for a disease, using methods like:
linkage analysis(in families)
or GWAS(in populations)
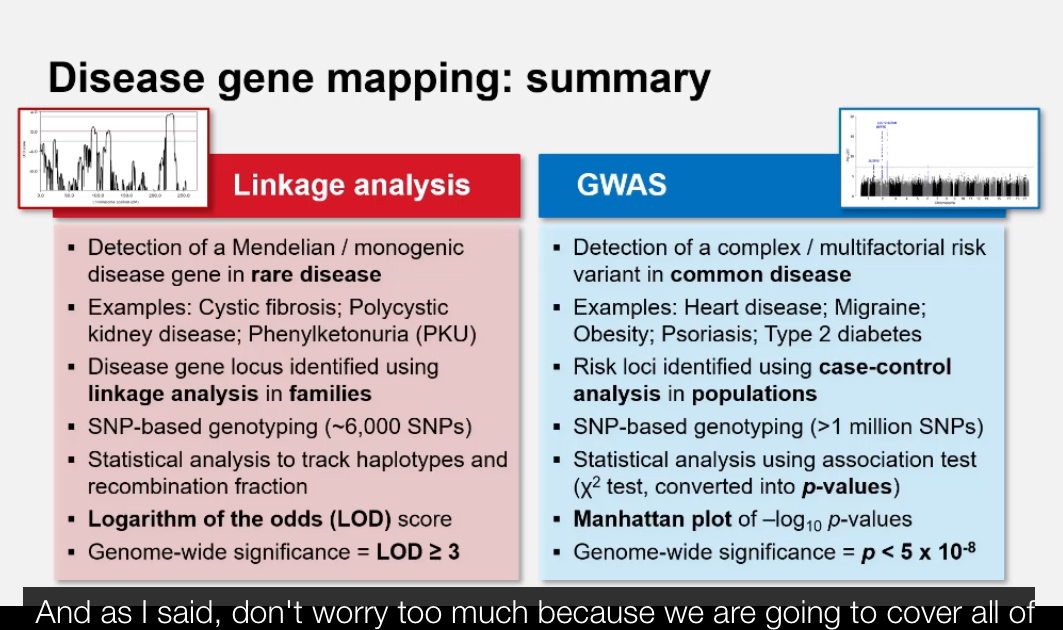
What are the two main approaches used to map disease genes? + Why do we need different mapping approaches for rare vs. common diseases?
1. Linkage Analysis: Tracks inheritance of disease alleles within families (for rare diseases).
2. Genome-Wide Association Studies (GWAS): Compares variant frequencies between unrelated cases and controls (for common diseases).
Rare diseases have strong single-gene effects → family-based linkage analysis works best.
Common diseases have small multi-gene effects → require population-based GWAS to detect associations.
What is meant by genetic linkage?
Linkage: refers to assumption of 2 things being physically linked together
Genetic linkage: refers to the tendency of genes or DNA markers that are physically close together on the same chromosome to be inherited together during meiosis because crossing-over is less likely to occur between them.
You have a pair of homologous chromosomes:
one chromosome inherited from mum,
the matching chromosome inherited from dad.
These homologs contain the same genes in the same order (same loci), but can have different alleles.
Example haplotypes (allele combinations along one chromosome):
Mum: A₁ — B₁
Dad: A₂ — B₂
During meiosis I, mum’s and dad’s homologs pair up.
The cell’s recombination machinery can create a crossover (swap) between non-sister chromatids of the homologs.
The key question: Does the crossover happen in the DNA between gene A and gene B?
If A and B are close together:
crossover rarely happens between them
so A₁ tends to stay with B₁ (and A₂ stays with B₂)
→ you mostly see parental combinations in gametes
→ strong linkage (low recombination frequency)
If A and B are far apart:
crossover often happens between them
so you often make recombinants (e.g., A₁—B₂ and A₂—B₁)
→ genes don’t look linked
→ weak linkage (high recombination frequency)
Recombination frequency is used as a measure of linkage:
low recombination chromosomes % = strong linkage
high recombination chromosomes % = weak/no linkage
Quick clarity: gene vs allele (your question)
A gene = a DNA region at a specific locus (position) on a chromosome.
Alleles = the different versions of that gene on the mum vs dad homologs.
if you look at that locus across the pair, you’re comparing mum allele vs dad allele.
Haplotype
Example
Two genes close together: Gene A and Gene B
Mum’s chromosome:
A₁ — B₁ → one haplotypeDad’s chromosome:
A₂ — B₂ → a different haplotype
Each chromosome = one haplotype.
How this links to recombination
During meiosis:
No crossover between A and B → haplotype stays intact
→ A₁—B₁ passed together.Crossover between A and B → haplotype breaks
→ new haplotypes form (e.g. A₁—B₂).
Linked genes → stable haplotypes
Unlinked genes → haplotypes break often
Haplotype vs genotype (quick contrast)
Genotype:
all alleles across both chromosomes
e.g. A₁/A₂ and B₁/B₂
Haplotype:
alleles on one chromosome only
e.g. A₁—B₁
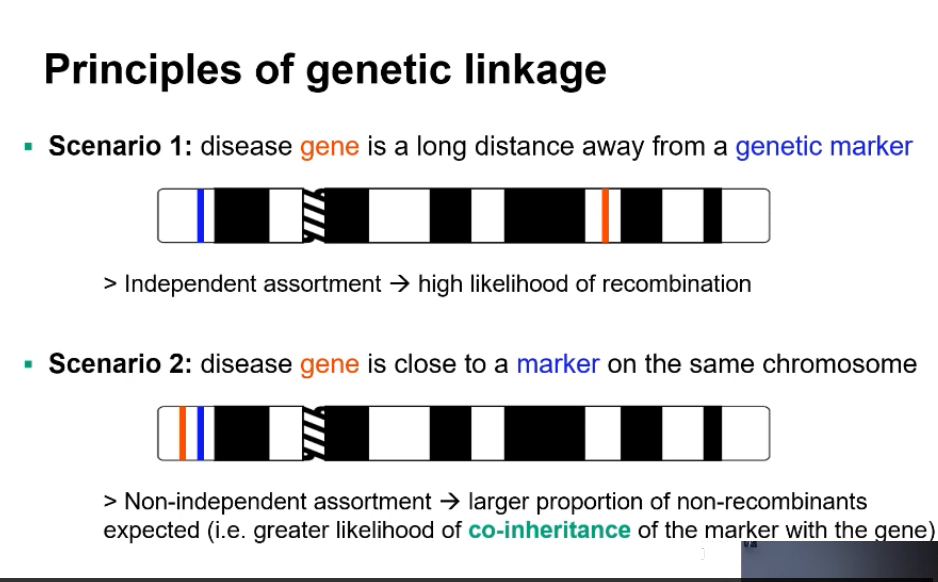
Linkage analysis: Describe the two scenarios that illustrate linkage principles.
Linkage analysis
What actually changes / why it matters (cause first)
Linkage analysis uses recombination to locate a disease gene.
The key signal is whether a disease allele stays inherited with a nearby genetic marker from mum or dad.
Low recombination between a marker and the disease means they are physically close on the same chromosome.
Step-by-step explanation (with mum + dad chromosomes)
Start with a family (pedigree) where a disease is inherited.
Choose genetic markers (e.g. SNPs, microsatellites) whose chromosome locations are known.
Each person has:
one chromosome from mum,
one chromosome from dad.
Track which marker alleles and which disease allele each child inherited.
Ask the key question:
Did the disease allele come from the same parental chromosome as the marker allele?
During meiosis in the parent:
if no crossover occurs between the marker and disease gene →
they are passed on together (linked).if a crossover occurs between them →
the marker and disease separate (recombinant).
Count how often recombination occurs across many meioses.
How results are interpreted
Low recombination frequency
marker and disease usually inherited together
→ strong linkage
→ disease gene is close to that marker
High recombination frequency
marker and disease often separate
→ weak or no linkage
→ disease gene is far from that marker or on another chromosome
Recombination frequency is converted to genetic distance:
~1% recombination ≈ 1 centimorgan (cM)
What linkage analysis is vs is not
✔ Uses families/pedigrees
✔ Best for rare, inherited disorders
✔ Maps genes based on co-inheritance
❌ Does not identify the exact mutation
❌ Lower resolution than modern association studies
Disease gene far from marker → High recombination frequency → Independent assortment.
Disease gene near marker → Low recombination → Co-inheritance (non-recombinants dominate).
Mapping genes based on co-inheritance means identifying the chromosomal location of a disease gene by observing whether it is consistently inherited together with known genetic markers in families, with rare recombination indicating close physical proximity on the chromosome.
By testing many markers, you can:
• narrow down the region of the chromosome where the disease gene must be.
• You’re not finding the exact base change yet —
you’re finding the neighbourhood.
• Recombination frequency tells you distance:
• low recombination → close,
• high recombination → far.
What is a recombinant vs. non-recombinant?
Recombinant: Offspring chromosome that has undergone crossing-over between marker and disease gene.
Non-recombinant: No crossover occurred; the marker and gene stayed together.
How is linkage analysis conducted (basic workflow)?
Genotype multiple markers (microsatellites or SNPs) across the genome.
Collect DNA from multiple family members with the trait.
Identify markers that co-segregate with disease in affected relatives.
Markers consistently inherited with the disease pinpoint a candidate genomic region for the causal gene.
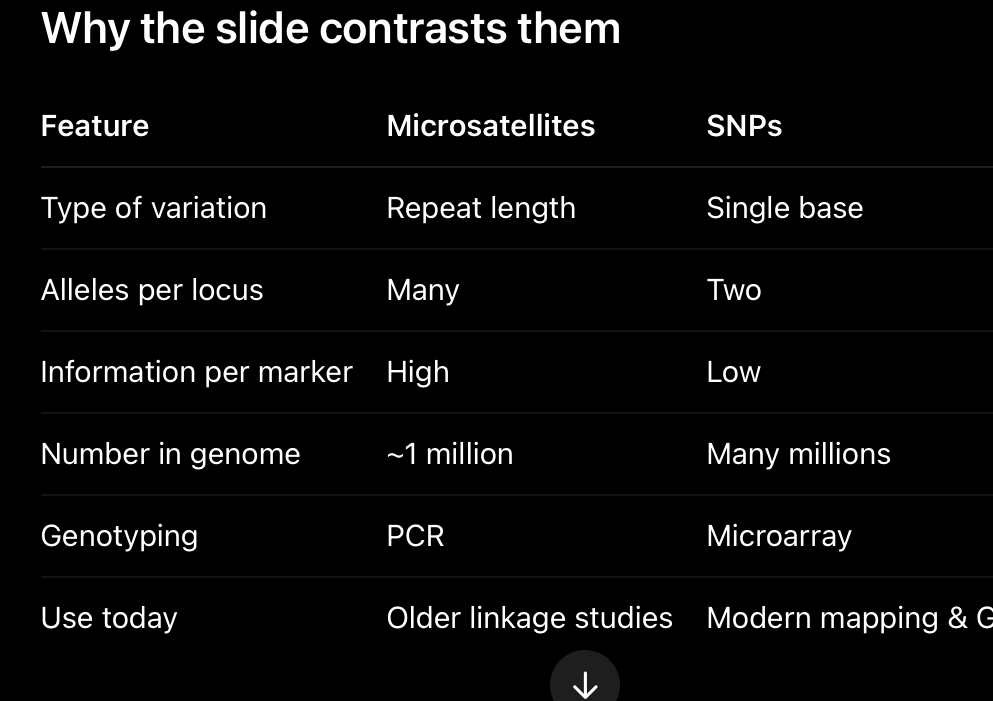
What are genetic markers?
Known, heritable DNA sequence variants used to track inheritance. Two main types:
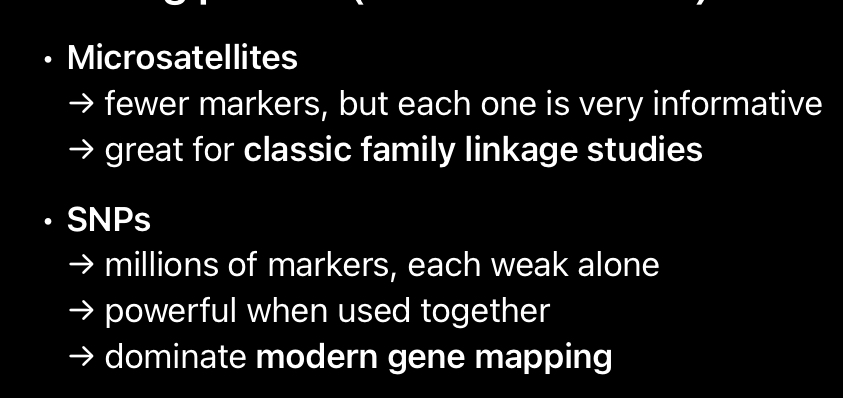
Microsatellites (short tandem repeats, STRs)
Single Nucleotide Polymorphisms (SNPs)
Microsatellites are ideal for family-based linkage analysis because of their variability, whereas SNPs are preferred for genome-wide mapping and association studies because of their abundance and ease of automated genotyping.
What are microsatellites?
Short tandem repeats of 1–6 bp sequences (e.g. (CA)ₙ, (TAT)ₙ, (GATA)ₙ).
Highly polymorphic → many allele sizes.
Detected using fluorescently-labelled PCR primers and capillary electrophoresis.
Commonly used in family-based linkage mapping due to high variability.
Different people have different numbers of repeats.
Example:
Person 1: (CA)₁₀
Person 2: (CA)₁₄
Same locus, different lengths = different alleles.
Why they’re useful
Highly polymorphic:
many possible alleles at one locus in a population as everyone has different repeat lengths so some DNA may be longer in others)
This makes them very informative in families
easy to tell which allele came from mum vs dad.
How they’re genotyped (important)
Use PCR:
primers flank the repeat
—> A microsatellite looks like this on the chromosome:[ unique DNA ] — (CA)(CA)(CA)(CA) — [ unique DNA ]
—>The repeat sequence itself varies in length between people.
• But the DNA either side of the repeat is constant (same in everyone).one primer binds upstream of the repeat, the other binds downstream of the repeat.
The PCR product length tells you: how many repeats are present.
After PCR, we need to see and measure the DNA fragments.
Fluorescent labels make the PCR products visible to machines.
A fluorescent label is a small dye molecule attached to:
• one of the PCR primers (usually at the 5′ end).
During PCR:
every copied DNA fragment includes that labelled primer.
After PCR:
the DNA fragments glow when hit with a specific light.
• Machines (capillary electrophoresis) detect:
• colour (which marker),
• fragment length (which allele).
size measured on a gel or capillary.
Downsides:
labour-intensive,
slower,
fewer markers genome-wide.
Key properties
Multi-allelic (many alleles)
Widely spaced (~1 million in genome)
High information per marker
Manual / PCR-based
Named like: D7S820
D = DNA
7 = chromosome 7
S = single-copy sequence
![<p>Short tandem repeats of 1–6 bp sequences (e.g. (CA)ₙ, (TAT)ₙ, (GATA)ₙ).</p><p class="p1">Highly polymorphic → many allele sizes.</p><p class="p1">Detected using fluorescently-labelled PCR primers and capillary electrophoresis.</p><p class="p1">Commonly used in family-based linkage mapping due to high variability.</p><p></p><ul><li><p><span>Different people have different numbers of repeats.</span></p></li></ul><p><span>Example:</span></p><ul><li><p><span>Person 1: (CA)₁₀</span></p></li><li><p><span>Person 2: (CA)₁₄</span></p></li></ul><p><span>Same locus, different lengths = different alleles.</span></p><p></p><p><span><strong>Why they’re useful</strong></span></p><ul><li><p><span>Highly polymorphic:</span></p><ul><li><p><span>many possible alleles at one locus in a population as everyone has different repeat lengths so some DNA may be longer in others)</span></p></li></ul></li></ul><ul><li><p><span>This makes them very informative in families</span></p><ul><li><p><span>easy to tell which allele came from mum vs dad.</span></p></li></ul></li></ul><p></p><p><span><strong>How they’re genotyped (important)</strong></span></p><ul><li><p><span>Use PCR:</span></p></li><li><p><span>primers flank the repeat</span></p></li></ul><p>—> <span>A microsatellite looks like this on the chromosome:</span>[ unique DNA ] — (CA)(CA)(CA)(CA) — [ unique DNA ]</p><p>—>The repeat sequence itself varies in length between people.</p><p> </p><p>• But the DNA either side of the repeat is constant (same in everyone).one primer binds upstream of the repeat, the other binds downstream of the repeat.</p><p></p><p><span>The PCR product length tells you: how many repeats are present.</span></p><p></p><ul><li><p>After PCR, we need to see and measure the DNA fragments.</p><p> </p></li><li><p>Fluorescent labels make the PCR products visible to machines.</p><p>A fluorescent label is a small dye molecule attached to:</p><p>• one of the PCR primers (usually at the 5′ end).</p><p></p></li><li><p>During PCR:</p></li><li><p>every copied DNA fragment includes that labelled primer.</p><p> </p></li><li><p>After PCR:</p></li><li><p>the DNA fragments glow when hit with a specific light.</p><p> • Machines (capillary electrophoresis) detect:</p><p> • colour (which marker),</p><p> • fragment length (which allele).</p><p><span> </span></p></li><li><p><span> size measured on a gel or capillary.</span></p></li><li><p><span>Downsides:</span></p><ul><li><p><span>labour-intensive,</span></p></li><li><p><span>slower,</span></p></li><li><p><span>fewer markers genome-wide.</span></p></li></ul></li></ul><p></p><p><span><strong>Key properties </strong></span></p><ul><li><p><span>Multi-allelic (many alleles)</span></p></li><li><p><span>Widely spaced (~1 million in genome)</span></p></li><li><p><span>High information per marker</span></p></li><li><p><span>Manual / PCR-based</span></p></li><li><p><span>Named like: D7S820</span></p><ul><li><p><span>D = DNA</span></p></li><li><p><span>7 = chromosome 7</span></p></li><li><p><span>S = single-copy sequence</span></p></li></ul></li></ul><p></p><p></p><p></p>](https://knowt-user-attachments.s3.amazonaws.com/397d32d0-3a0e-49e7-9688-dd768903f2bf.jpg)
What are SNPs (Single Nucleotide Polymorphisms)?
DNA variants at a single nucleotide position (e.g. C→T).
A single base change at one position.
• Example:
• C → T
• A → G
• At a given SNP, most people have only two alleles.
Example:
• Allele 1: A
• Allele 2: G
This is why SNPs are biallelic.
Why they’re useful
• They are extremely common:
• millions across the genome.
• Even though each SNP is less informative on its own,
lots of SNPs together give high resolution.
How they’re genotyped
• Usually via microarrays:
• probes fixed to a chip,
• DNA binds if complementary.
• Fully automated:
• fast,
• scalable,
• cheap per SNP.
Key properties
• Biallelic (2 alleles)
• Very densely spaced
• Lower info per marker
• Automated genotyping
• Named like: rs123456
What does “genome coverage” mean in linkage studies?
It refers to how evenly genetic markers span the genome.
Example: CIDR microsatellite panel vs. Affymetrix 10k SNP array show regions covered vs. gaps (centromeres/telomeres).
What are the steps for building a haplotype in a pedigree? + What is the “critical disease interval”?
List genotypes for each marker in family members.
Deduce which allele each parent passed to each child.
Identify recombination points.
Visualise paternal and maternal haplotypes across loci.
Microsatellite marker = one locus with variable repeat length.
• Each parent has two alleles at that marker (one per chromosome).
• Across multiple markers, each chromosome has a specific combination of alleles.
• That combination = haplotype.
• In pedigrees:
• affected individuals share the same haplotype,
• unaffected individuals do not.
• Therefore:
• the disease gene must be located on that haplotype, between specific markers.
In linkage analysis, a haplotype represents the ordered combination of marker alleles present on a single parental chromosome, and it is built by determining genotypes of multiple marker loci and assigning alleles to maternal or paternal chromosomes across a pedigree; the disease gene itself is not part of the haplotype definition but is inferred to lie on the haplotype that consistently co-segregates with disease.
Assign alleles to maternal and paternal chromosomes
• Start with the genotypes at each marker for:
• dad,
• mum,
• child(ren).
Remember:
• each person has two alleles per marker,
• one allele on each homologous chromosome.
For each marker locus:
• the child must inherit one allele from mum and one from dad.
• Compare the child’s alleles with the parents’:
• if the child has an allele only present in dad → that allele came from dad,
• if the child has an allele only present in mum → that allele came from mum.
Assign those alleles to:
• the paternal chromosome,
• the maternal chromosome.
Repeat this process marker by marker along the chromosome.
• Once alleles are assigned across markers:
• the ordered alleles on one chromosome form one haplotype,
• the ordered alleles on the other chromosome form the second haplotype.
• If the inherited parental haplotype switches between adjacent markers:
• this indicates a recombination (crossover) event.
The chromosome number identifies which chromosome a gene or marker is located on, while the locus describes its specific position along that chromosome, which determines linkage and haplotype structure.
Critical disease interval:
The shared region of the chromosome (shared haplotype) inherited by all affected individuals but not by unaffected ones — narrowing down where the disease gene lies.
This interval contains the causal gene and guides further sequencing.
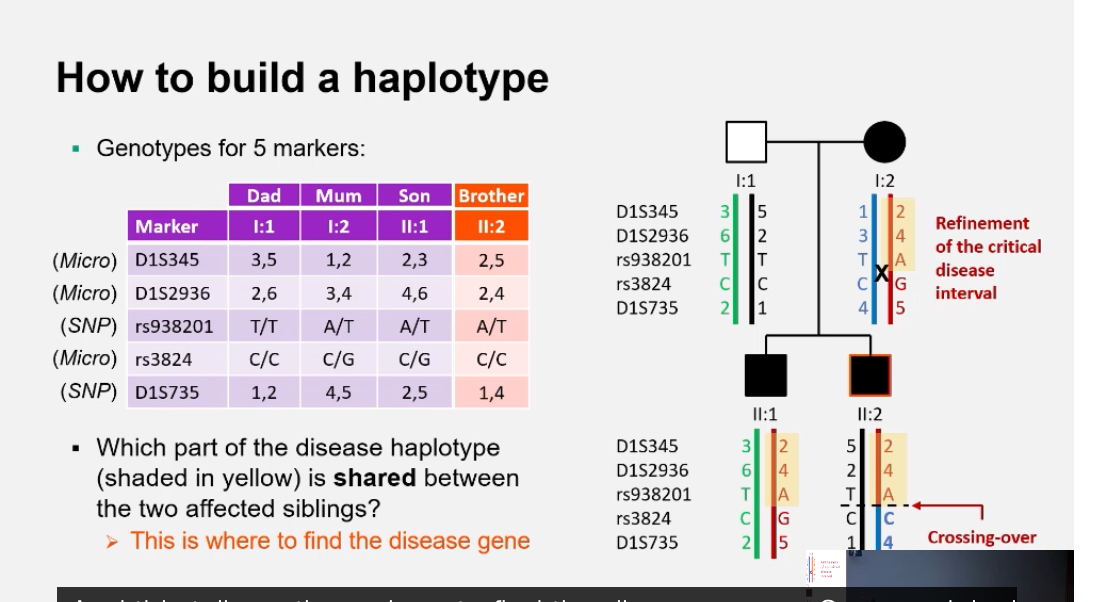
What does “refinement of the critical interval” involve?
Comparing recombination events across multiple affected relatives to define the smallest overlapping segment that must contain the causal gene.
Why is sequencing still needed after linkage analysis?
Linkage shows where the gene is located, not what the causal variant is. Sequencing the region identifies the specific mutation.
What is linkage mapping using genetic markers?
Linkage mapping uses an observed locus (genetic marker) to make inferences about an unobserved locus (the disease gene).
If a marker is genetically linked to the disease locus, affected relatives will share the same marker alleles more often than expected by chance.
What does it mean when a marker is “unlinked” to a disease locus?
If the marker and disease gene are far apart, recombination occurs frequently. Affected family members are no more likely to share the same marker alleles than expected by random segregation.
What does it mean when a marker is “linked” to a disease locus?
The marker and disease gene are close together, so recombination is rare. Affected relatives inherit the same marker alleles together more often than by chance, revealing a region likely to contain the disease gene.
How are haplotypes used in linkage mapping?
Haplotypes show which alleles at different loci were inherited together from each parent. By comparing haplotypes in affected and unaffected relatives, researchers can identify the region of the chromosome that co-segregates with the disease.
What statistical method is used to assess linkage strength?+ What does a LOD score represent mathematically?
The LOD score (Logarithm of the Odds) — a statistical measure used to evaluate whether two loci are likely to be linked versus unlinked.
LOD = log₁₀ (Probability of data if loci are linked / Probability of data if loci are unlinked)
It compares how likely the observed inheritance pattern is under linkage versus random segregation.
What do positive and negative LOD scores indicate?+ What is the equivalent p-value for a LOD score of 3?
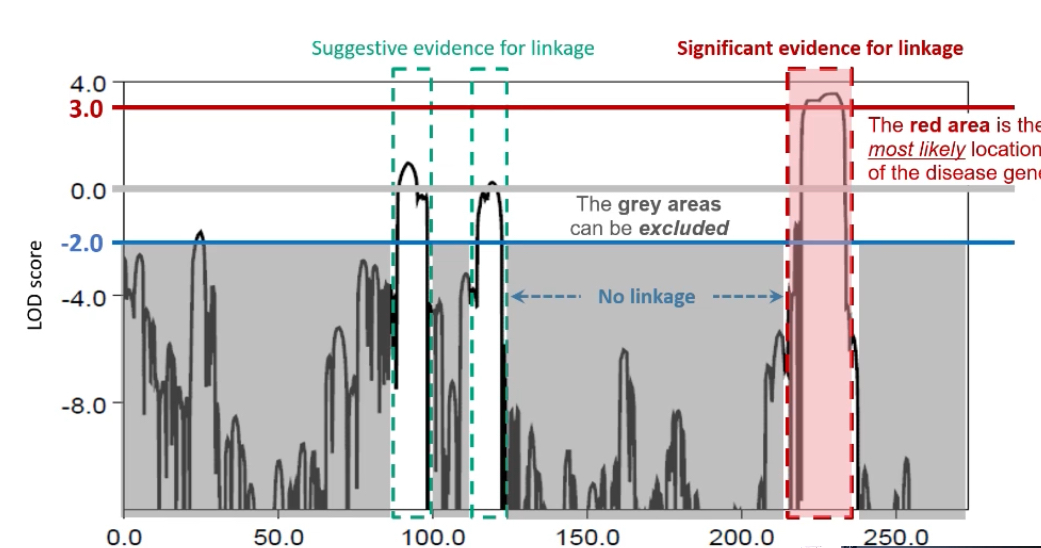
LOD ≥ 3: Significant evidence for linkage (odds of 1000:1 that loci are linked).
LOD ≤ -2: Evidence against linkage.
Scores between -2 and 3 are inconclusive and require more data.
Approximately p = 0.05, which is considered genome-wide significance for linkage.
Why are LOD scores considered additive?
Data from multiple families linked to the same locus can be combined by summing their LOD scores. A cumulative LOD ≥ 3 across families strengthens the overall evidence for linkage.
What does a LOD score graph look like?+ What happens after a linkage peak is identified?
A line graph plotting LOD score (y-axis) against chromosome position (x-axis). Peaks indicate potential linkage regions. A peak ≥ 3 suggests the likely position of the disease gene.
What happens after a linkage peak is identified?
The candidate region on the chromosome is sequenced to pinpoint the exact variant responsible for the disease. Linkage reveals the approximate location; sequencing provides the precise genetic change.
What are the main limitations of linkage analysis?
Requires large, multi-generation pedigrees with clear inheritance patterns.
Less effective for complex (polygenic) diseases.
Recombination events can blur boundaries if marker density is low.
Cannot detect variants directly; sequencing is still needed.
What does the term “association” mean in genetics?
Association refers to the observation that two factors occur together more often than expected by chance. In genetics, a genetic association occurs when a particular allele or variant is found more frequently in people with a disease (cases) than in people without it (controls).
What is a Genome-Wide Association Study (GWAS)?+ How does GWAS differ from linkage analysis?
GWAS is a method used to identify common genetic variants across the genome that are statistically associated with a particular trait or disease by comparing large groups of unrelated cases and controls.
GWAS examines whether certain alleles are more common in affected individuals (cases) compared to unaffected individuals (controls). A significantly higher frequency in cases suggests that the variant or nearby variant contributes to disease risk.
Linkage analysis: family-based, best for rare/monogenic diseases; identifies large chromosomal regions linked to disease.
GWAS: population-based, best for common/polygenic diseases; tests hundreds of thousands of variants across the genome for statistical association.

What type of variants are tested in GWAS?
GWAS focuses mainly on Single Nucleotide Polymorphisms (SNPs) because they are abundant, stable, and easy to genotype across the entire genome using DNA microarrays.
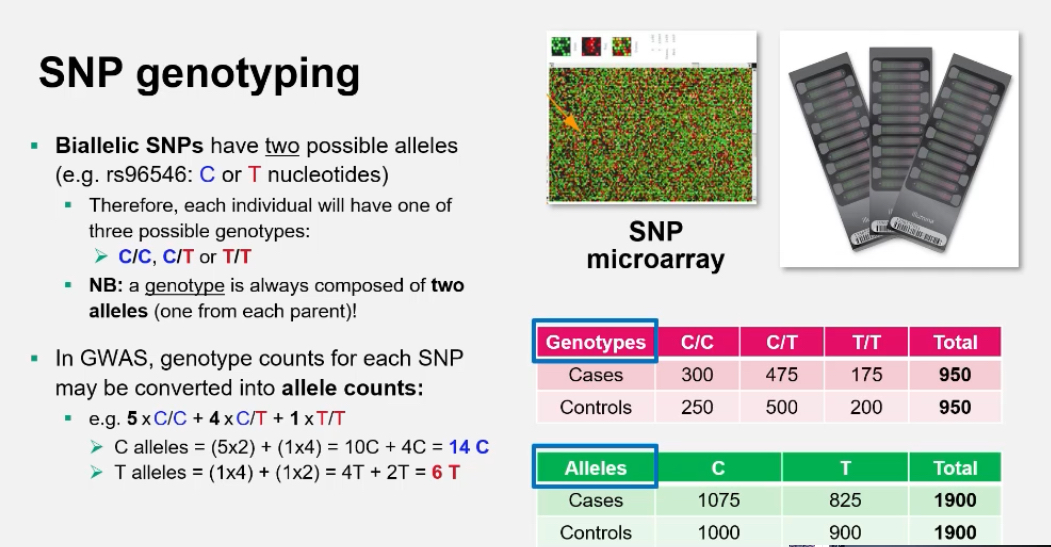
What is a SNP microarray and how does it work?:
A SNP microarray (or genotyping chip) contains thousands of probes that detect specific nucleotide variants.
Each SNP is tested by hybridisation to fluorescently labelled DNA.
• Homozygous allele 1 → one colour signal
• Homozygous allele 2 → another colour
• Heterozygous → mixed colour
The results show each person’s genotype for each SNP.
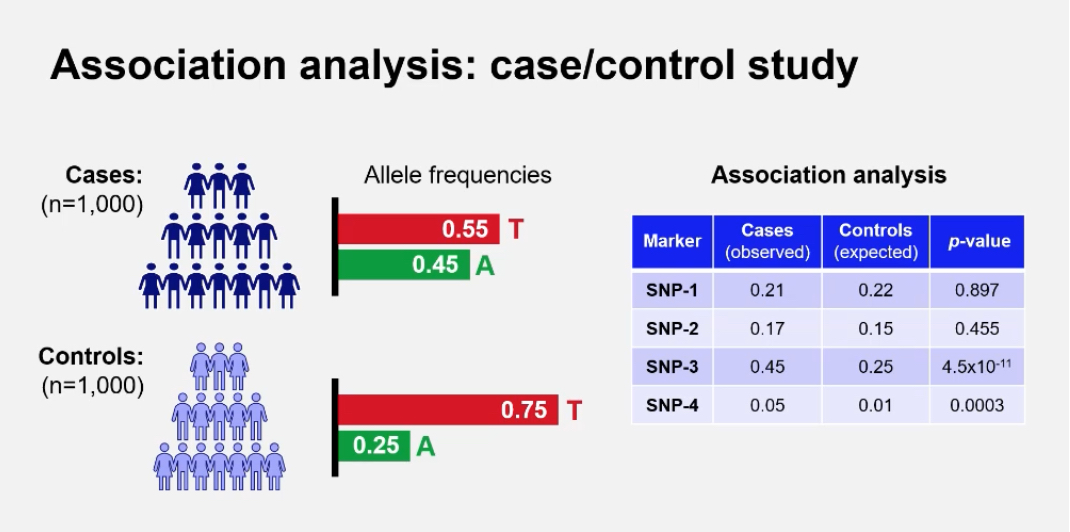
What are the genotype and allele frequencies used for in GWAS?
They are used to calculate whether an allele is significantly more common in cases(healthy) than controls(disease)
Example: In a case/control study of 1,000 individuals each, allele counts are compared using statistical tests such as chi-squared.
How is genotype converted to allele counts?
For a biallelic SNP (C/T):
• 5 × CC = 10 C alleles
• 4 × CT = 4 C + 4 T
• 1 × TT = 2 T alleles
Total: C = 14, T = 6
This allows frequency comparisons between groups.
What is Minor Allele Frequency (MAF) and why is it important in GWAS?
MAF represents the frequency of the less common allele in a population. It helps determine which variants are common enough to study. GWAS typically focuses on variants with MAF > 1%.
MAFs differ widely between populations, influencing the interpretation of association results.
What statistical test is used in GWAS?+ What does a p-value represent in GWAS?
The chi-squared (χ²) test is used to compare genotype or allele frequencies between cases and controls. The results are expressed as p-values indicating the likelihood that the observed difference occurred by chance.
The probability that the observed association occurred by random chance.
Low p-value → strong evidence of association.
Results are often displayed as –log₁₀(p-value) for visual clarity (larger peaks = stronger association).
Why are p-values adjusted for multiple testing in GWAS?:
Because millions of SNPs are tested simultaneously, some will appear significant by chance alone.
The Bonferroni correction adjusts the threshold for significance:
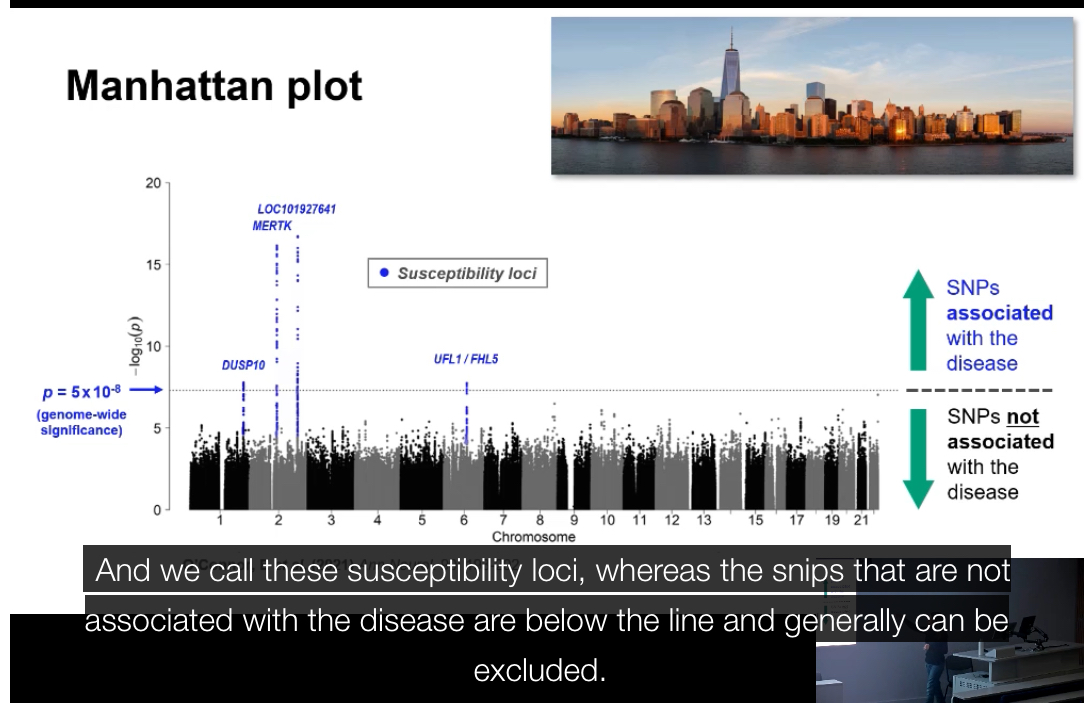
Genome-wide significance = p < 5 × 10⁻⁸.
What is a Manhattan plot?+ What does the peak in a Manhattan plot indicate?
A graph used to display GWAS results across all chromosomes.
• X-axis: chromosome position
• Y-axis: –log₁₀(p-value)
Each dot = one SNP
Peaks represent SNPs with significant associations.
What does the peak in a Manhattan plot indicate?:
The chromosomal region most strongly associated with the disease. The exact causal variant may not be the top SNP itself but another variant in linkage disequilibrium with it.
What is a regional association plot?
A zoomed-in plot of one genomic region showing the lead SNP and surrounding variants. Each variant is coloured by its degree of linkage disequilibrium (r²) with the lead SNP, showing how associations cluster together.
It visualises the pattern of association across a small genomic region.
• Each point = a SNP.
• X-axis = genomic position.
• Y-axis = –log₁₀(p-value).
• Colour = strength of LD (r²) with the lead SNP.
This helps identify whether nearby SNPs form a cluster of association.
What are the main outputs of a GWAS?+ What are the strengths and limitations of GWAS?
Manhattan plot (genome-wide significance results)
Regional association plot (local signal detail)
List of significant SNPs with their p-values, odds ratios, and nearby genes.
What are the strengths of GWAS?:
Detects common variants associated with complex traits.
Covers the entire genome without prior knowledge of candidate genes.
Can reveal biological pathways involved in disease.
What are the limitations of GWAS?:
Requires very large sample sizes.
Explains only a small fraction of heritability.
Does not prove causation (association ≠ function).
Results can vary across populations due to allele frequency differences and LD patterns.
What is linkage disequilibrium (LD)?
Linkage disequilibrium (LD) is the non-random association of alleles at two or more loci. It means that certain combinations of genetic variants occur together more often than expected by chance in a population.
Linkage disequilibrium (LD)
What actually changes / why it matters (cause first)
Linkage disequilibrium means certain allele combinations occur together more often than expected by chance in a population.
The key idea is non-random association of alleles at different loci.
This happens because recombination has not yet broken those combinations apart.
Step-by-step explanation
Consider two different loci (e.g. SNP A and SNP B).
Each locus has alleles:
SNP A: A / a
SNP B: B / b
If alleles assort randomly, the combinations AB, Ab, aB, ab should occur at predictable frequencies.
In linkage disequilibrium:
one combination (e.g. AB) appears more often than expected,
others appear less often.
This means:
the alleles are associated in the population.
Why LD happens
The loci are physically close together on the chromosome.
Recombination between them is rare.
The alleles were inherited together from a common ancestral chromosome.
Not enough generations have passed for crossing over to randomise them.
How is LD different from genetic linkage?
Genetic linkage: Physical proximity of loci on a chromosome; observed in families (inherited together).
Linkage disequilibrium: Statistical association of alleles at loci across the population; not necessarily caused by physical proximity but often related to it.
Summary: Linkage = family-level co-inheritance. LD = population-level correlation of alleles.
Why is LD important in GWAS?
GWAS often detects tag SNPs that are not causal themselves but are in strong LD with the true disease-causing variant.
LD allows researchers to identify genomic regions associated with a trait without directly genotyping every variant.
What factors influence the extent of LD?
Recombination rate
• Mutation rate
• Genetic drift and population history
• Natural selection
• Population structure (e.g. bottlenecks or admixture)
LD tends to decay over distance; closer loci have stronger LD.
What is the measure of LD strength (r²)?
r² is a statistical measure (0–1) describing how strongly two loci are correlated.
r² = 1 means complete LD (alleles always inherited together).
r² = 0 means loci segregate independently.
How is linkage disequilibrium used in fine-mapping?
Fine-mapping uses LD patterns to narrow down the region likely to contain the causal variant by analysing which SNPs remain associated after accounting for correlation between markers.
What is meta-analysis in the context of GWAS?+ How are meta-analysis results visualised?
Meta-analysis combines GWAS results from multiple cohorts or studies to increase statistical power. It helps confirm true associations that replicate across independent populations.
They are visualised typically with Manhattan plots showing combined –log₁₀(p-values) across all studies.
Each significant locus that replicates across studies is highlighted as a validated association.
What are the limitations of LD-based association results?
The top SNP may not be the causal variant.
LD patterns differ between populations.
Structural variants and rare variants may be missed.
Experimental validation is required to confirm causality.
What is the overall purpose of combining linkage, LD, and GWAS data?
Integrating these approaches helps identify both rare high-effect variants (linkage) and common low-effect variants (GWAS), offering a comprehensive understanding of genetic risk factors for disease.
In summary, what are the key takeaways from Disease Gene Mapping?
Genetic variation underlies disease risk and inheritance.
• Linkage analysis maps rare, high-effect variants using family data.
• GWAS maps common, low-effect variants using population data.
• Statistical tools like LOD scores and p-values measure linkage or association.
• LD connects nearby variants, allowing indirect mapping.
• Sequencing identifies the exact causal mutation.
Combined, these methods form the foundation of modern human genetics and precision medicine.