AP Micro unit 1 and 2 review
1/39
There's no tags or description
Looks like no tags are added yet.
Name | Mastery | Learn | Test | Matching | Spaced |
|---|
No study sessions yet.
40 Terms
scarcity
the inability of our limited resources to satisfy human wants
How to tell if an item is scarce?
positive price
system of allocation (distribution)
Less available than wanted
opportunity cost
Factors of Production
Land
Labor
Physical Capital (Machines and tools used to produce)
Entrepreneurship

PPC (Production Possibility curve)
Maximizing combinations of 2 different goods (or categories of goods) that can be produced with fixed resources
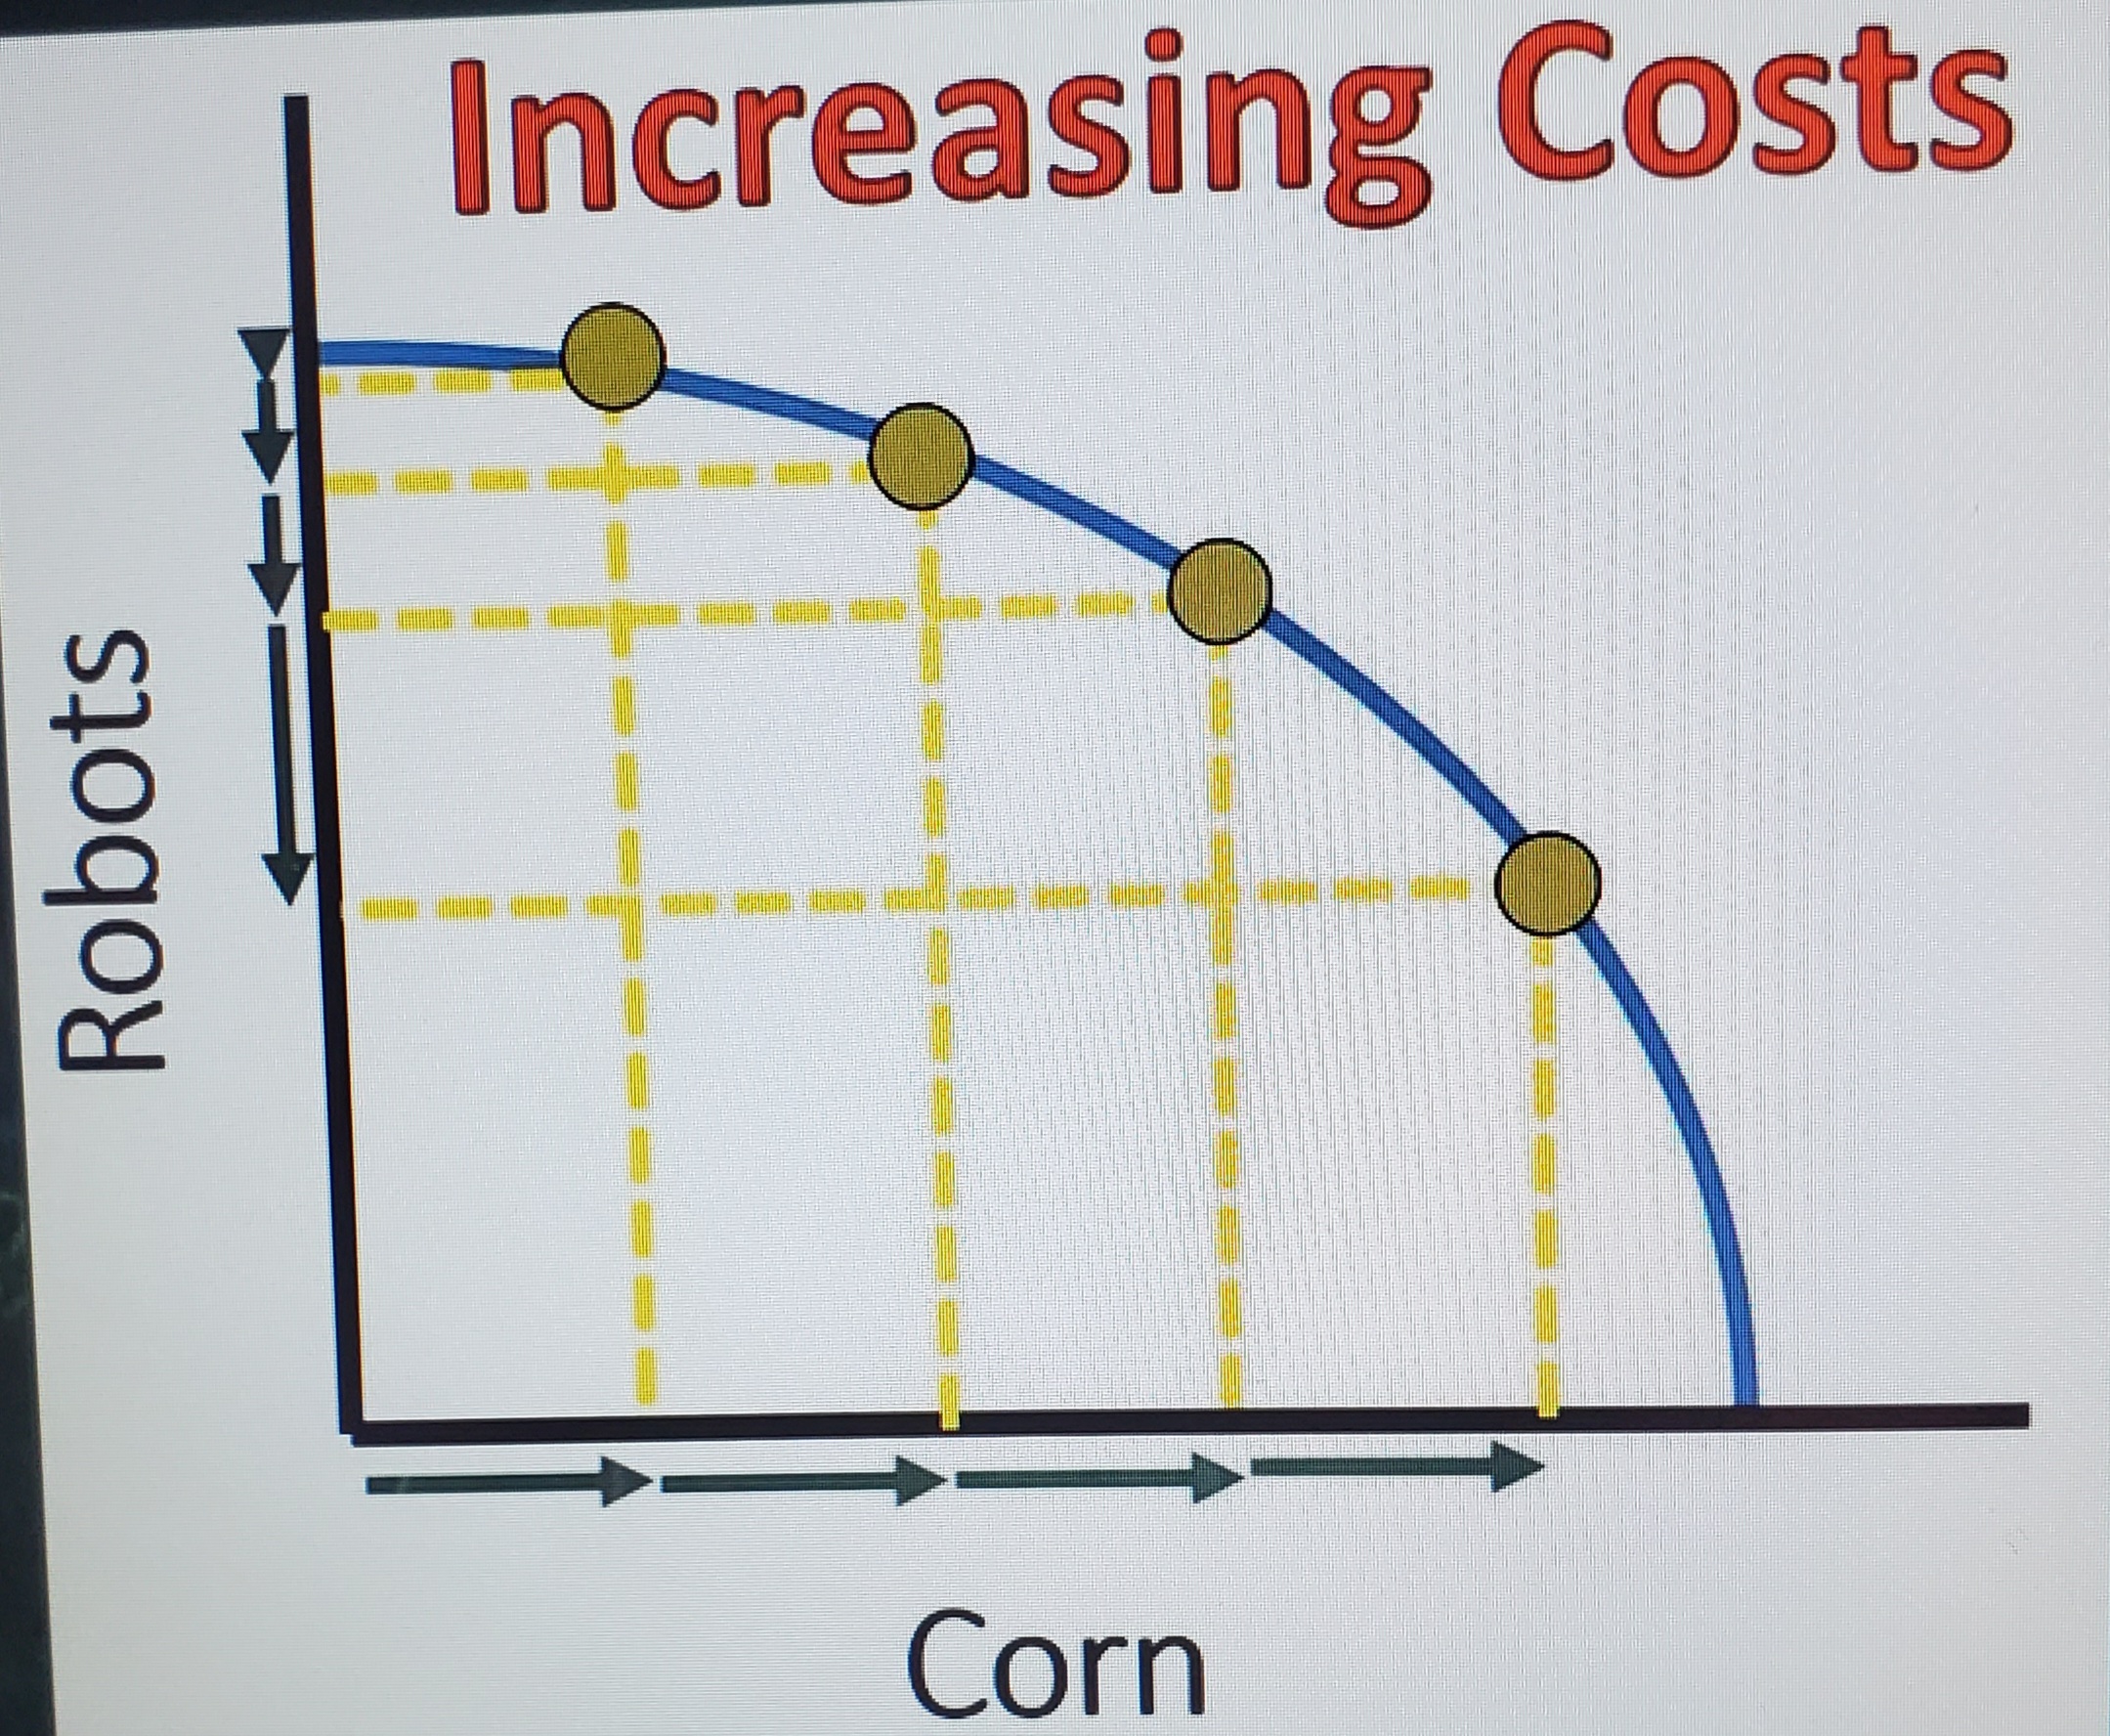
Increasing costs PPC
Resources used to make robots are not adaptable with the product with corn
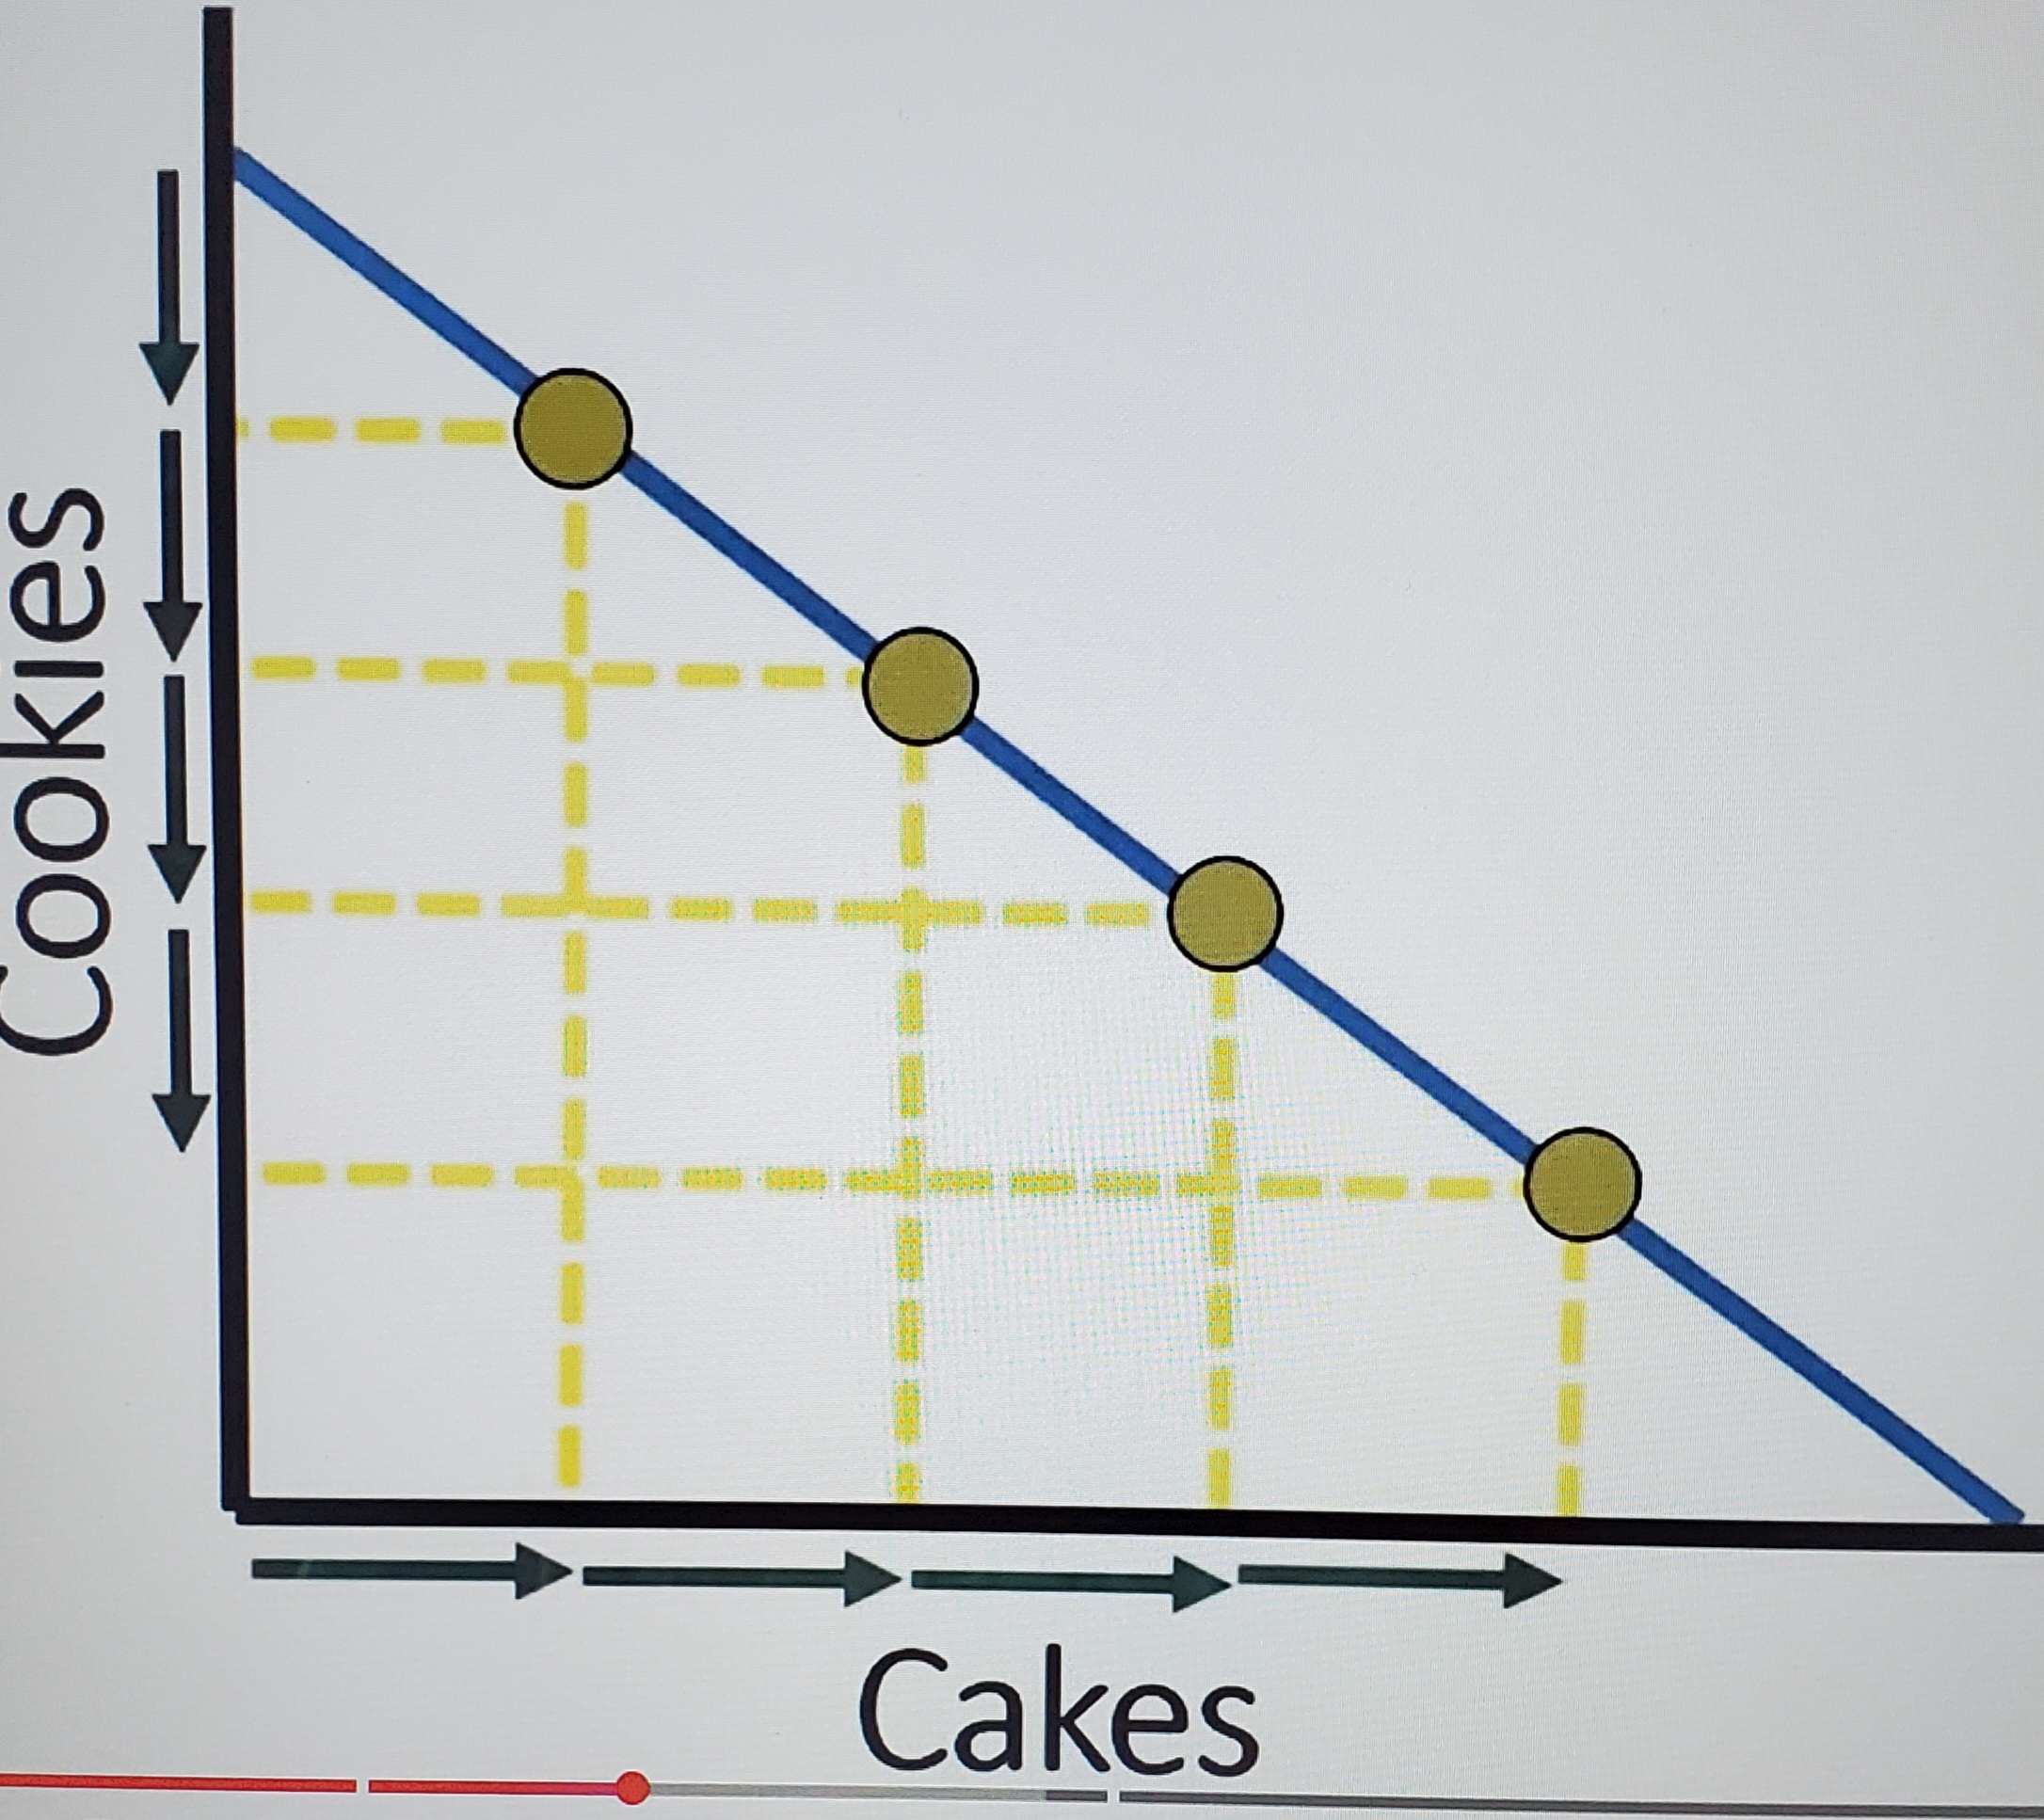
Constant costs PPC
resources used to make both goods are well adapted to each other
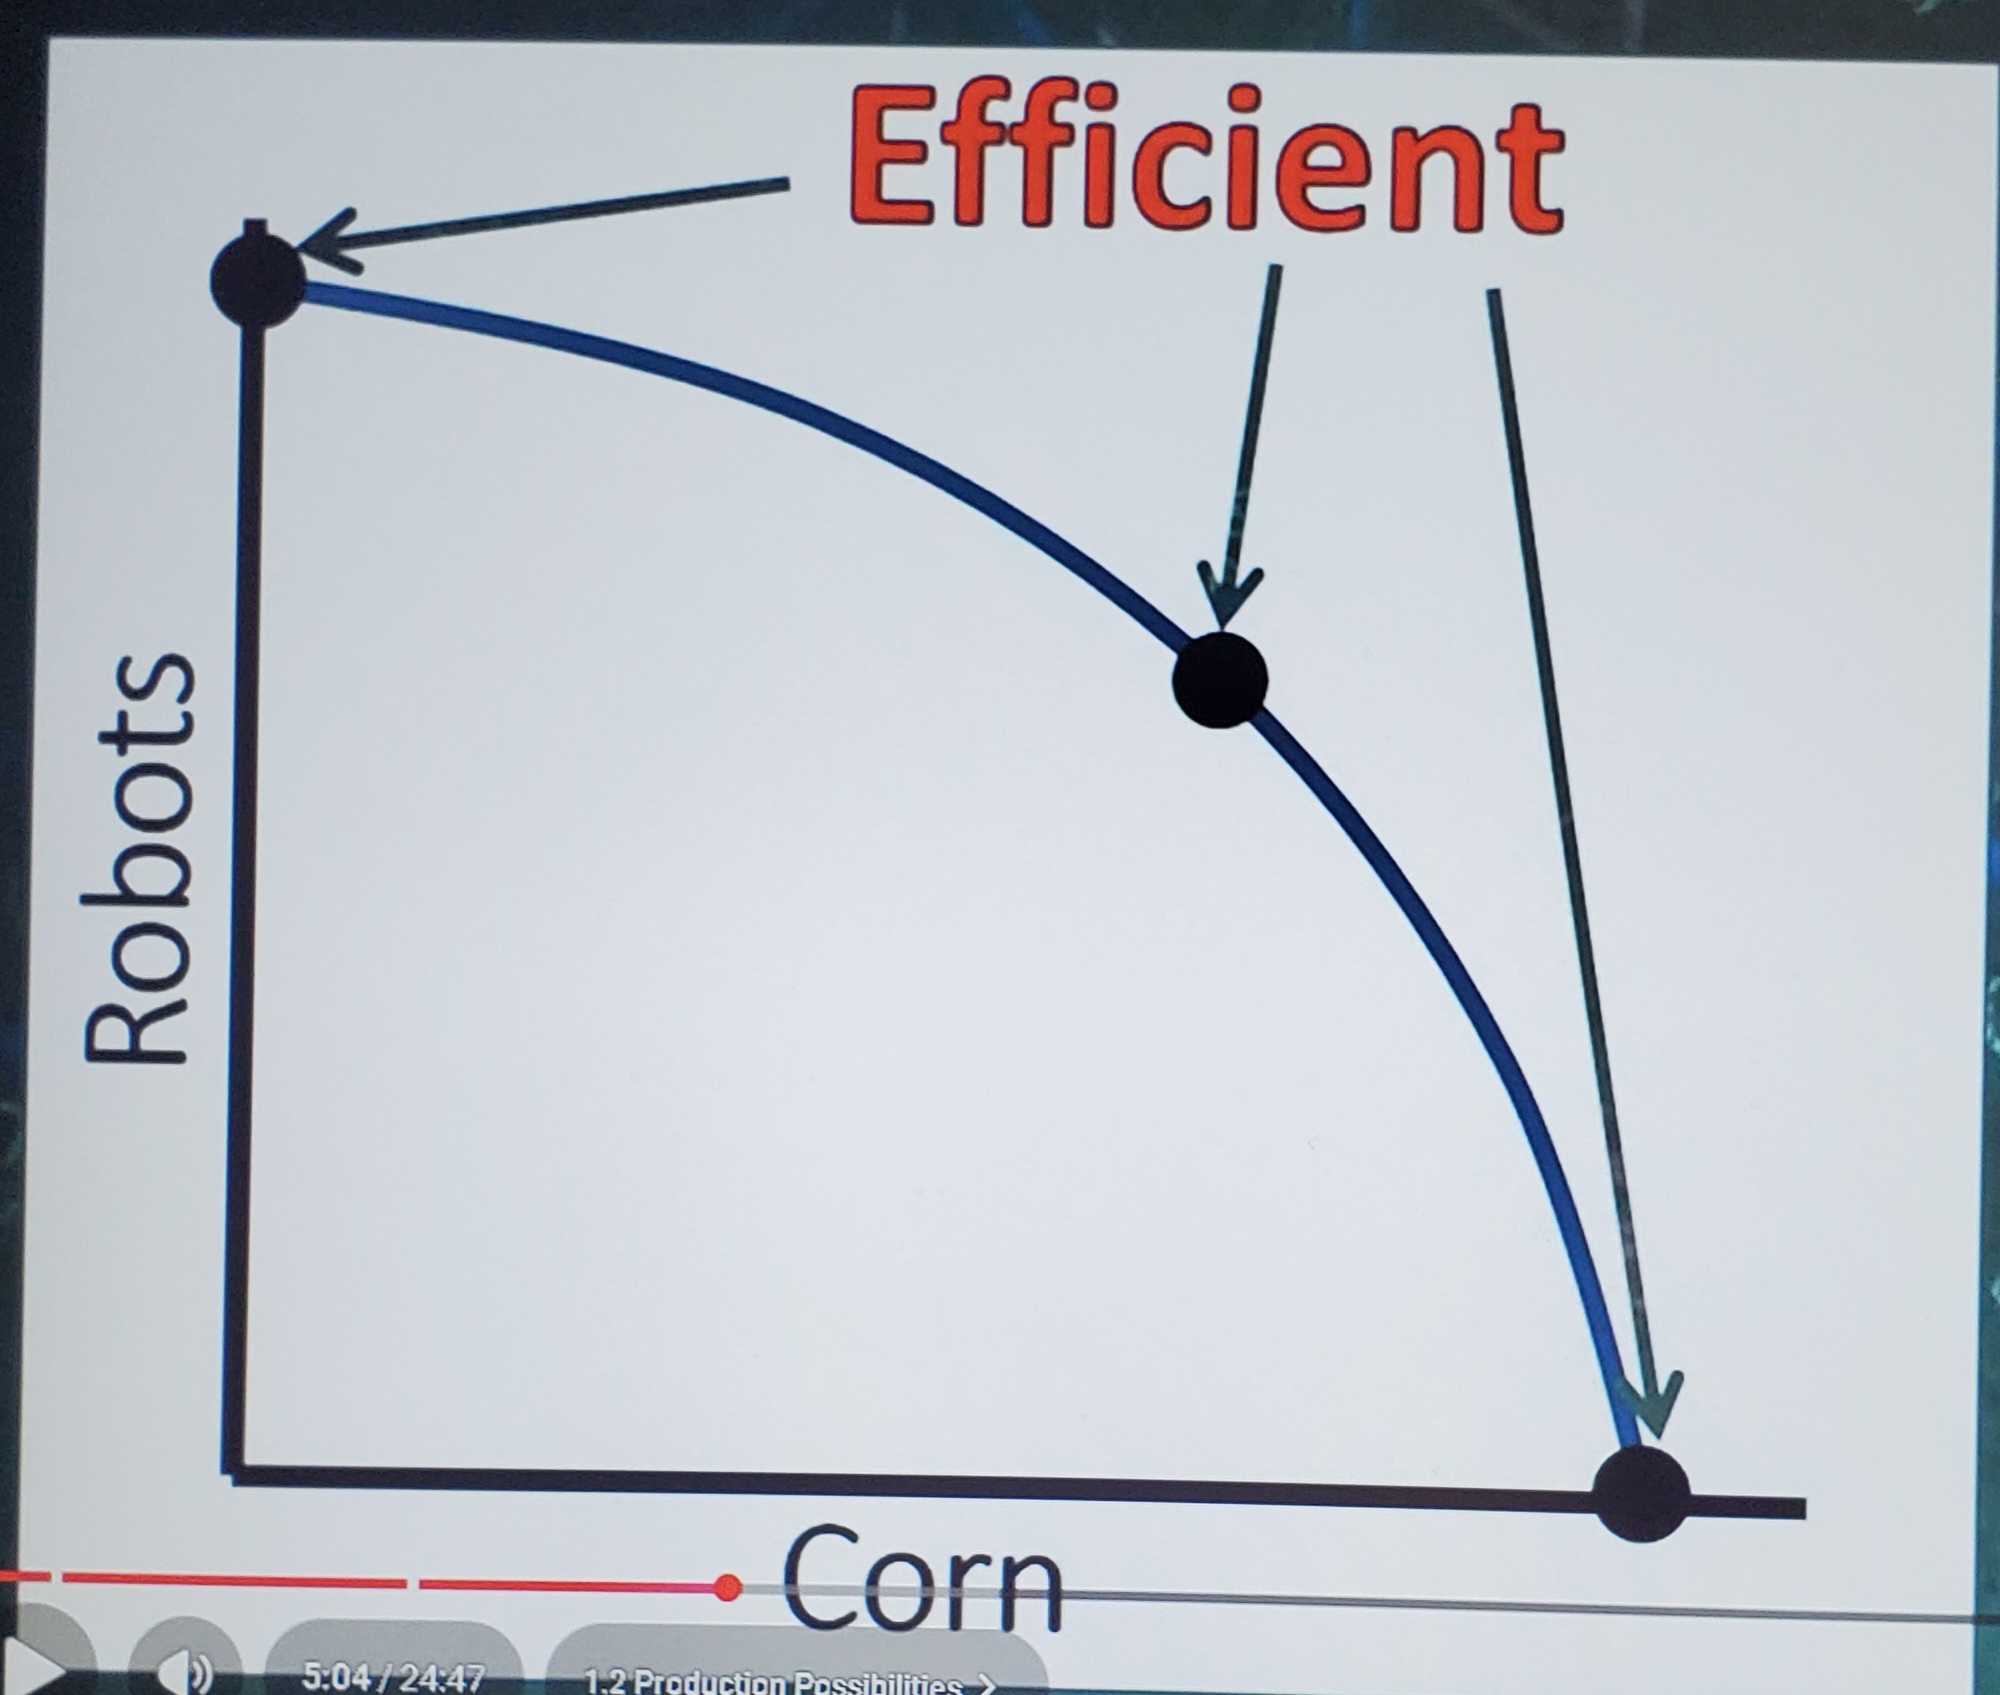
Efficient PPC
Any point on the curve is considered efficient
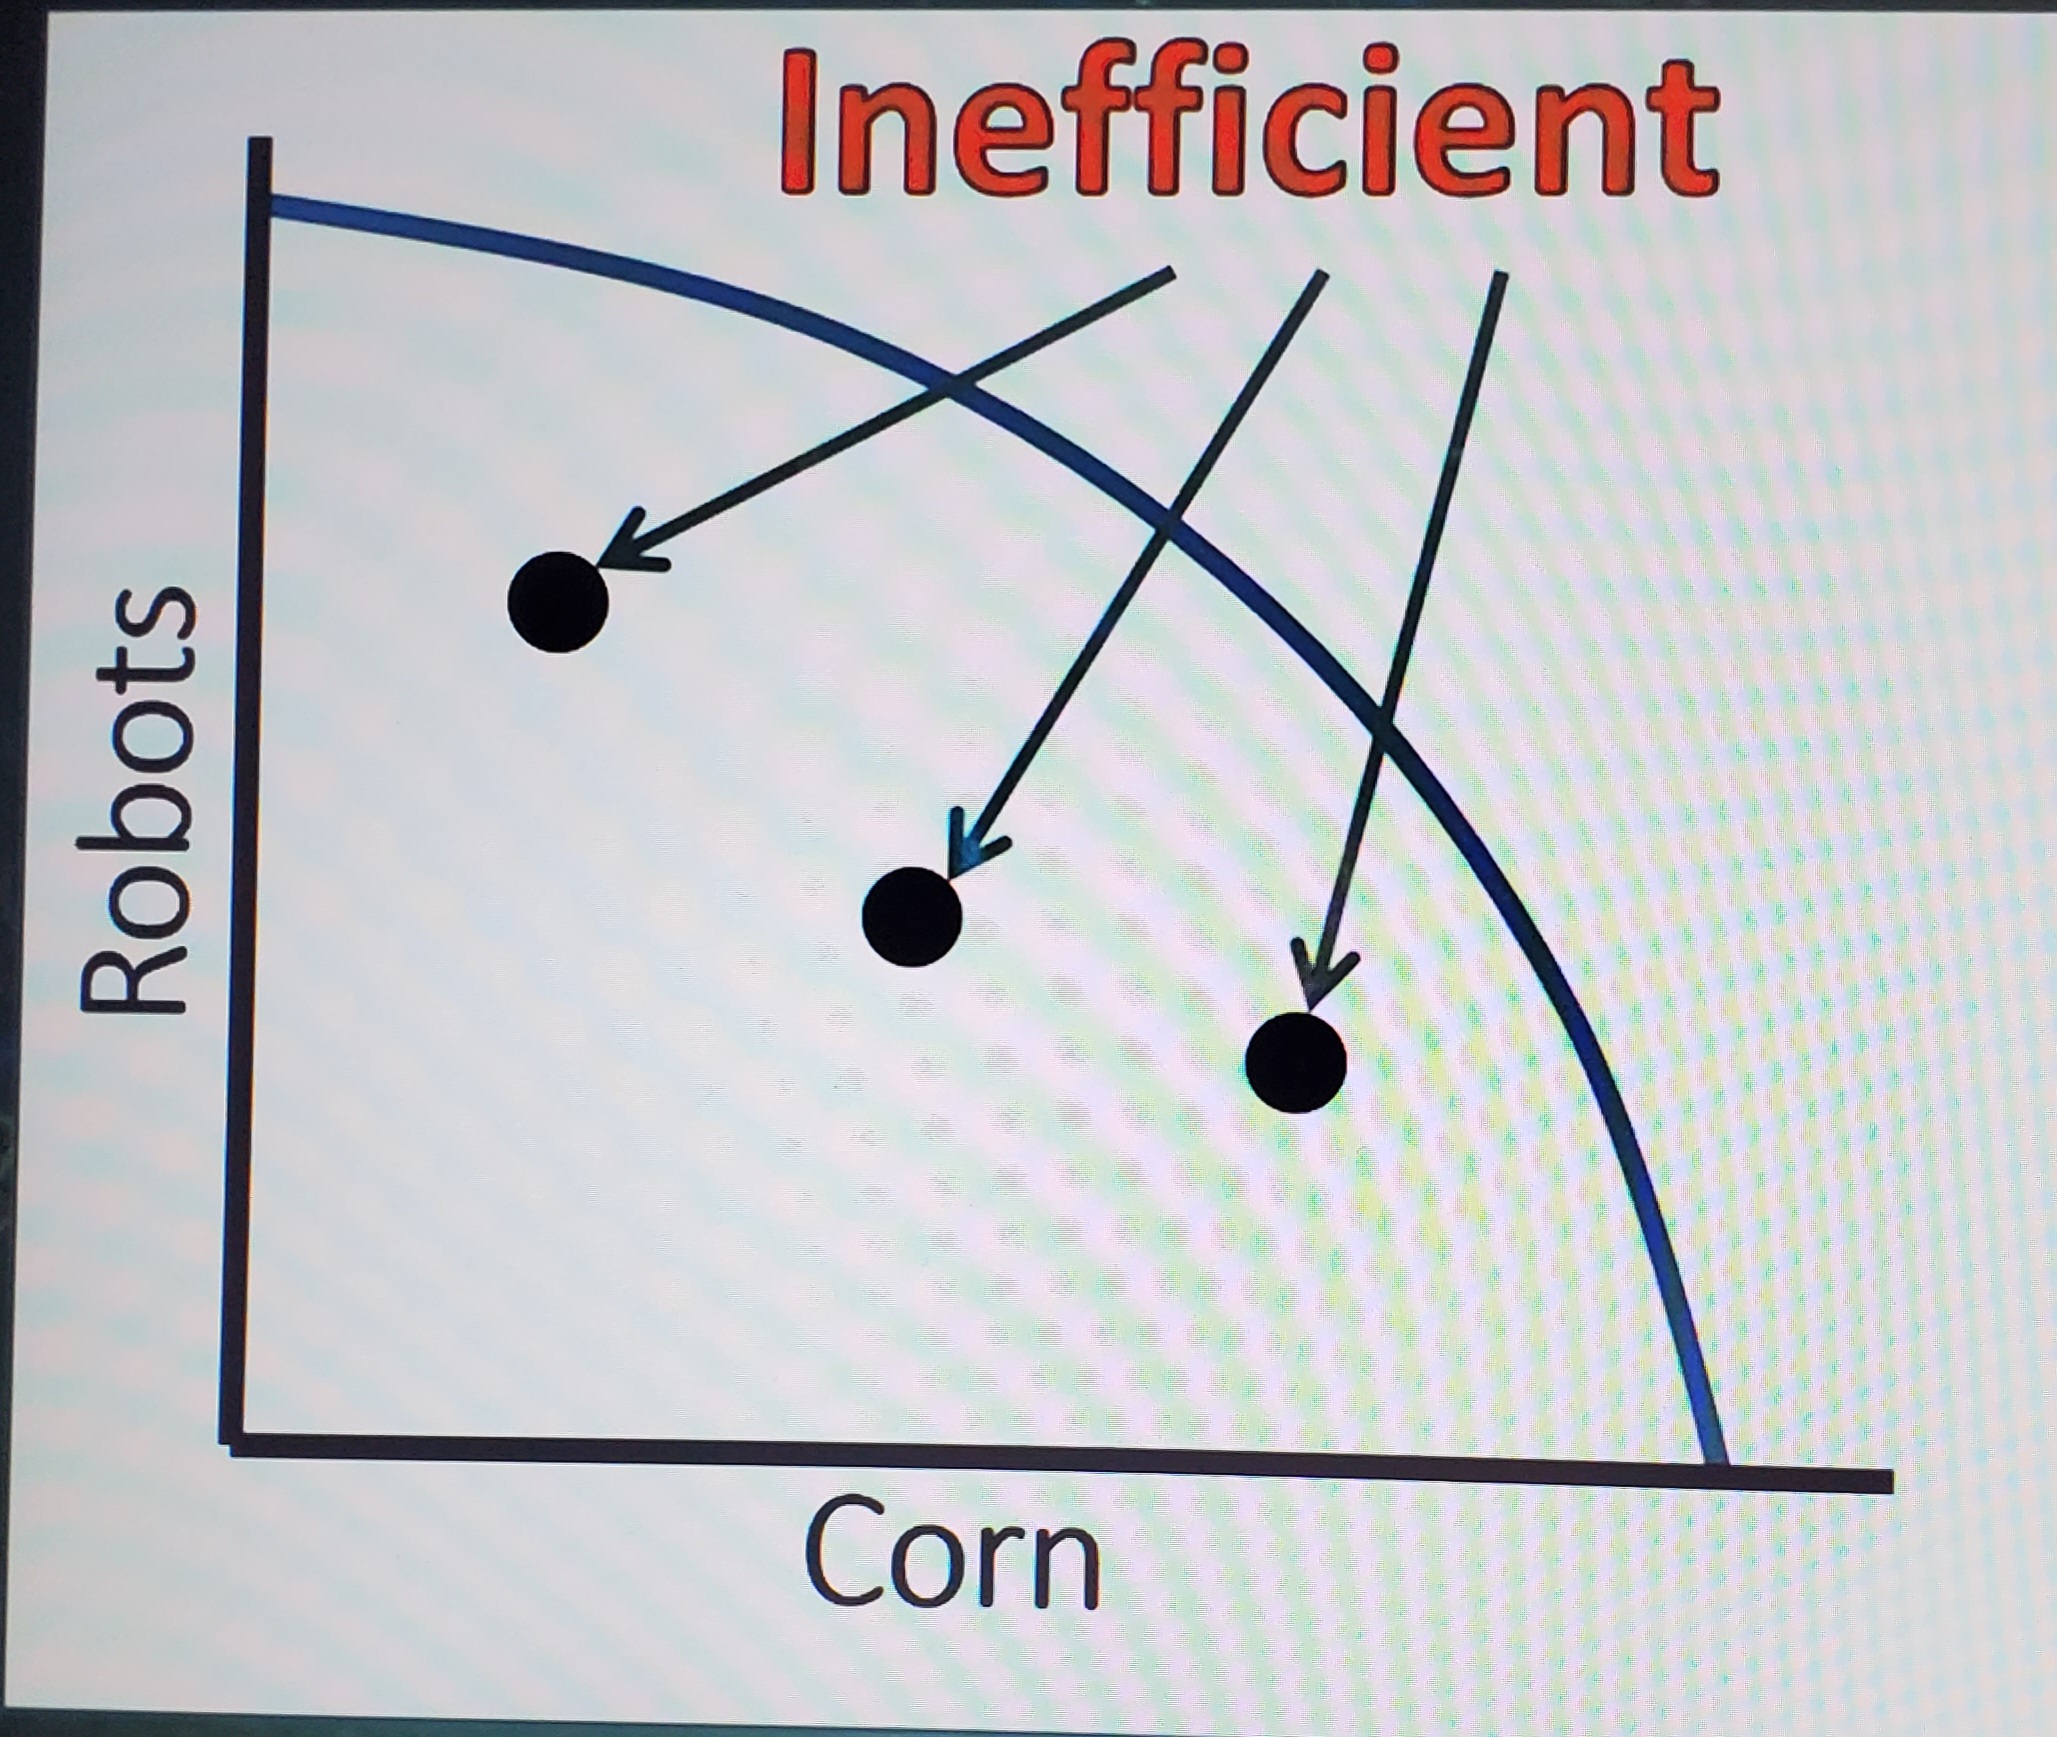
Inefficient PPC
Any points inside the curve are inefficient. The resources aren't being used correctly. Less production
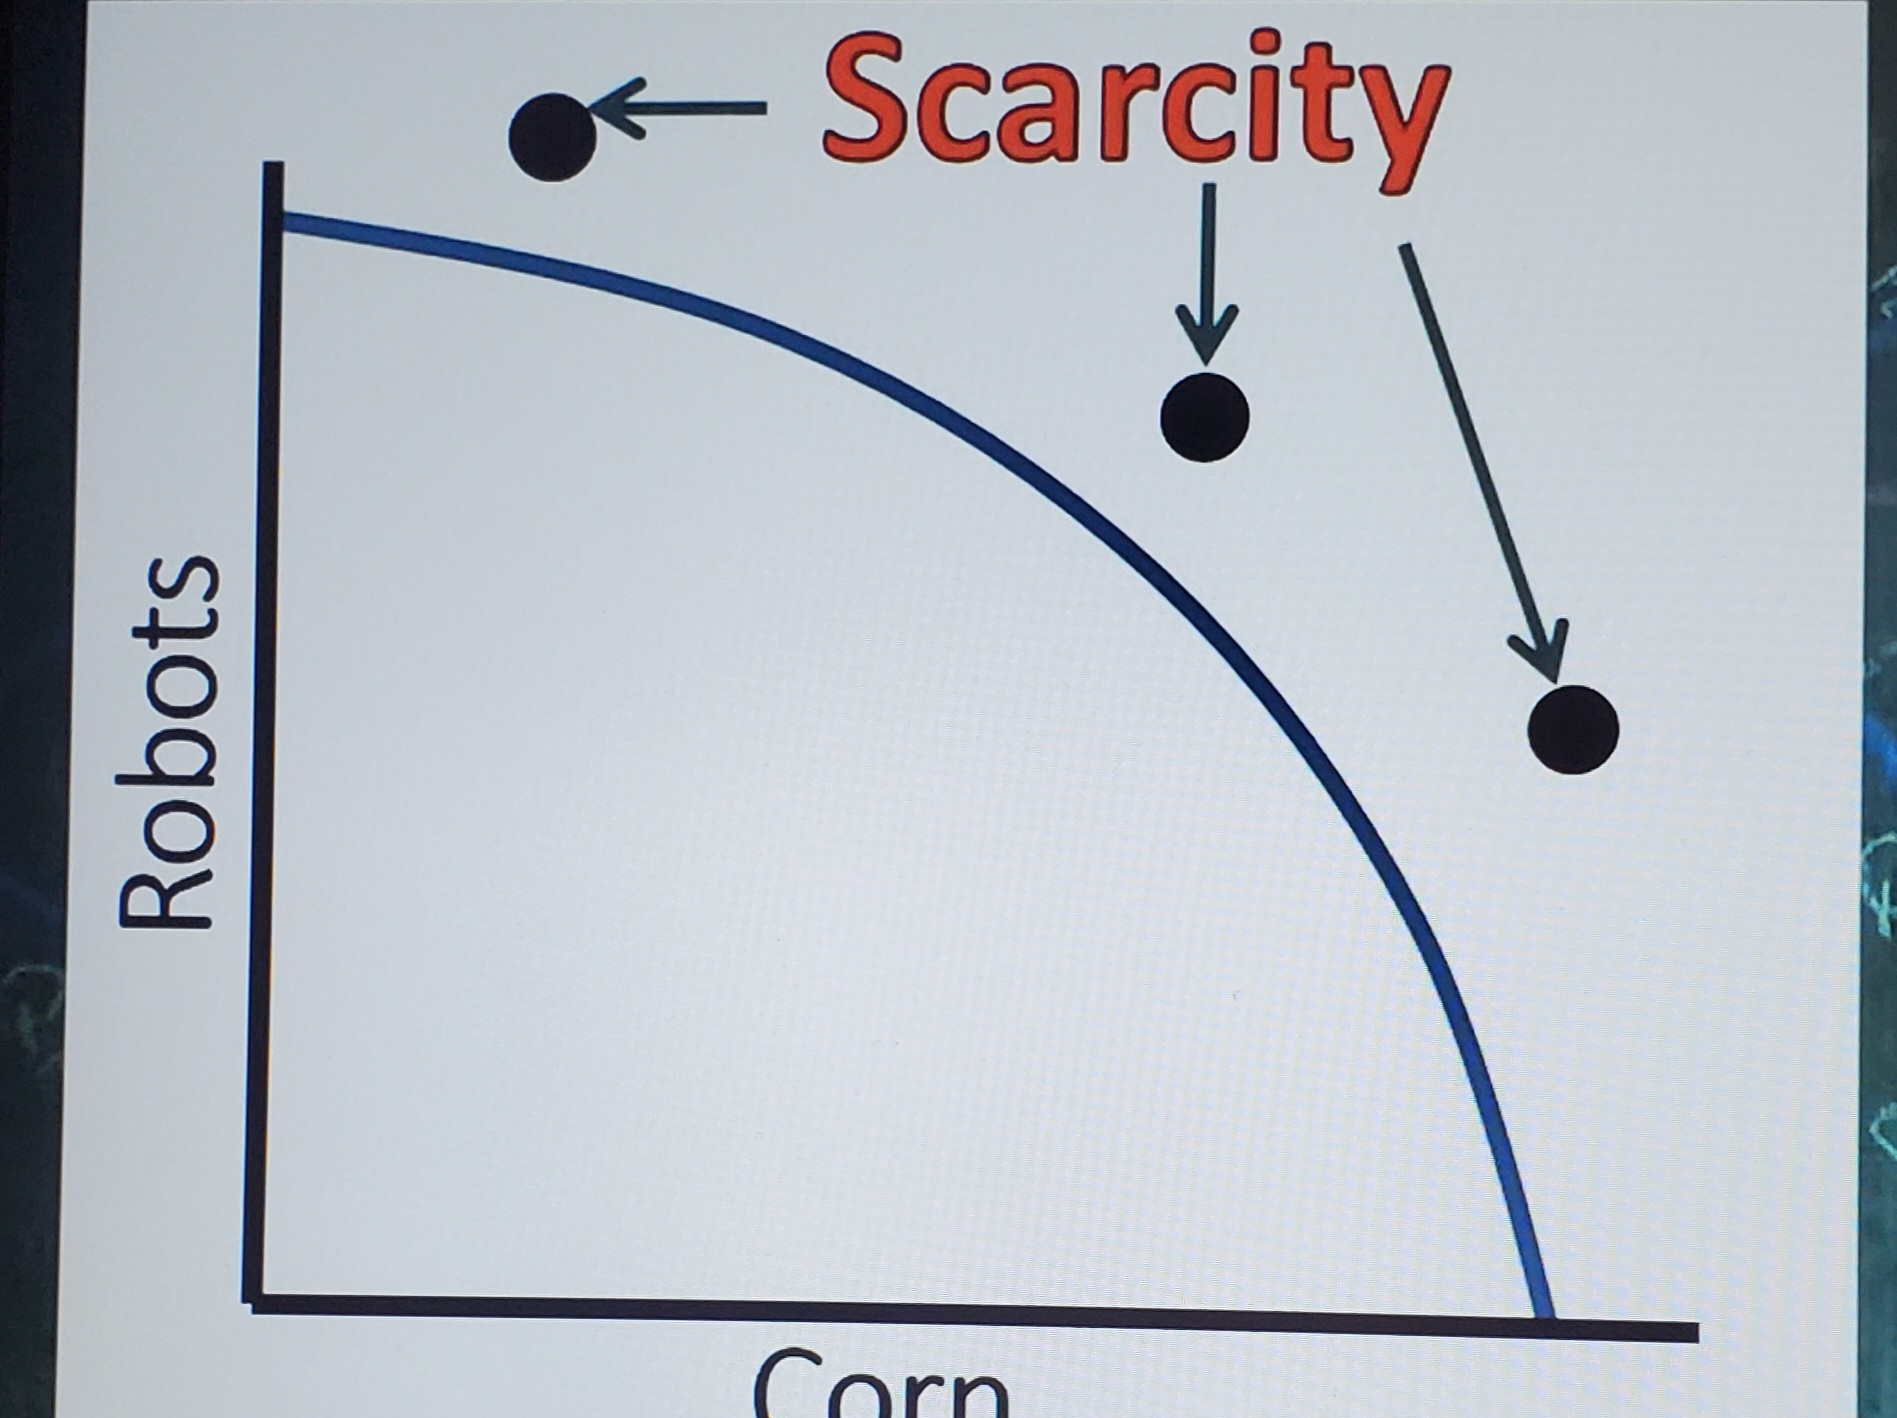
Scarcity PPC
Impossible, you cannot produce these. Must have economic growth to reach them
PPC Shifts
with changes in the quality or quantity of resources
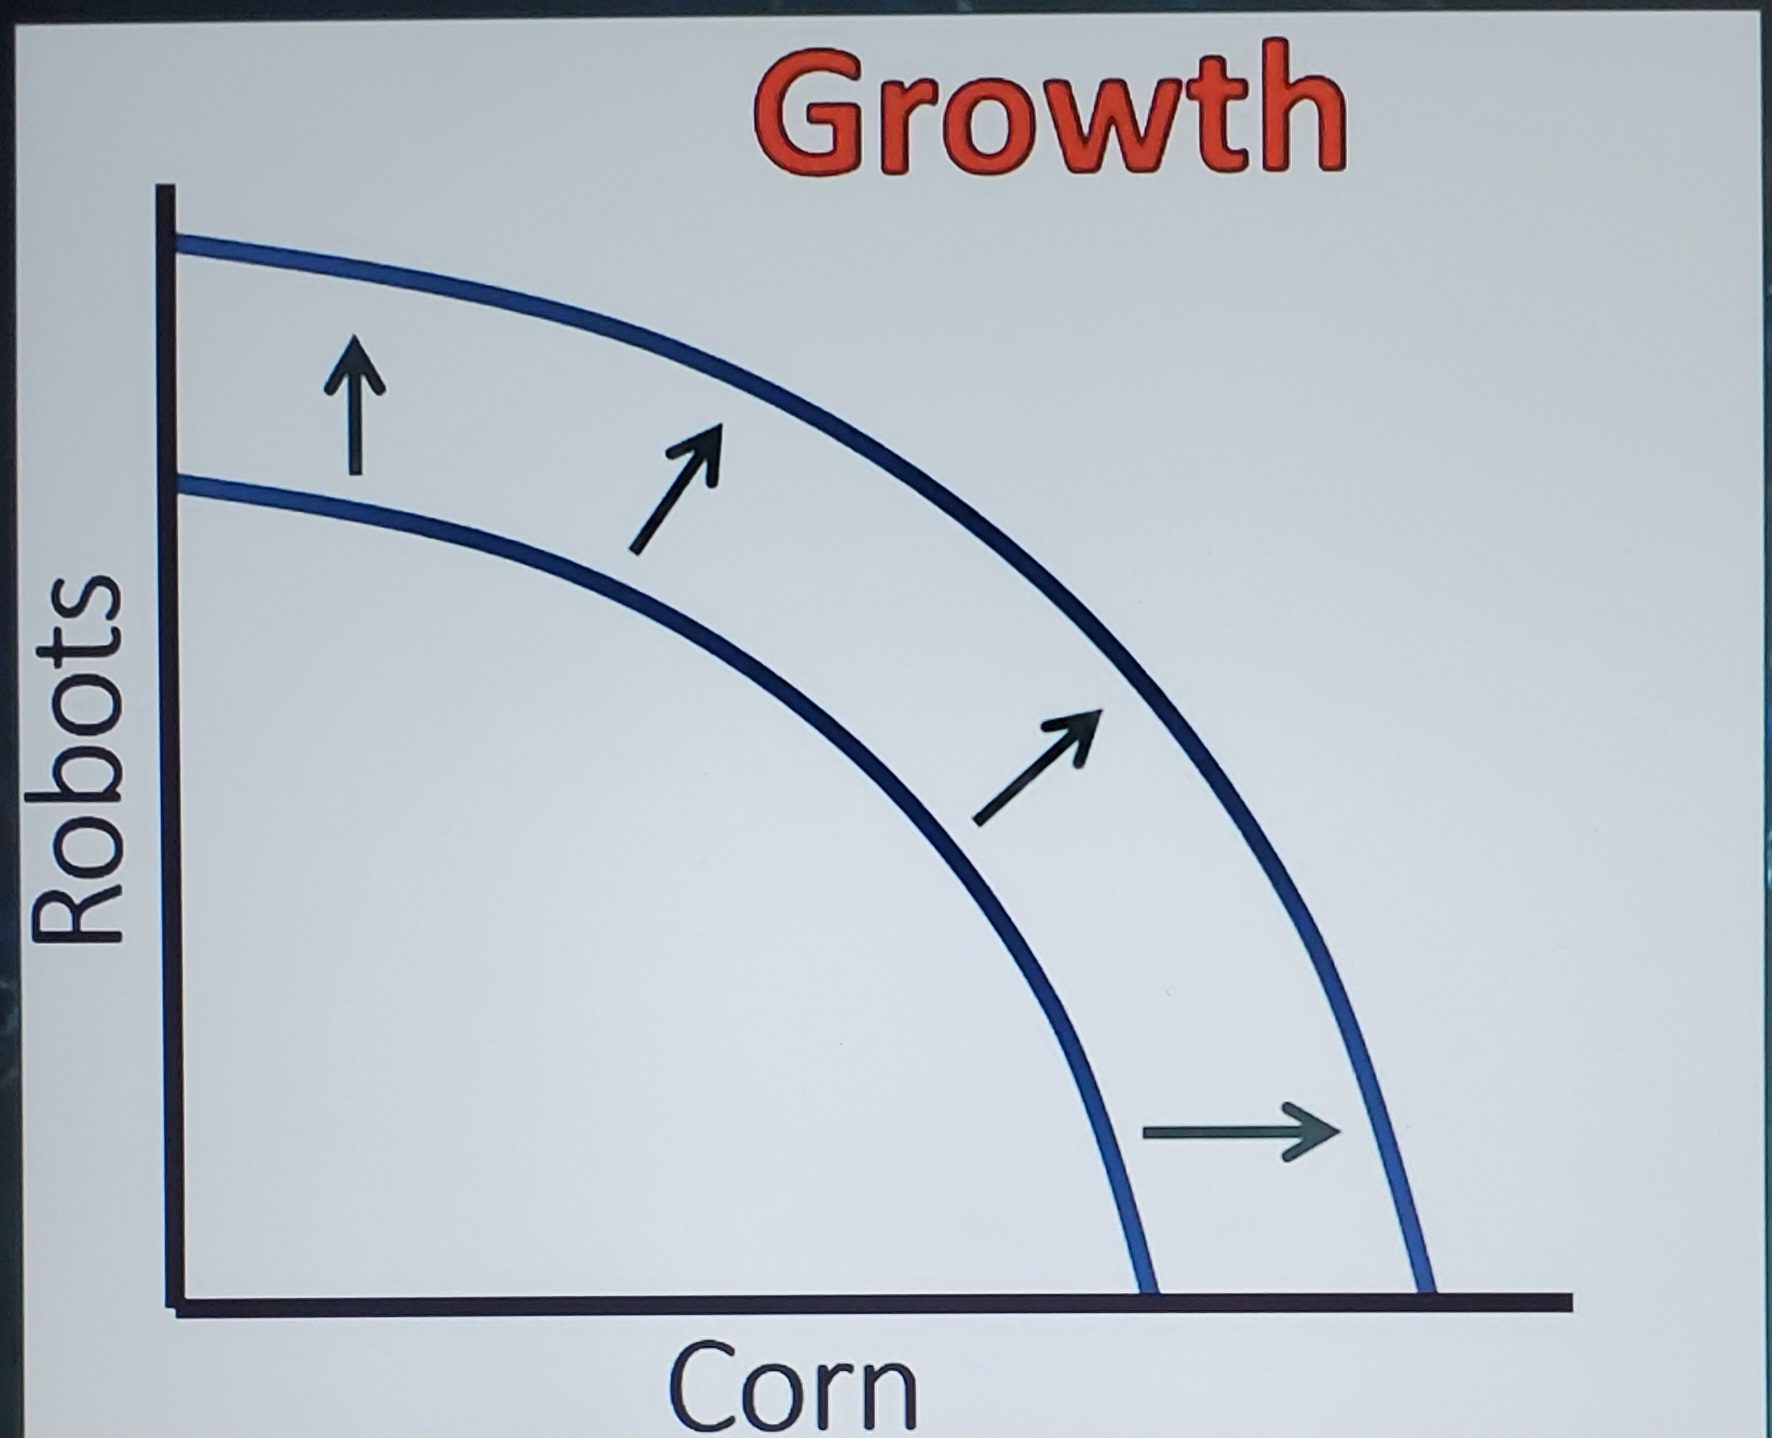
Growth PPC
Increases in productivity, better resources, or more resources can cause the curve to go outwards
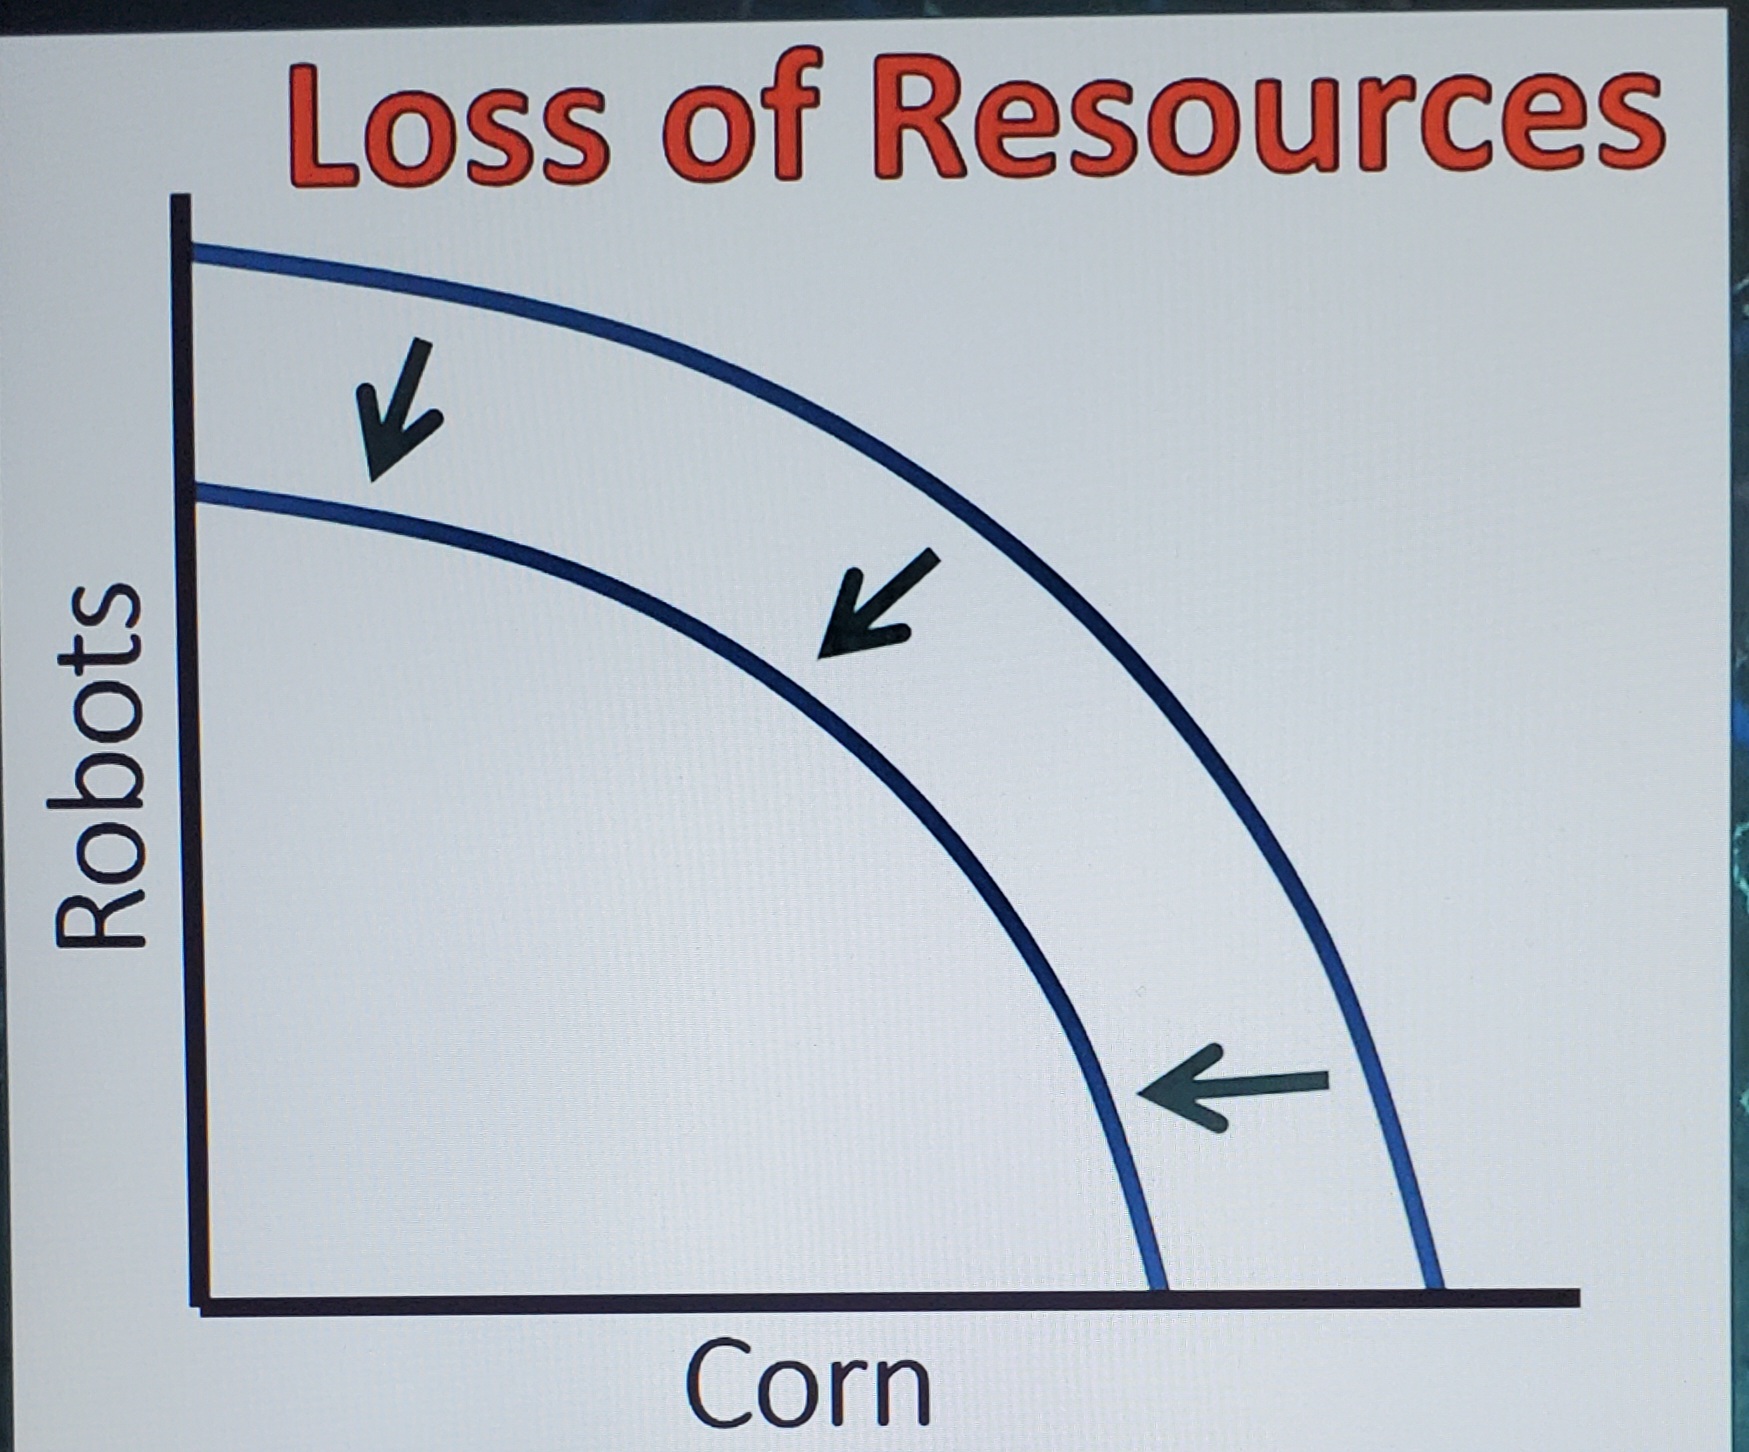
Loss of resources PPC
Loss of resources causes a shift inward
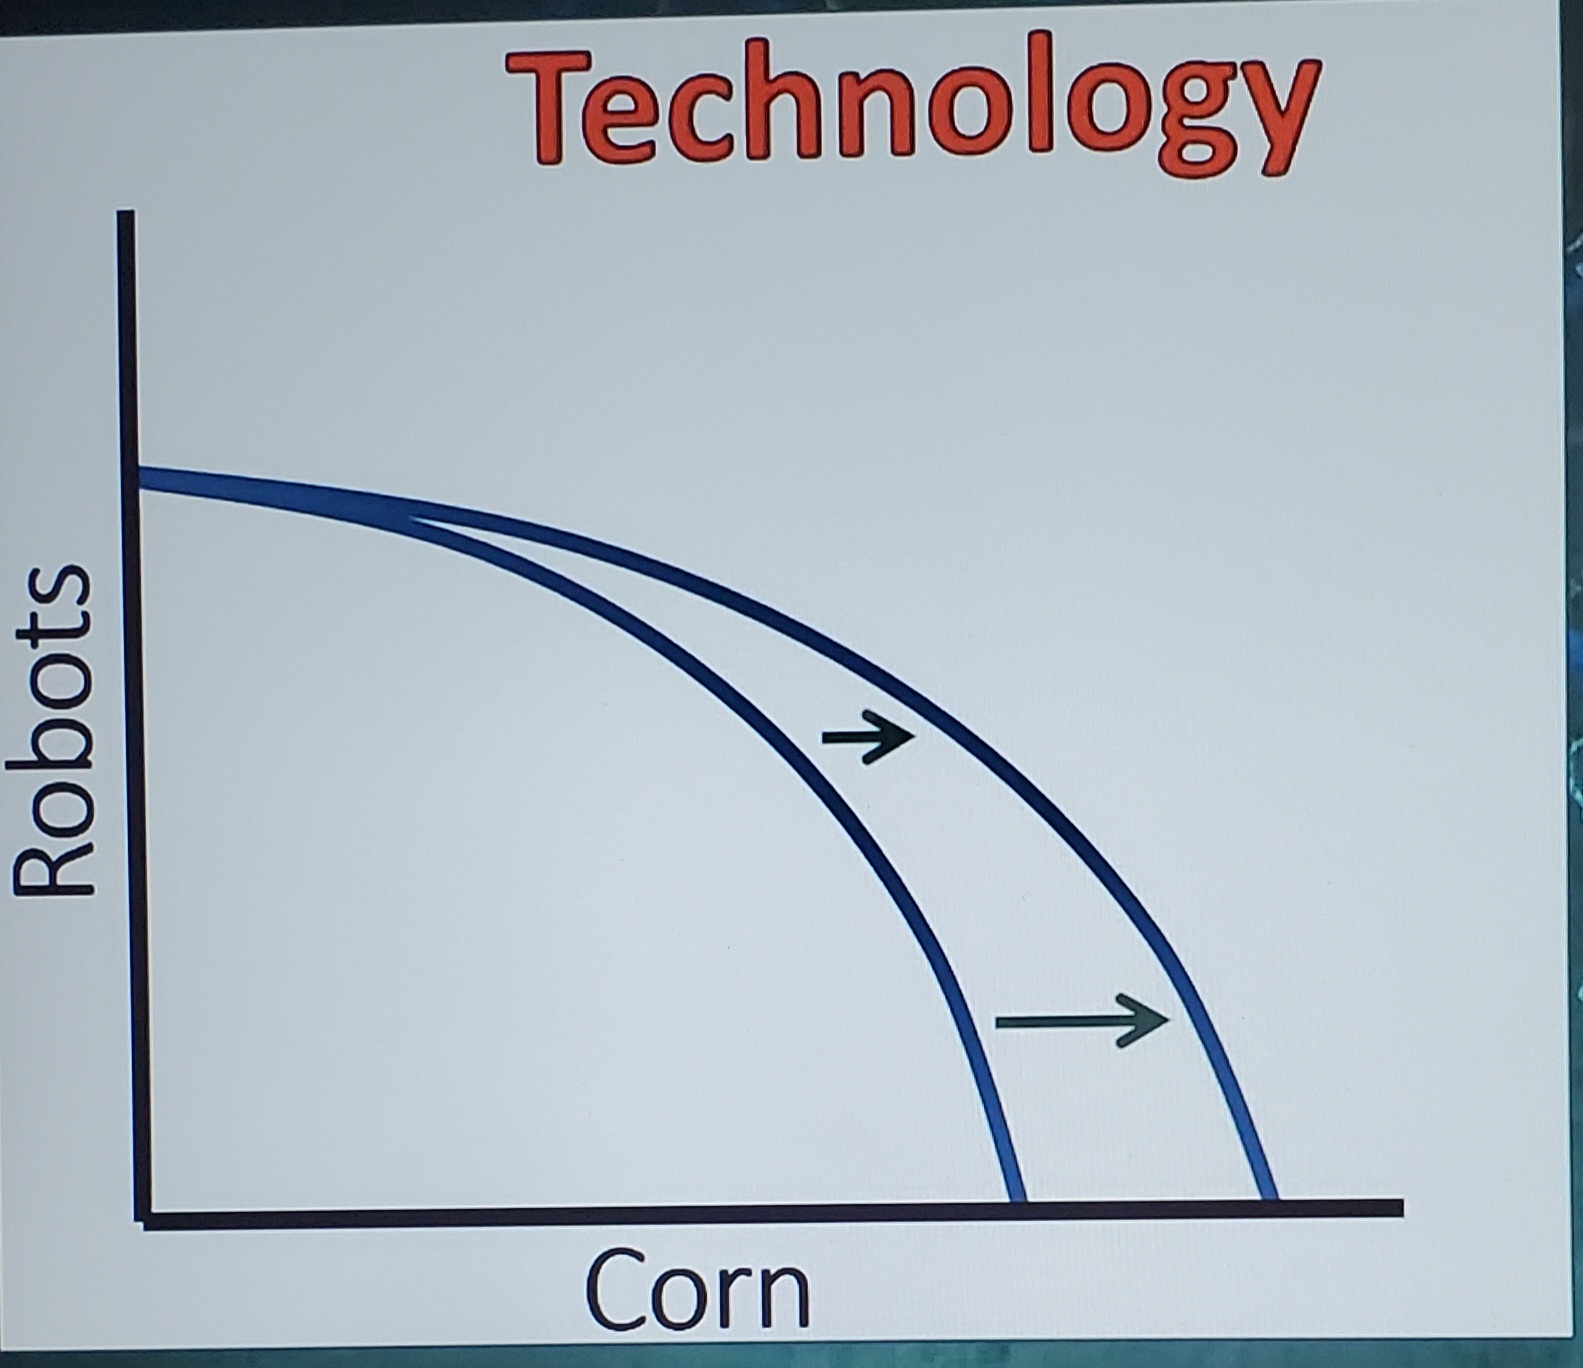
Technology PPC
produces in one curve but not the other

Absolute Advantage
ability to produce more or using fewer resources
Comparative advantage
The ability to produce something at a lower opportunity cost
Input opportunity cost equation
“It’s over” A = A/B

Input opportunity cost examples
AMY:
1 Break job = 1/6 painted cars
1 Painted Car = 6 break jobs
ERIC:
1 break job = 2/8 = ¼ painted cars
1 painted car = 8/2 = 4 break jobs
Output opportunity costs equation
“Other Over”
A = B/A

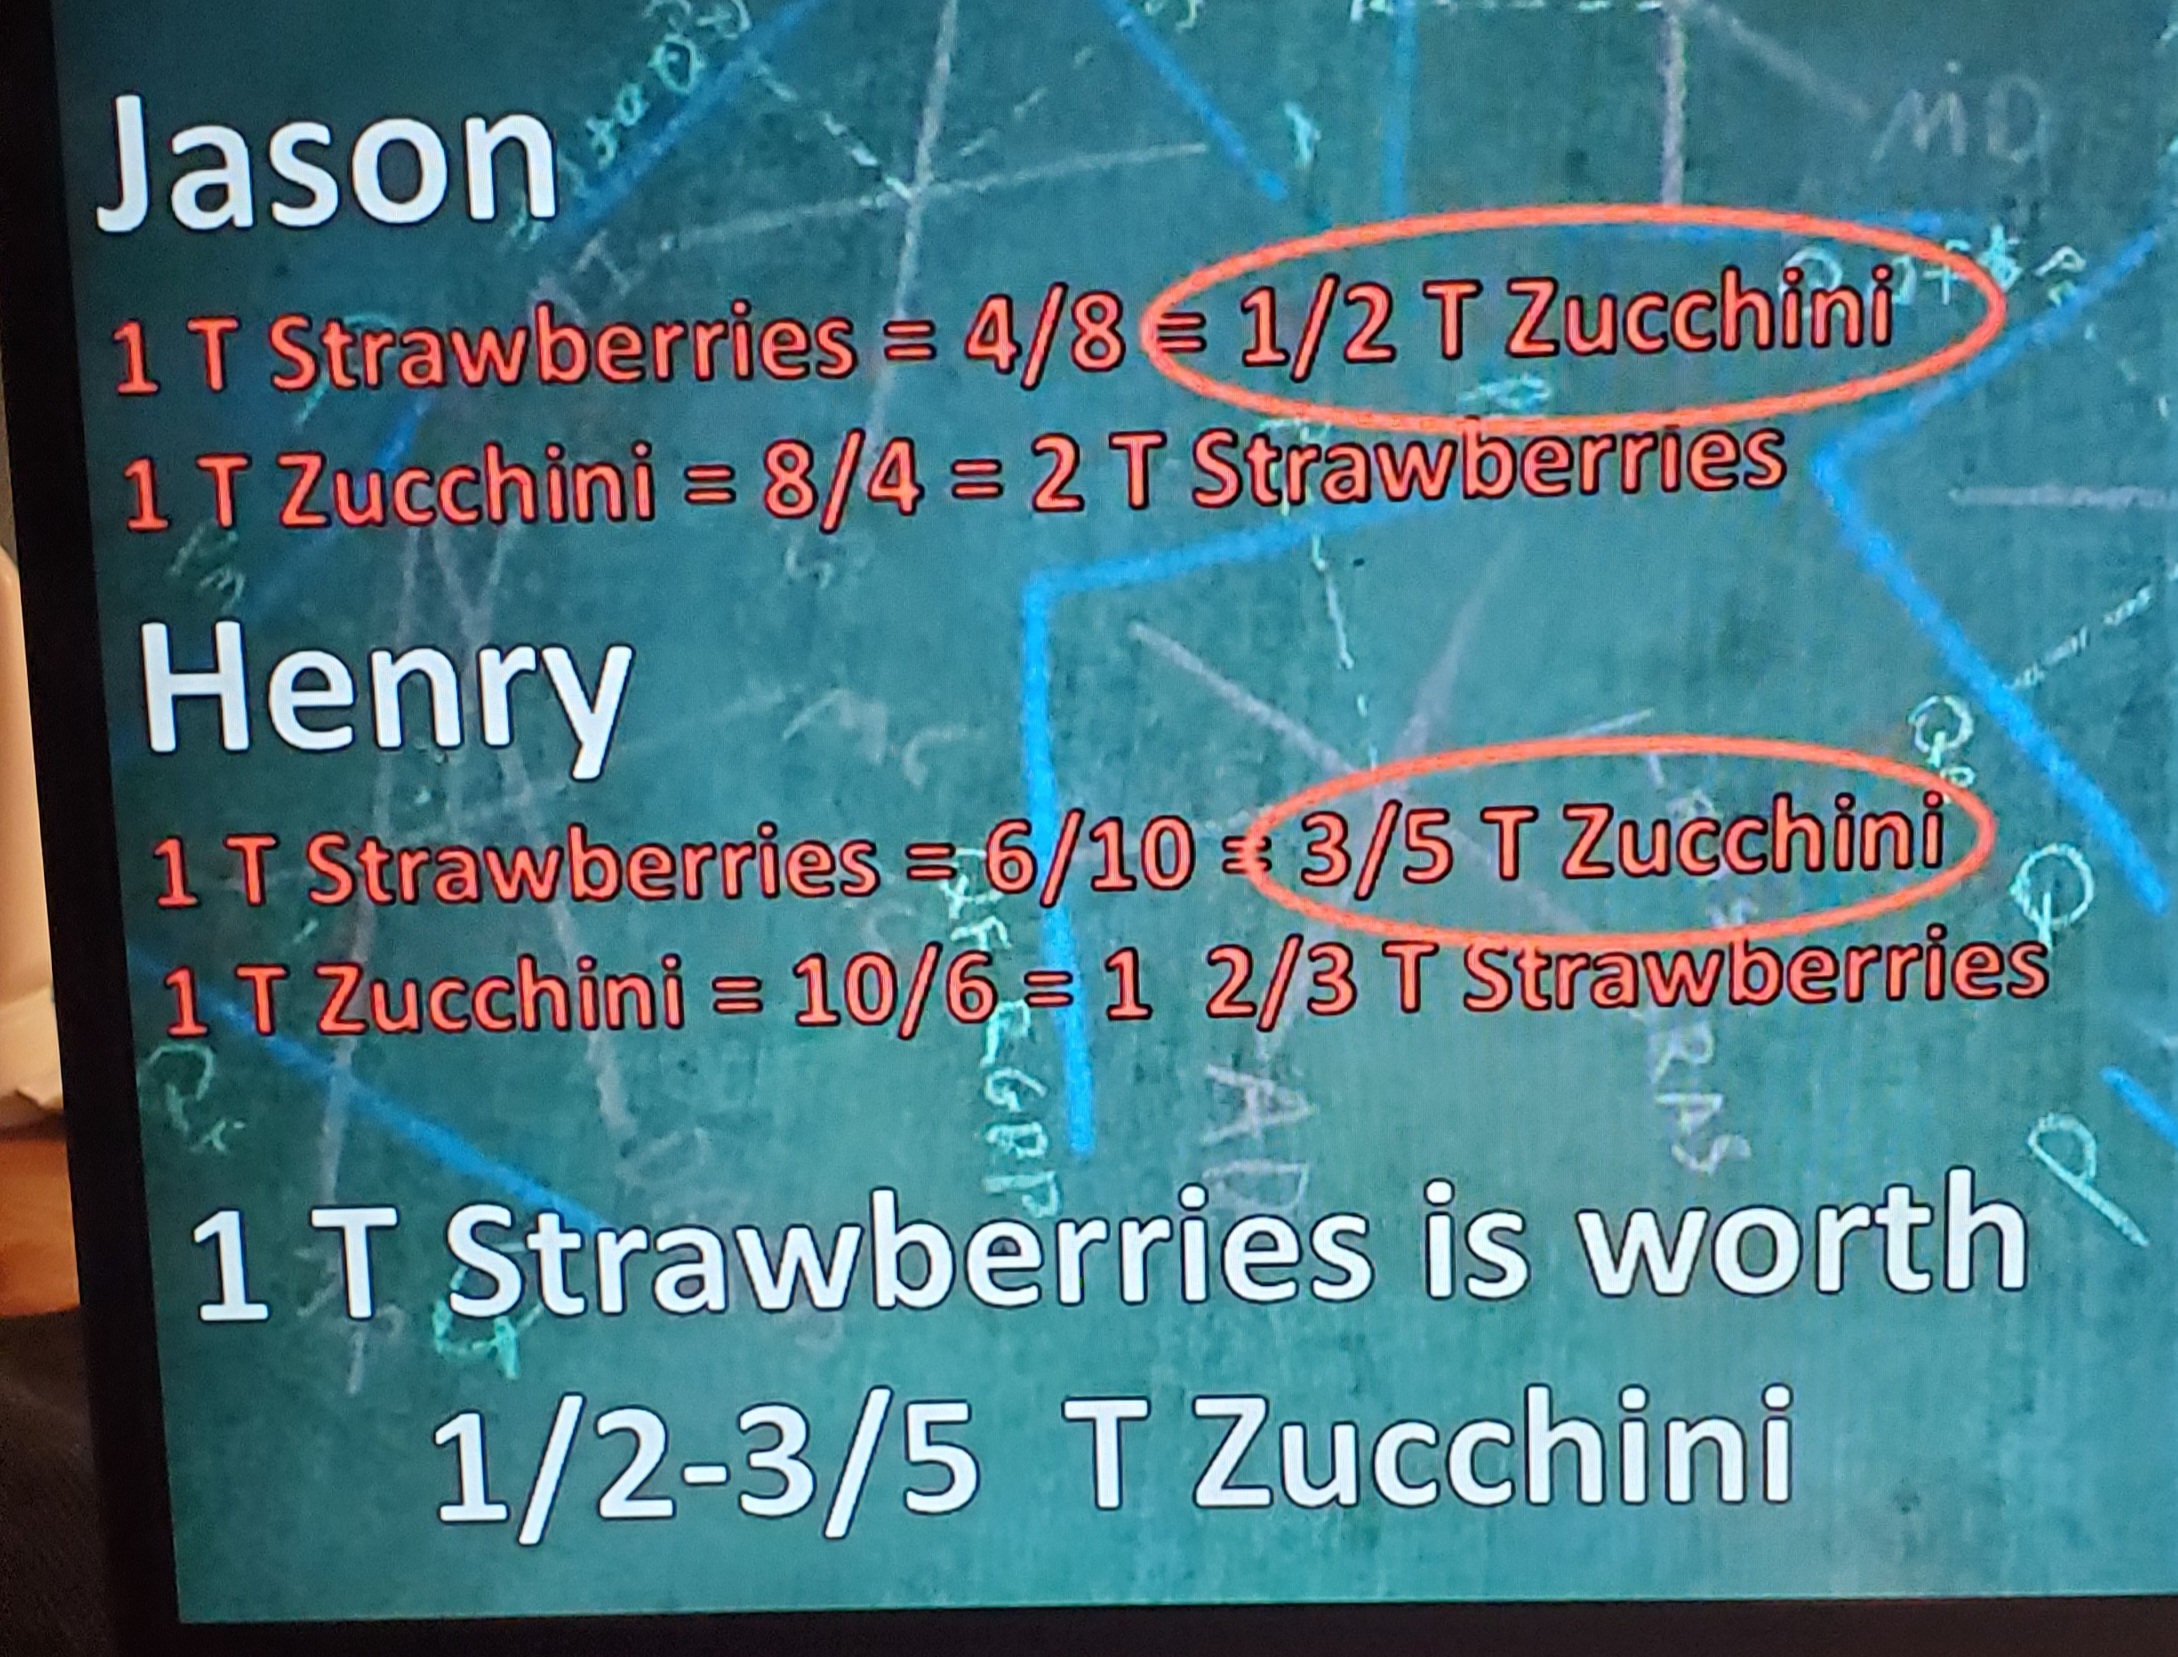
Output Opportunity Cost example
JASON:
1 T Strawberries = 4/8 = ½ Zucchini
1 T Zucchini = 8/4 = 2 T Strawberries
HENRY:
1 T Strawberries = 6/10 = 3/5 Zucchini
1 T Zucchini = 10/6 = 1 2/3 T Strawberries
Mutallt Beneficial terms of trade
will fall between opportunity costs. If outside of range, somebody is getting ripped off
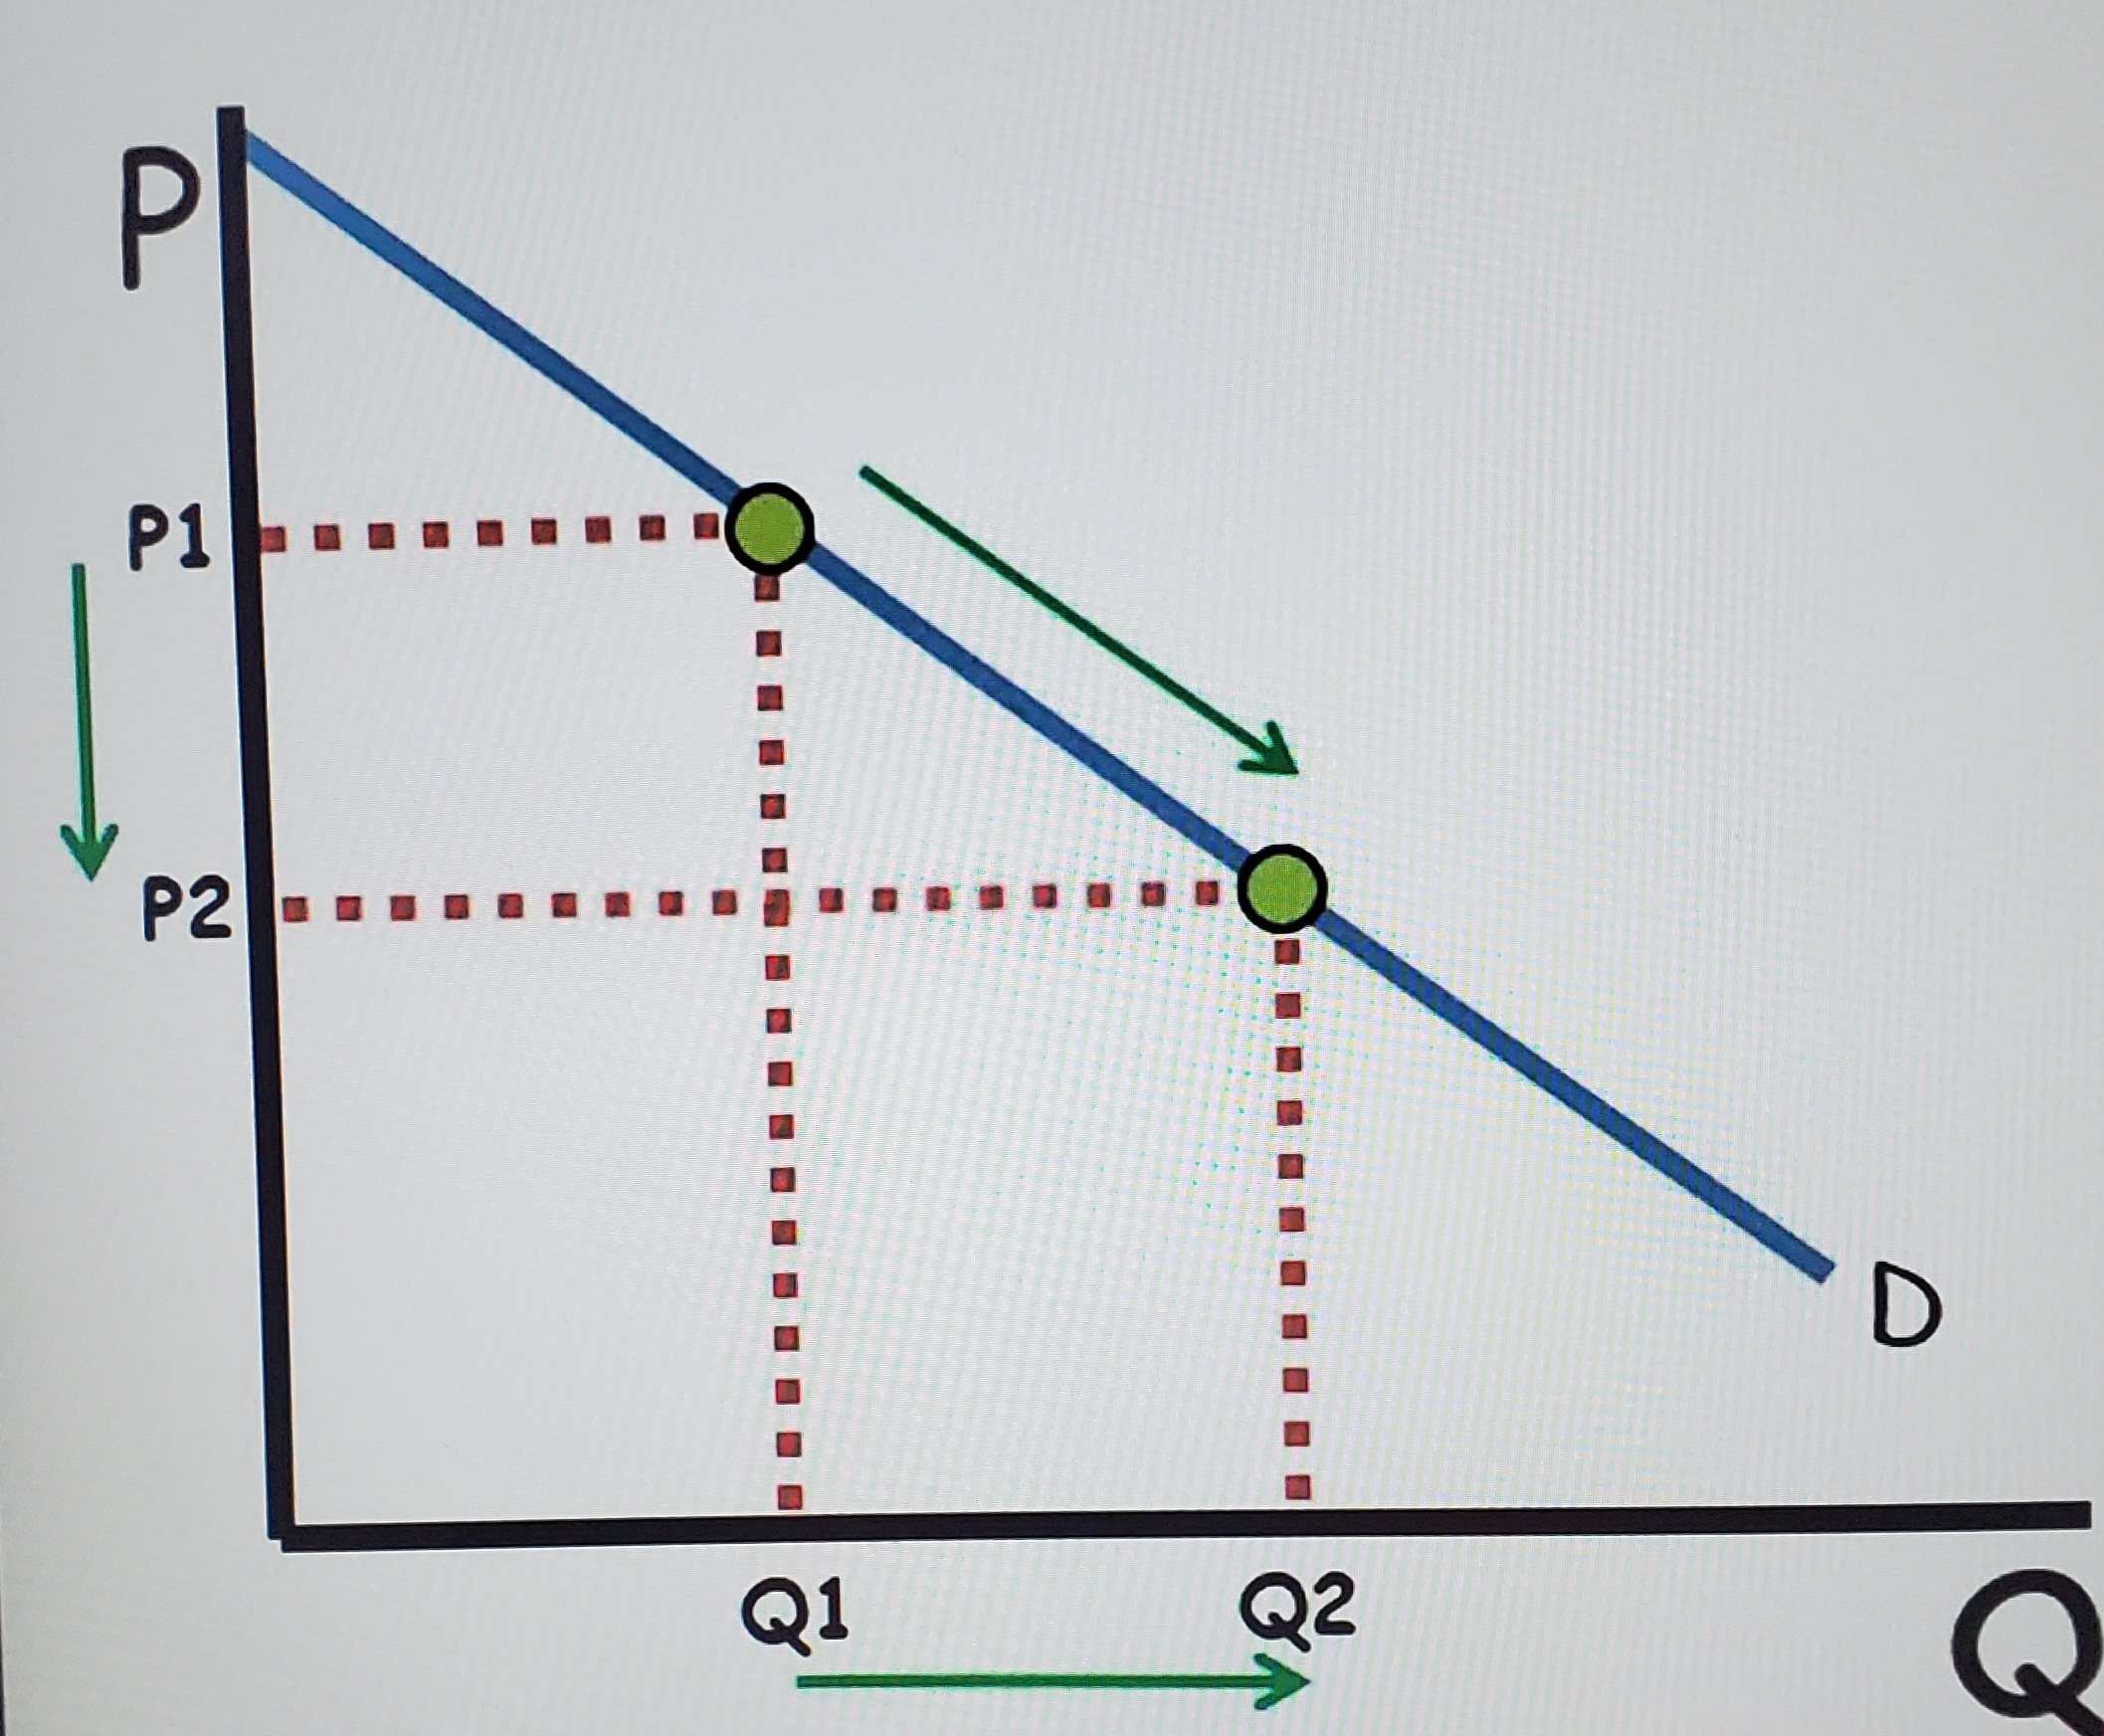
Law of demand
Ceteris Paribus, consumers buy more at low prices and less at high prices. Inverse relationship
What does price change
quantity demand (not demand)

Demand shifters
Tastes and Preferences
Market size (buyers)
Prices of related goods
Changes in income
Expectations (Black friday)

Substitute
When the price of one good goes up, the demand for the substitute of that good goes up
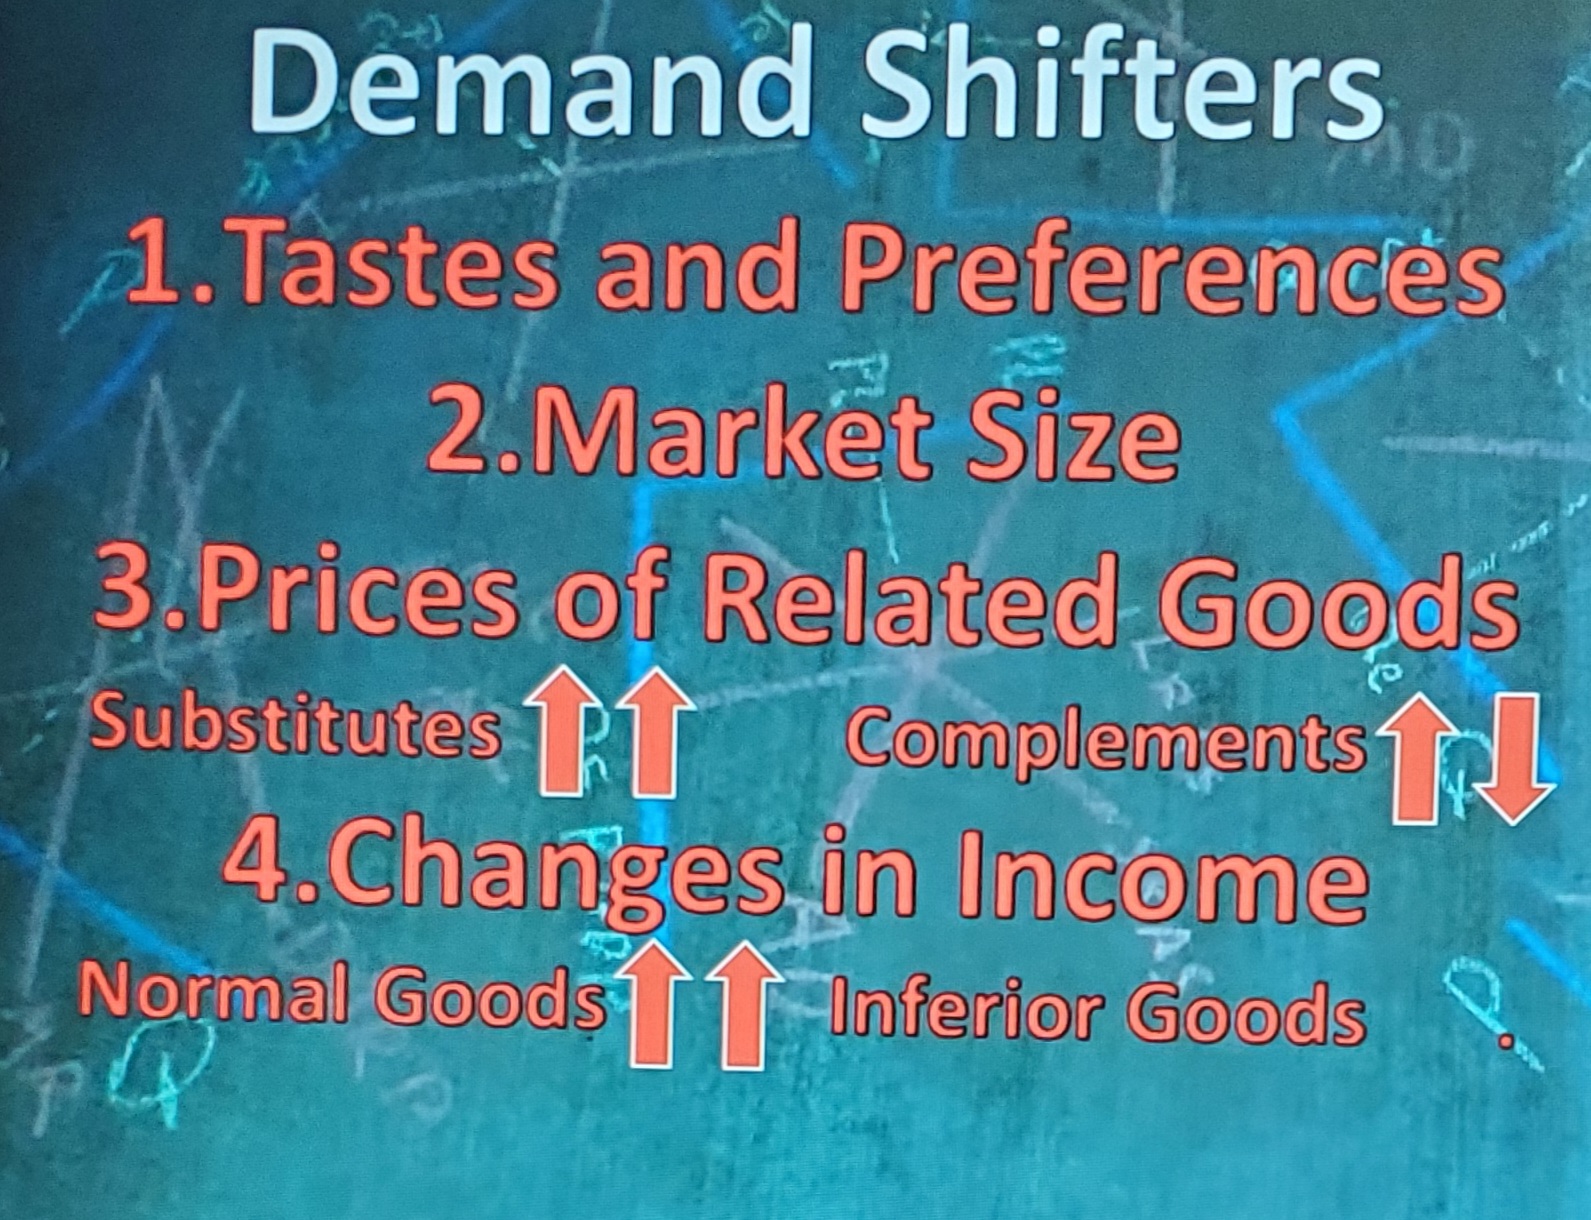
Complements
When the price of one good goes up, the demand for the complement goes down

Normal goods
Increase in consumer income, increase demands and vice versa

Inferior goods
When income rises, demand for inferior good decrease
Demand curve right
Increase in demand (graph)

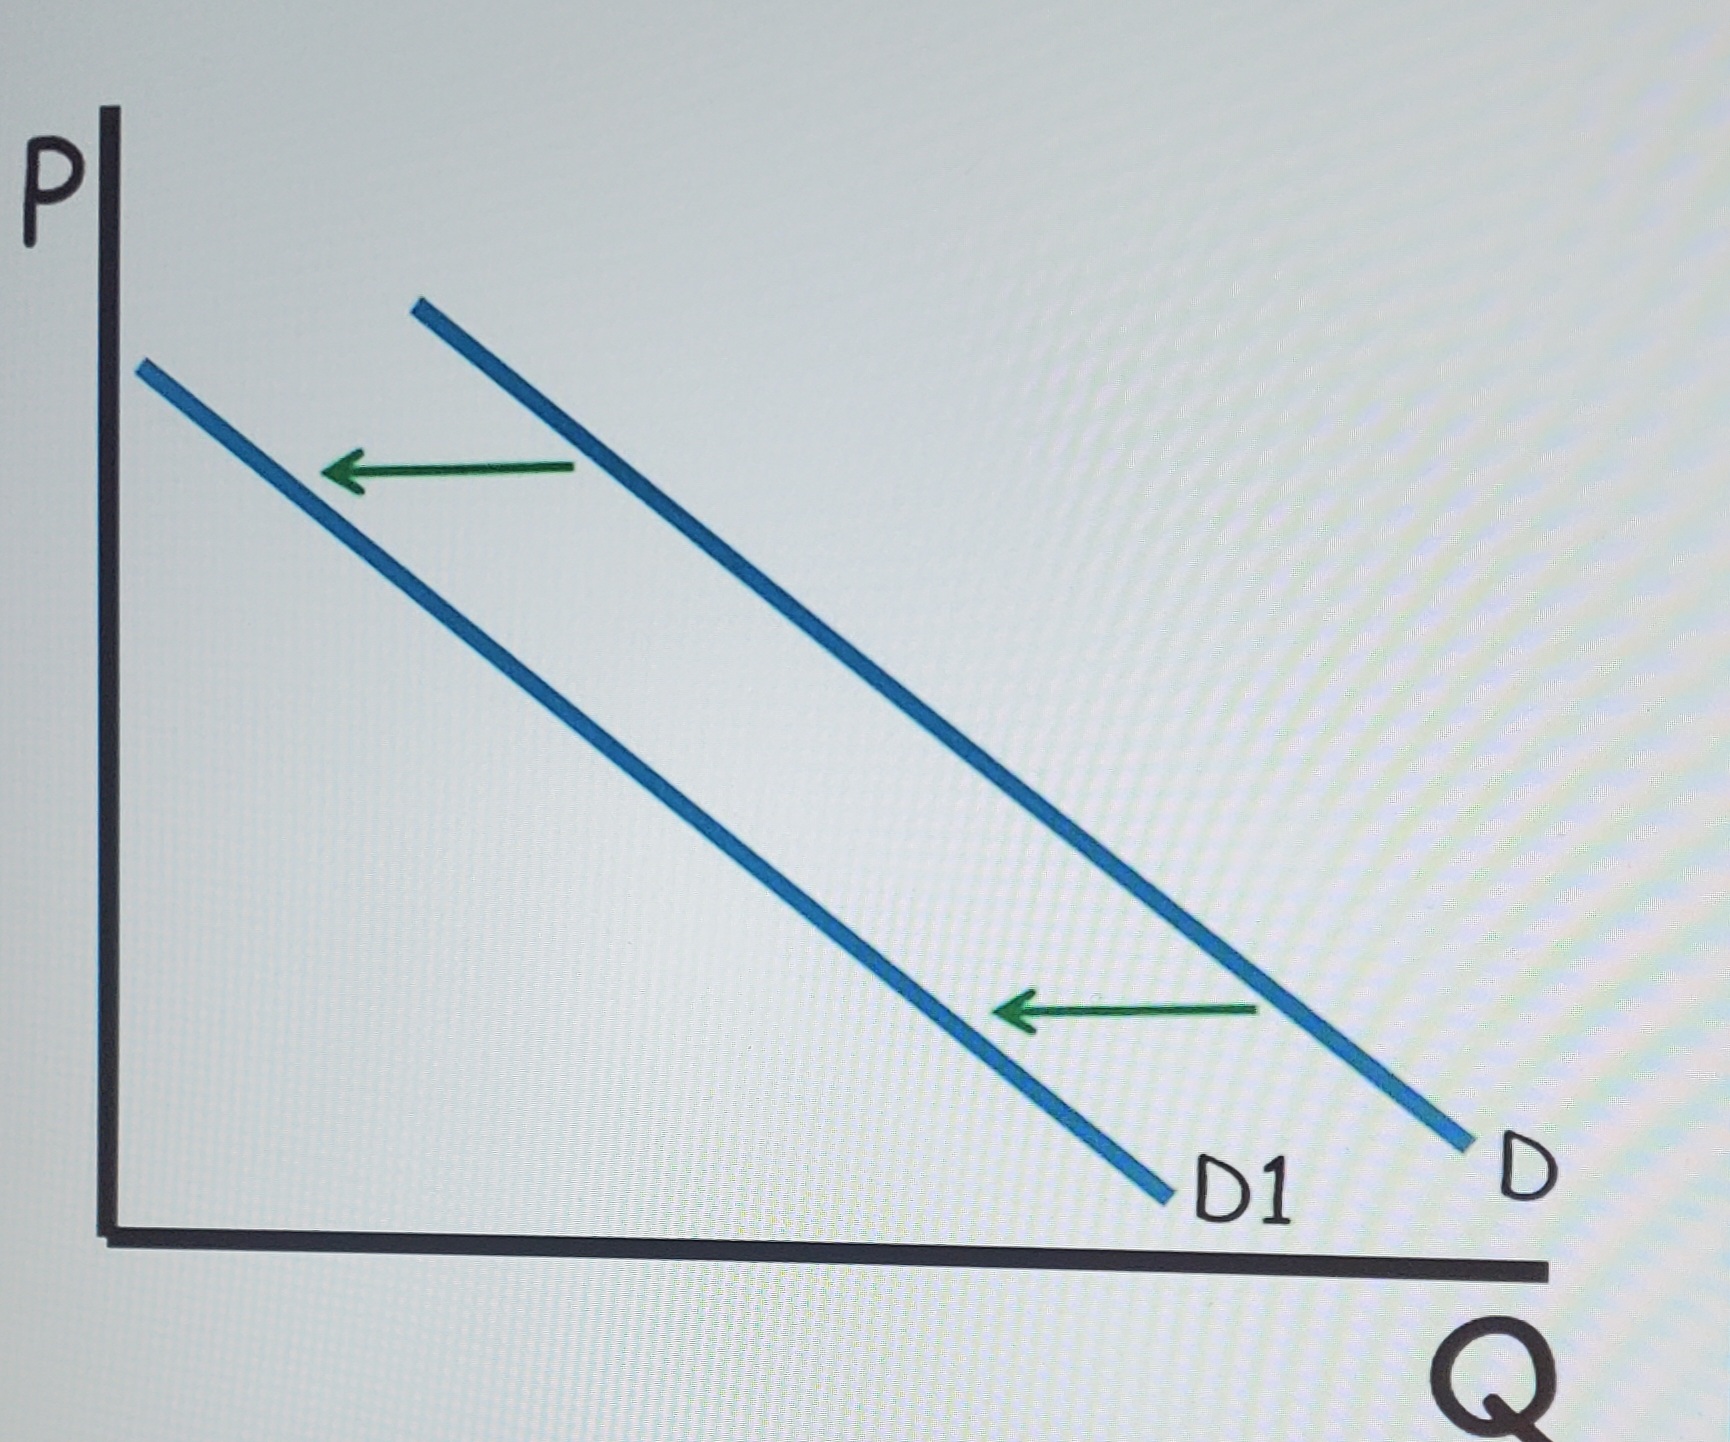
Demand curve left
decrease in demand (graph)
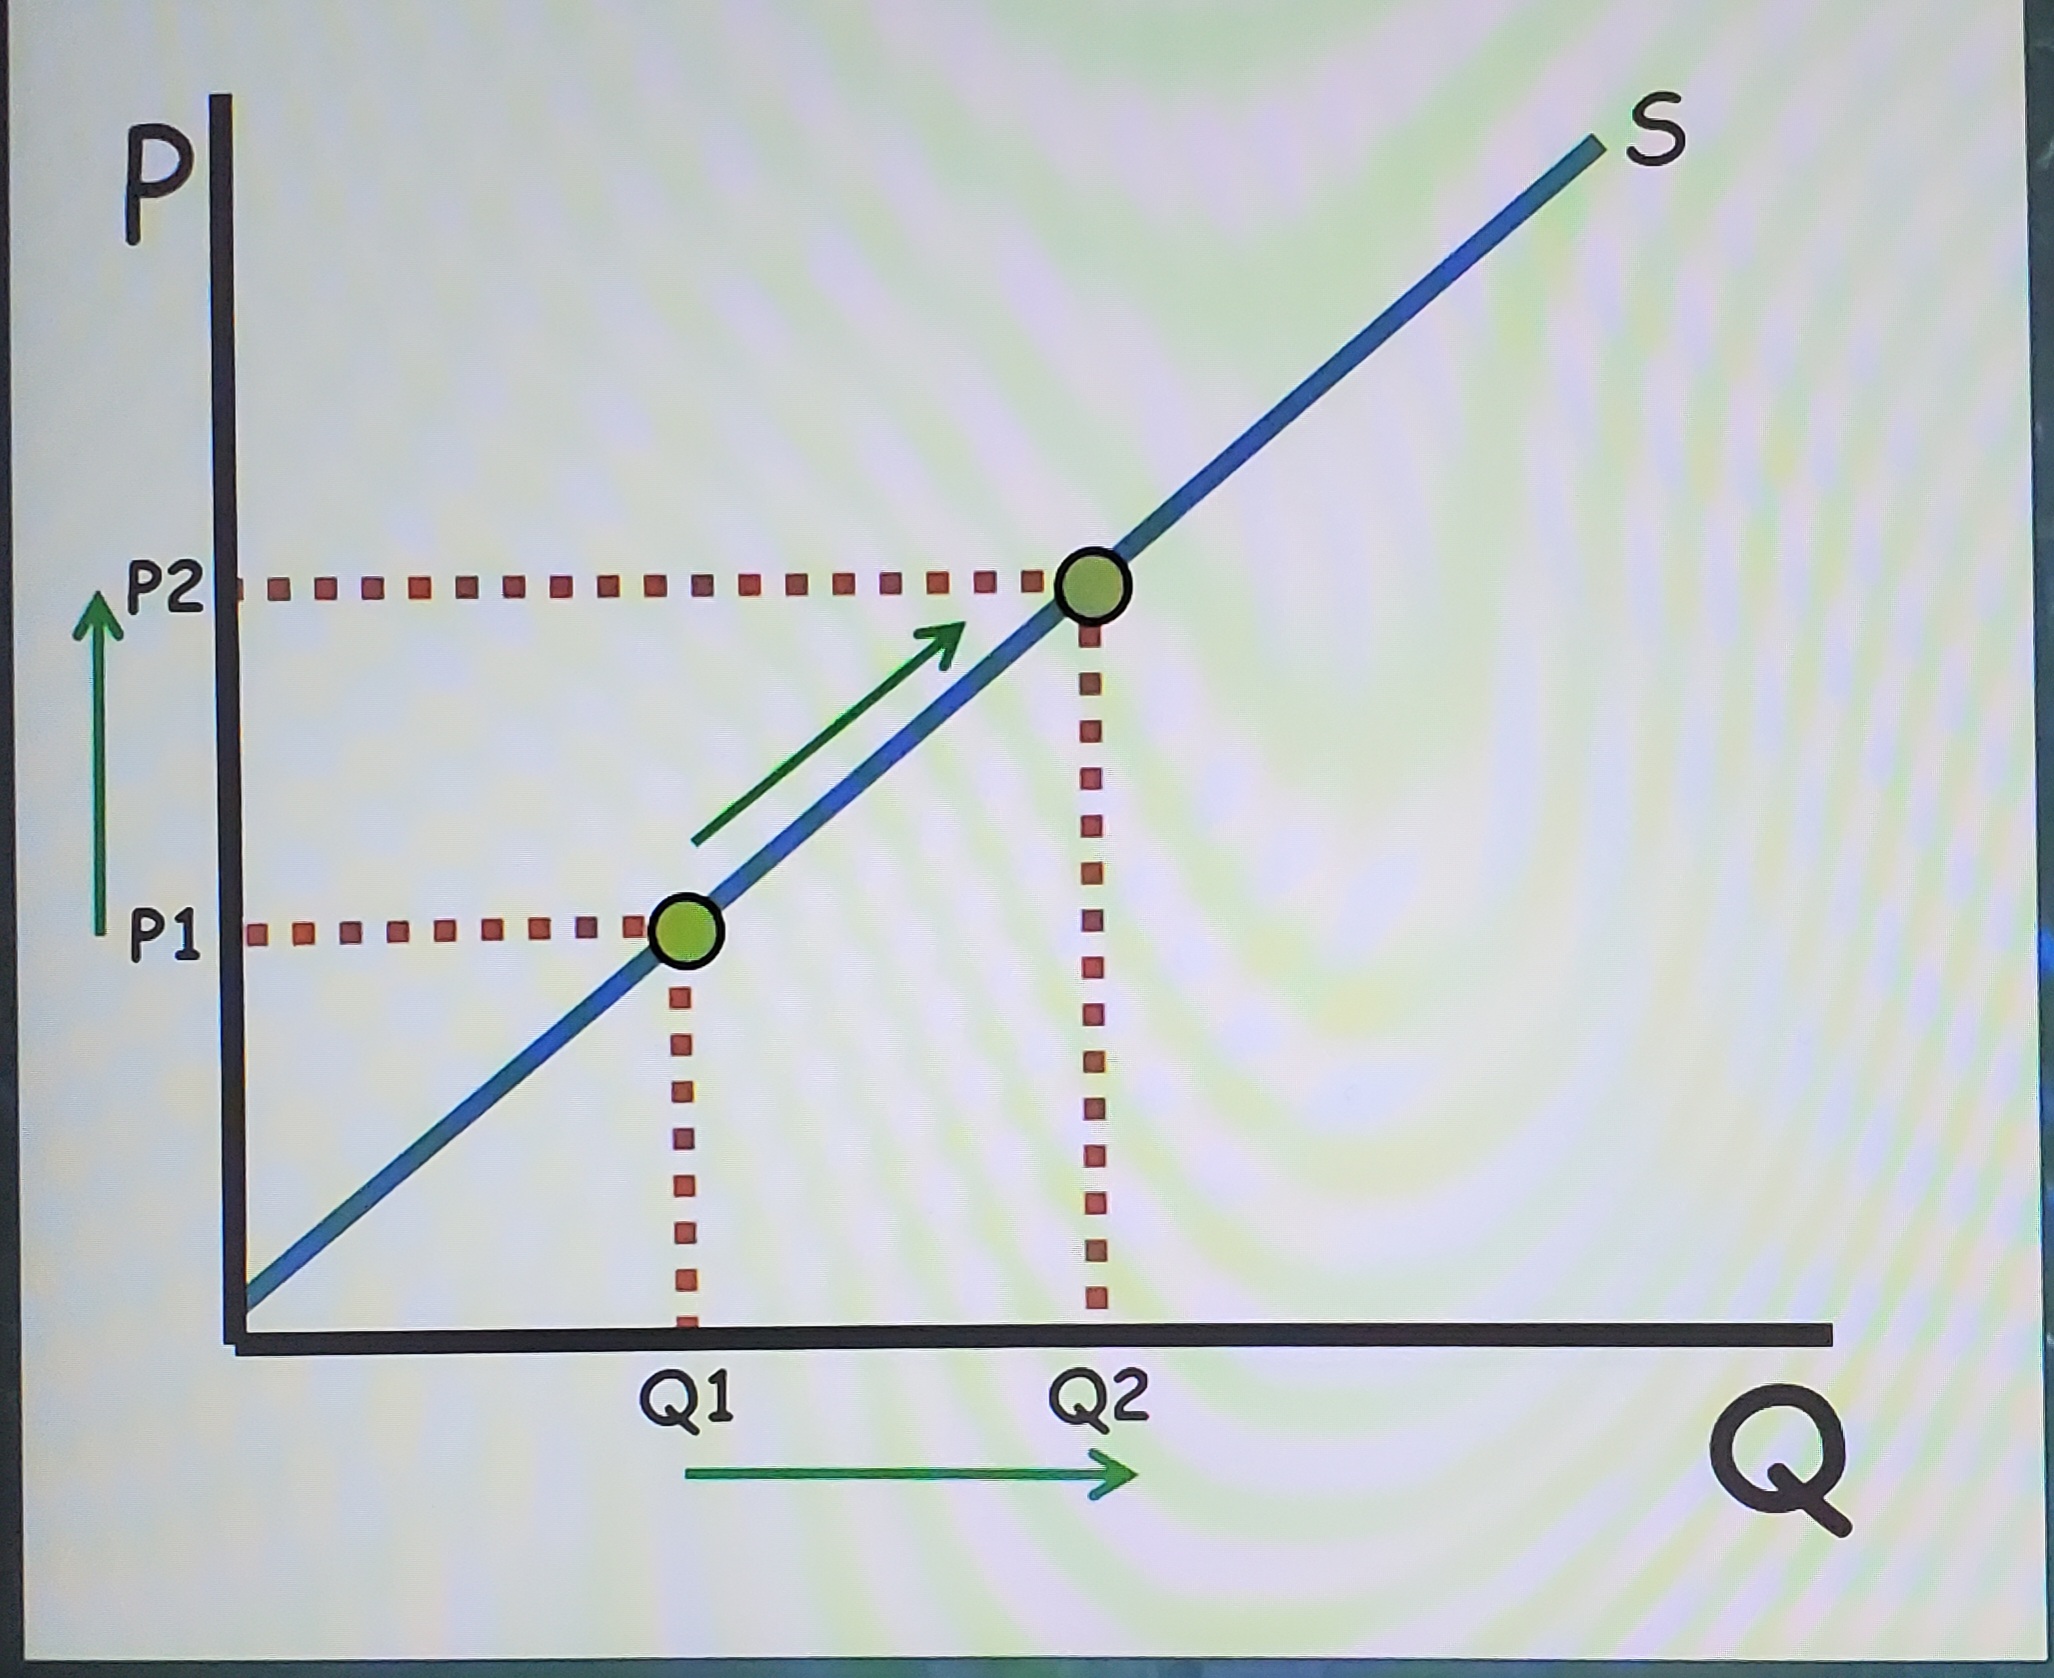
The law of supply
Ceteris Paribus, producers sell more at high prices and less at low prices
Price changes… (Supply)
Quantity (not supply)
Supply shifters
input prices (if price of resource goes up, supply goes down, vice versa)
Government tools (subsidies)
Number of sellers (competition)
Technology
Prices of other goods (if price of wheat goes up, farmers make more wheat and decrease supply of corn)
Producer Expectations

Supply shift right
increase in supply (graph)
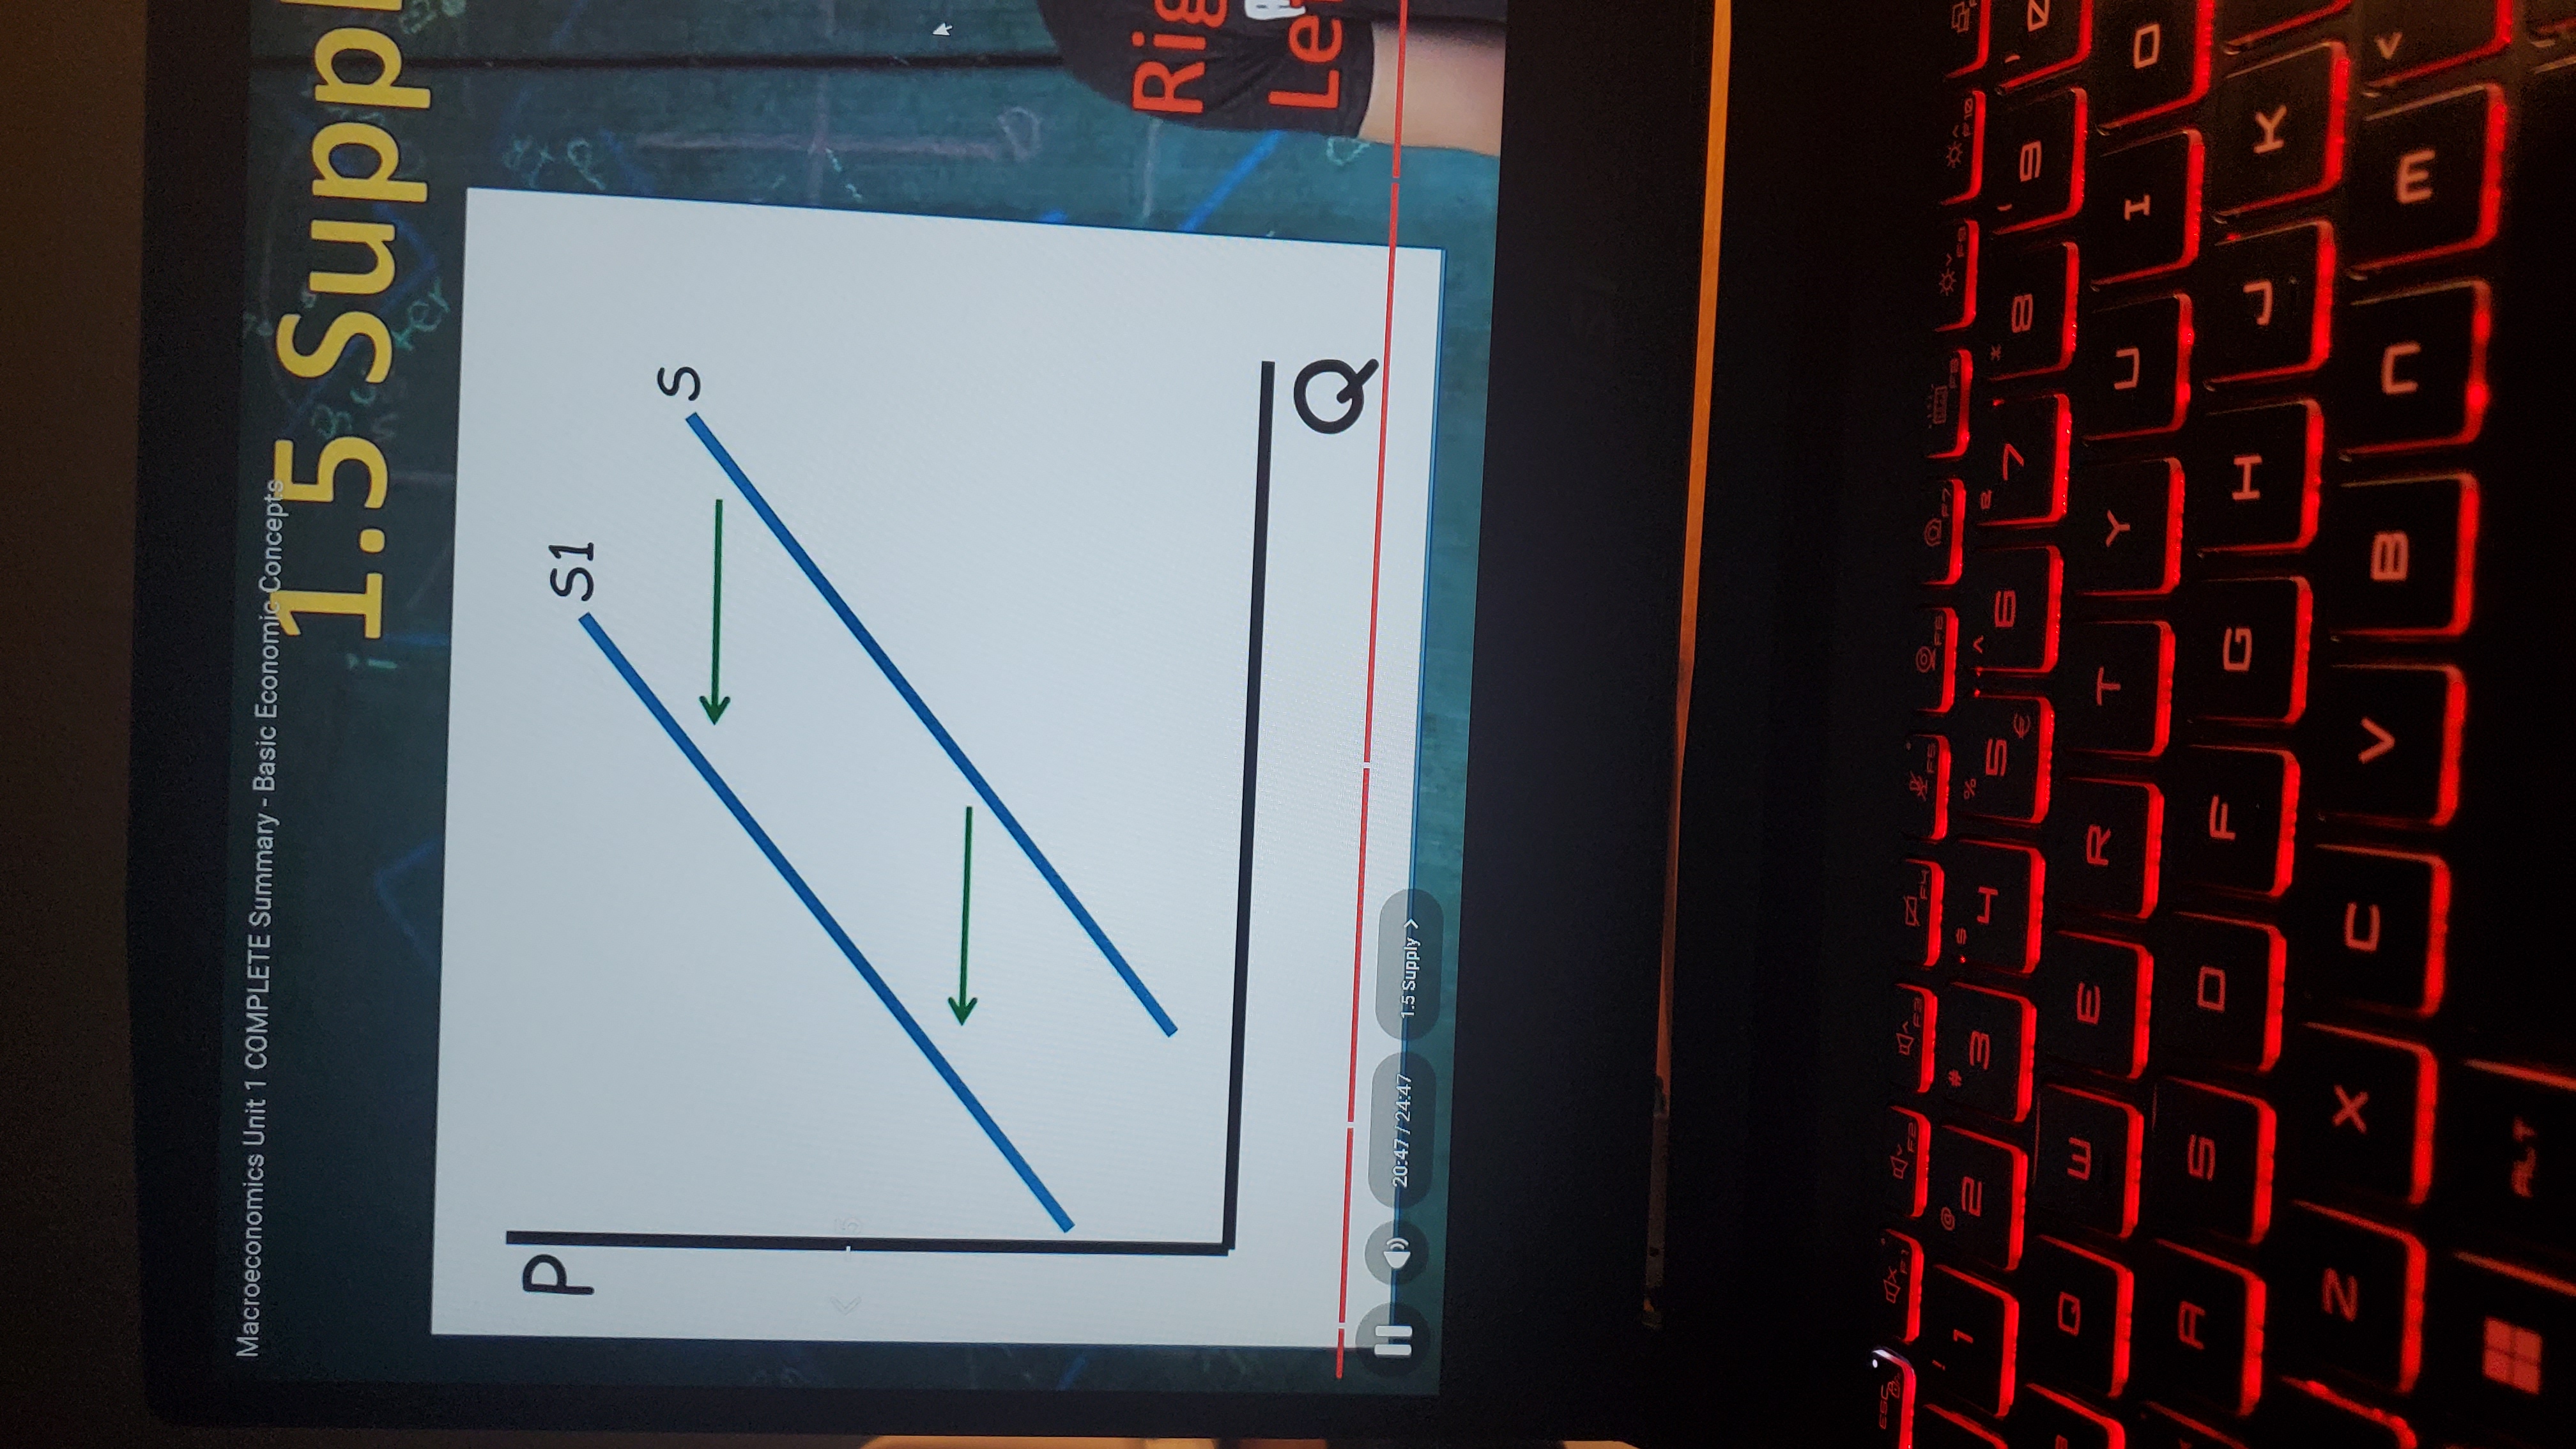
Supply shift left
decrease in supply (graph)
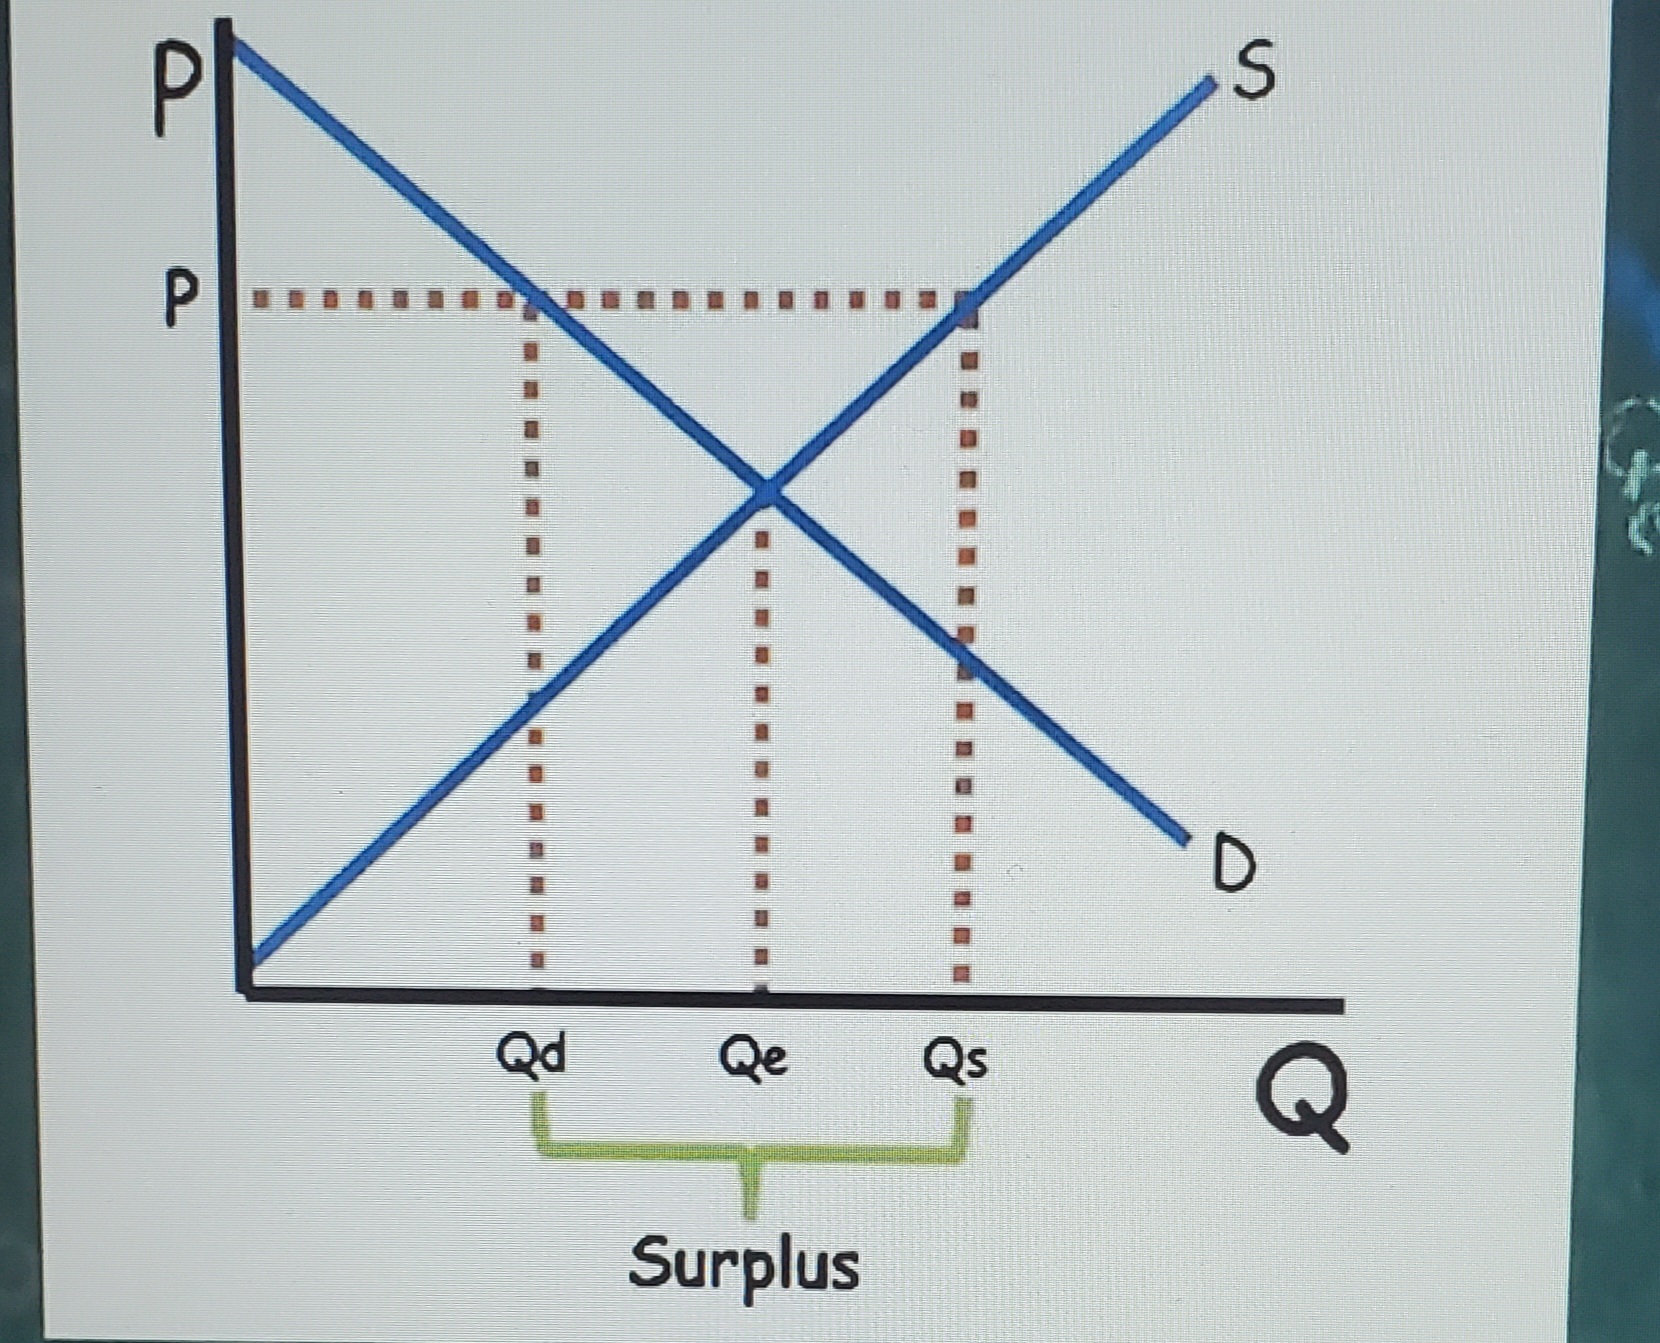
Price above equilibrium
Surplus - Price falls to equilibrium
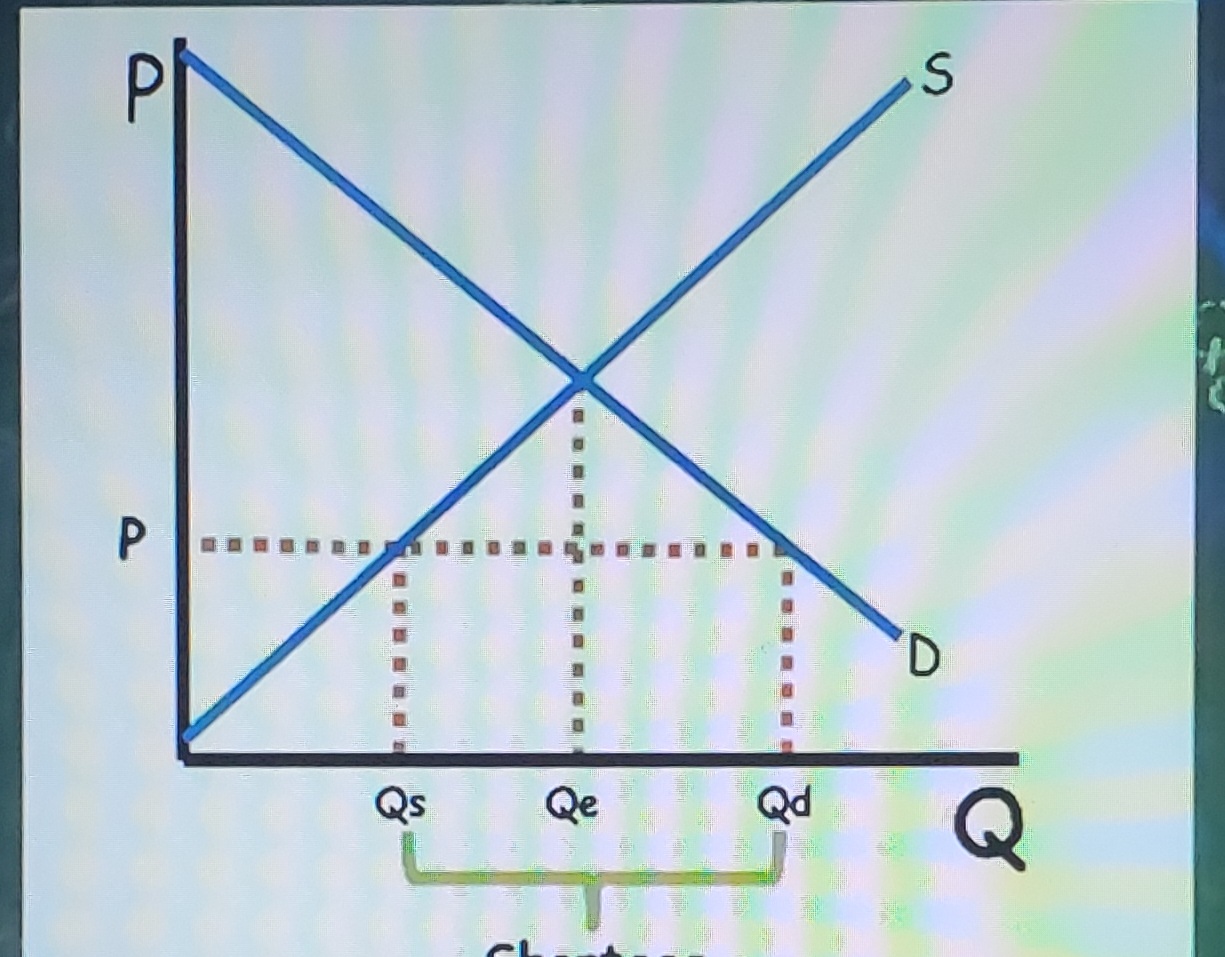
Price below equilibrium
Shortage - price rises to equilibrium
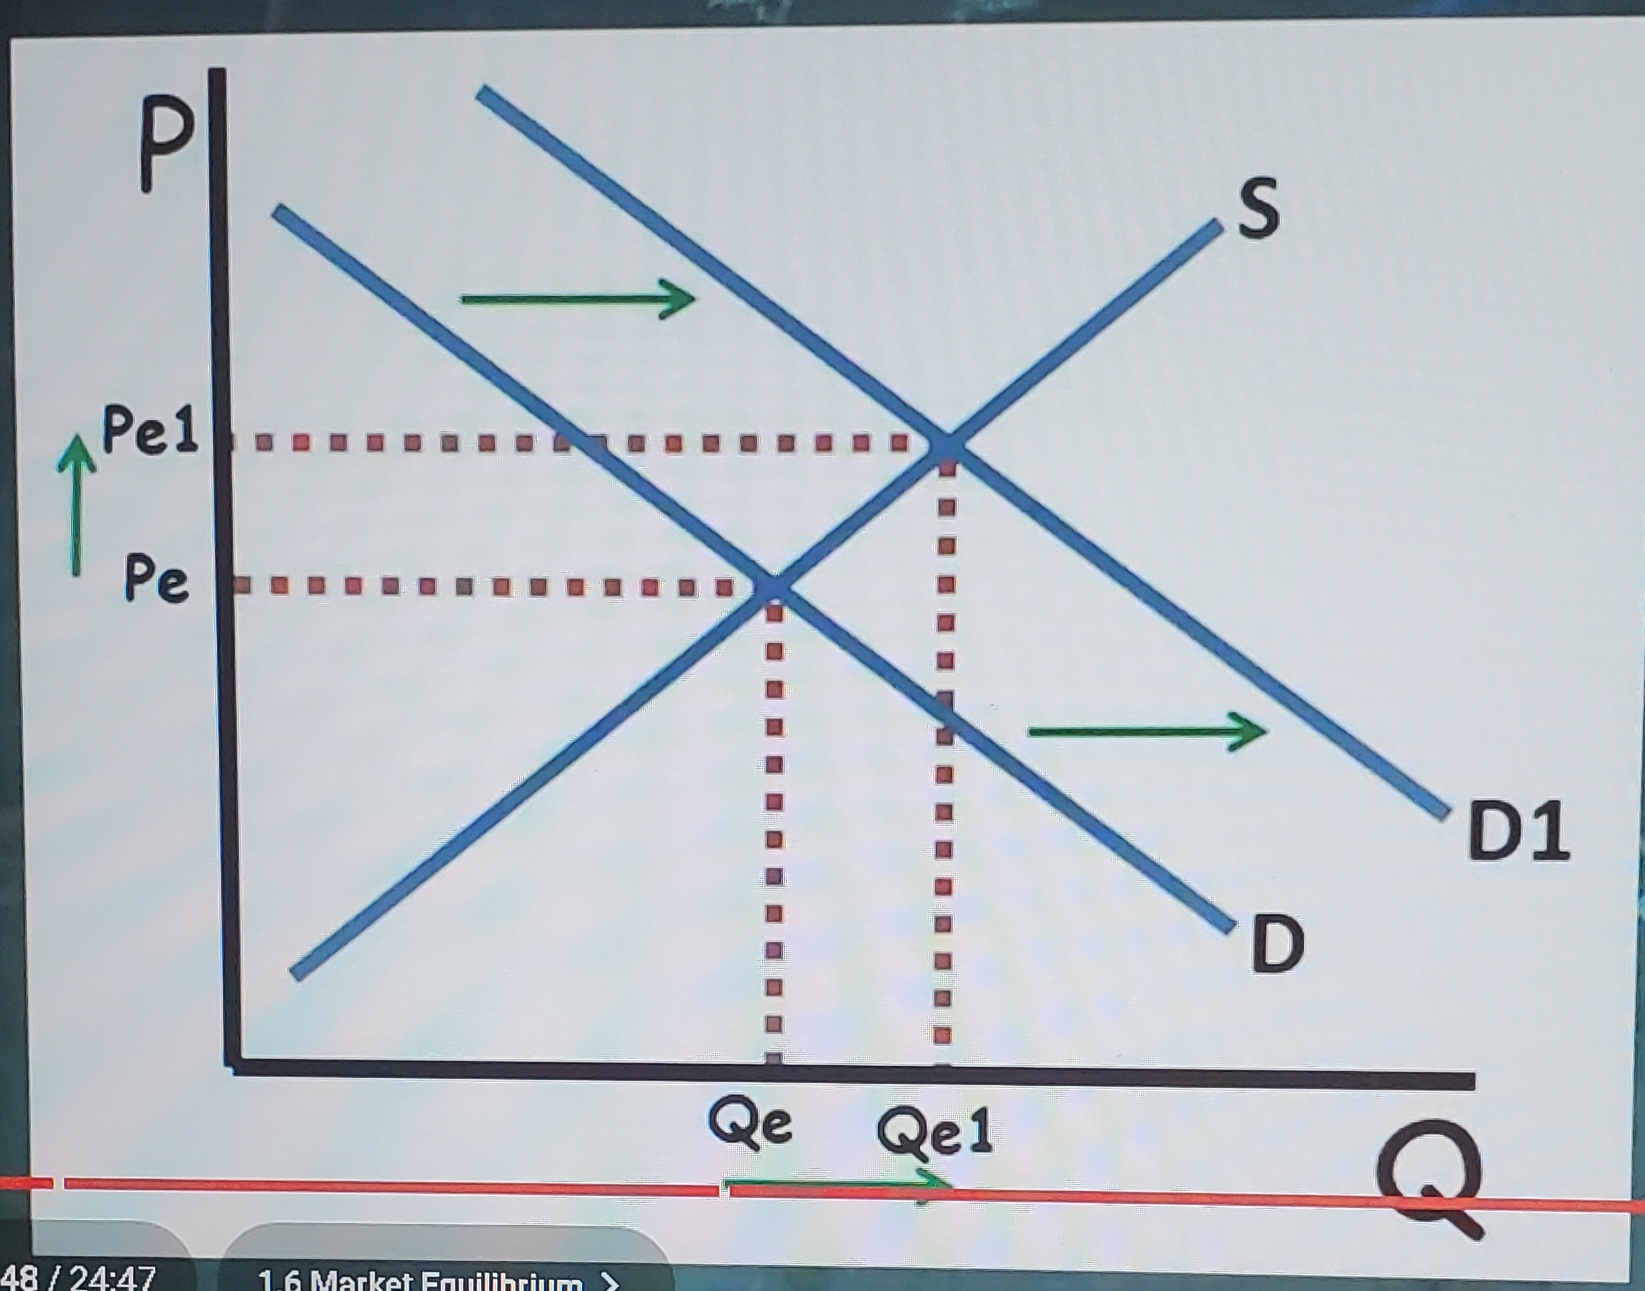
Increase in demand (Changes in Equilibrium)
causes equilibrium price and the equilibrium quantity to increase
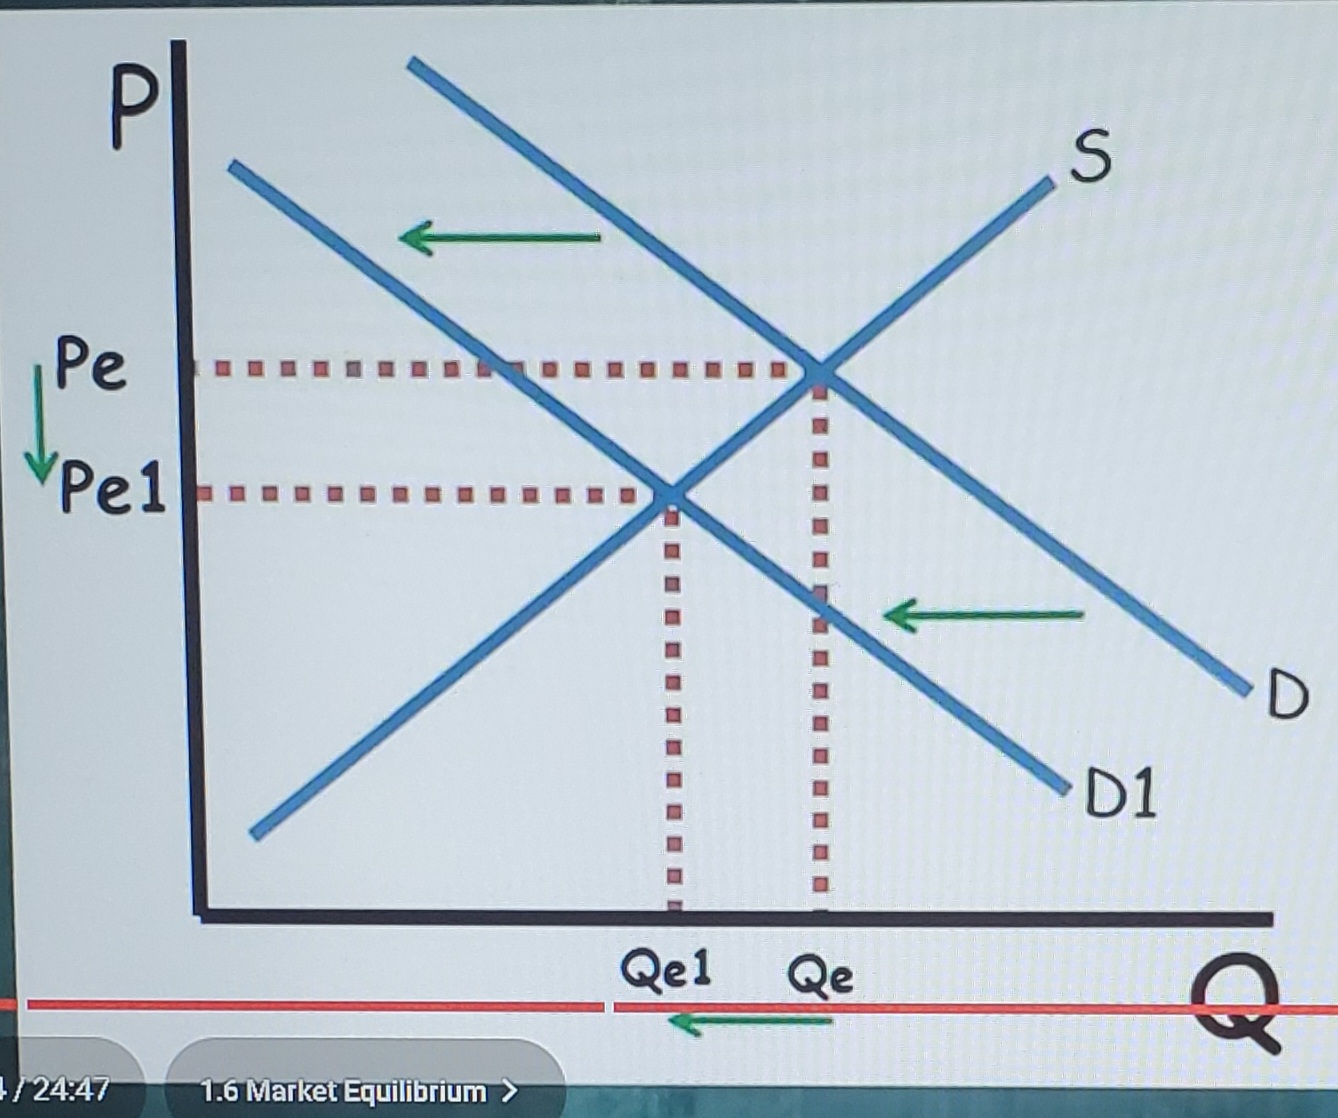
Decrease in demand (Changes in equilibrium)
causes equilibrium price and equilibrium quantity to decrease
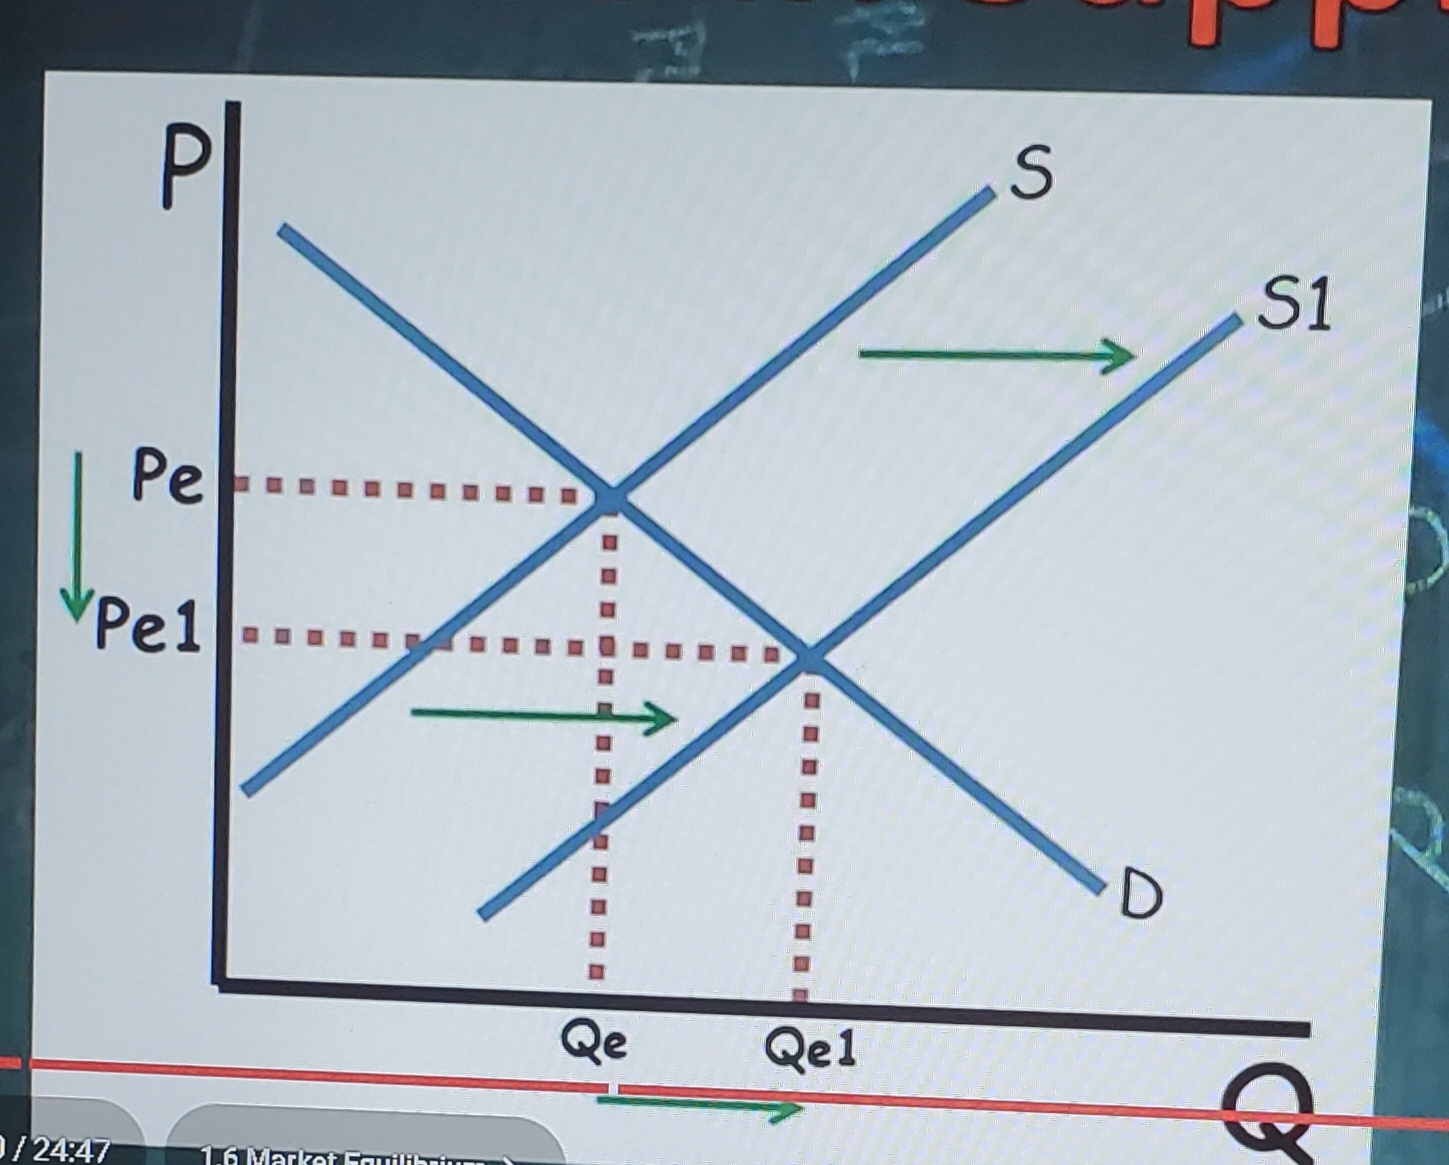
increase in supply (changes in equilibrium)
causes equilibrium price to decrease and equilibrium quantity to increase
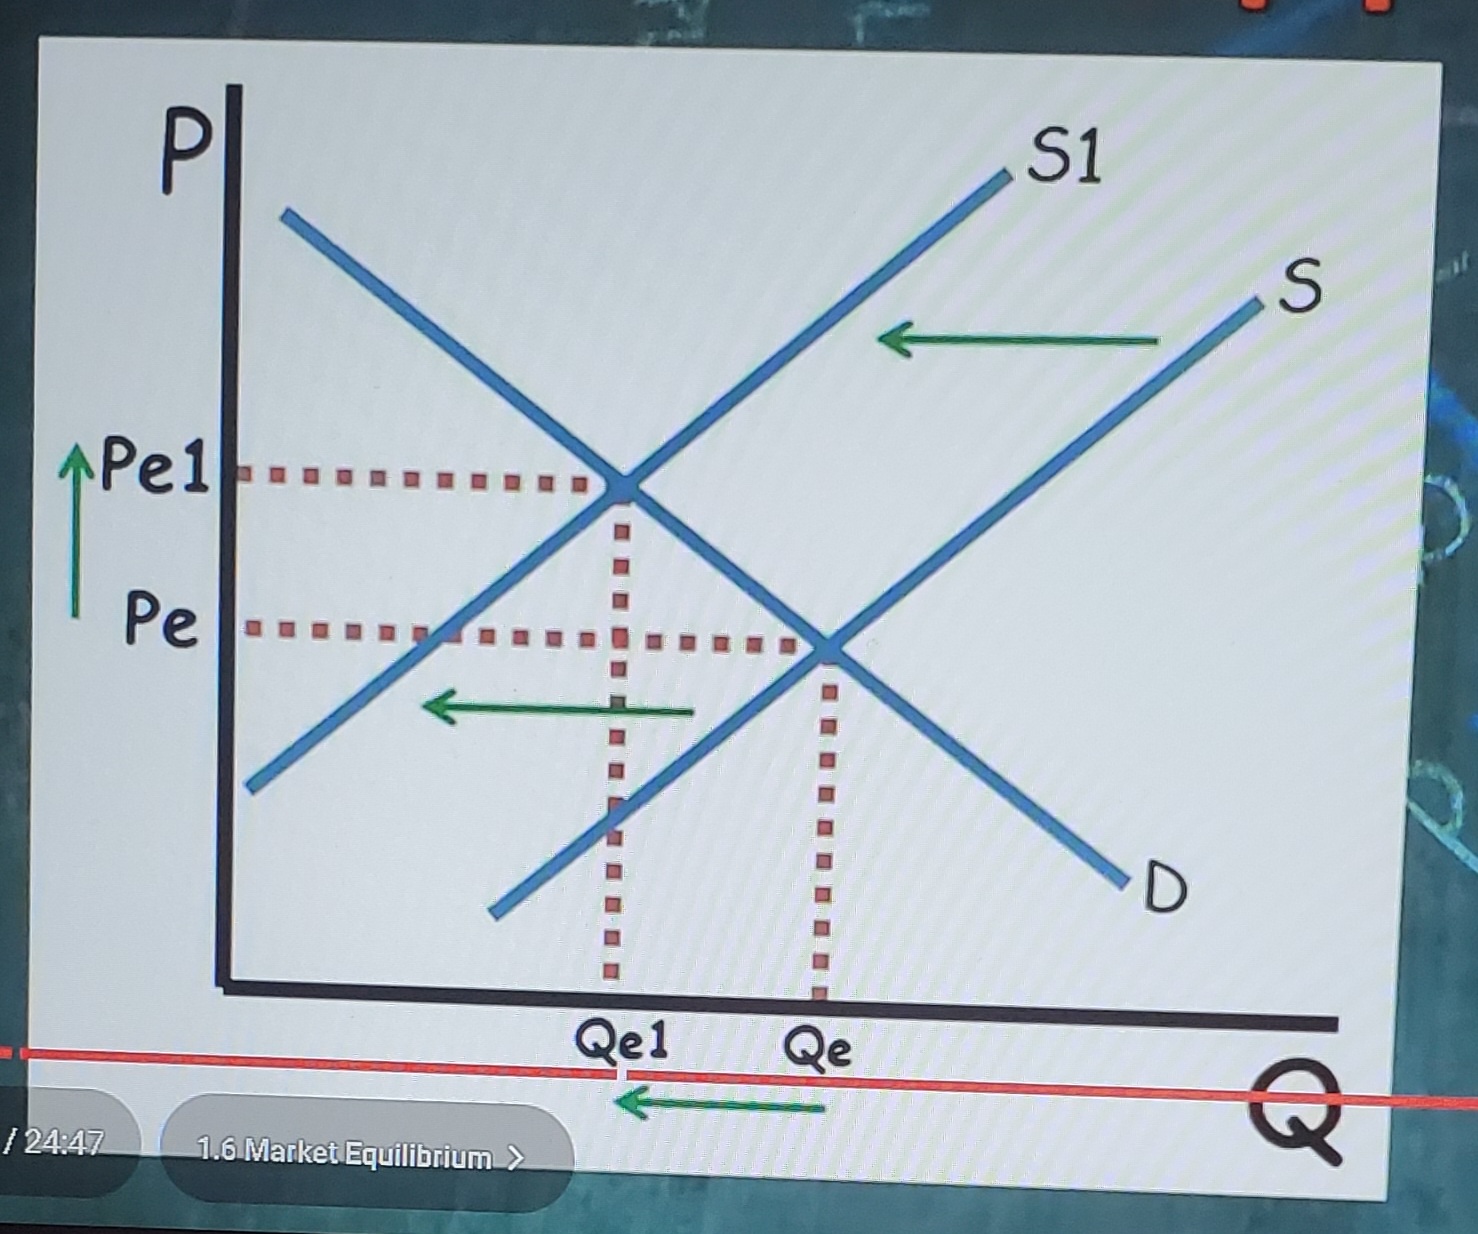
decrease in supply (changes in equilibrium)
causes equilibrium price to increase and equilibrium quantity to decrease