alla*
 Call Kai
 Learn
Learn Practice Test
 Spaced Repetition
 Match
Match Flashcards
 Knowt Play
1/157

There's no tags or description
Looks like no tags are added yet.
Name | Mastery | Learn | Test | Matching | Spaced | Call with Kai | Chat |
|---|
No analytics yet
Send a link to your students to track their progress
158 Terms
Social organizations:
Solitary
Pairs
Family groups
Herds/Flocks
Complex societies
Complex societies/Eusociality, social organisation
The highest level of social organization
Overlapping generations within a colony of adults
Division of labour into a caste system:
Single reproductive female (queen)
Sterile workers
Drones (male)
Soldiers
Cooperative care of brood
Costs and benefits of living in a group
Costs:
Greater conspicuousness
Easier to see a big group of animals
Competition
Food sharing
Dominance disputes
Disease transmission
Reduced reproductive fitness
Infidelity
Inbreeding
Infanticide
Benefits:
Reduced predation risks
“Many eyes” effect
Confusion by blending in
Information sharing
More reliable access to mate
Increased success in accessing food
Ability to take down larger pray
Ability to mob larger predators of kills
Shared rearing of offspring
Energy conservation
I.e. huddling together
The selfish herd
A theory based on the assumption that predation risk is not evenly distributed across positions within a group
Individuals within a population attempt to reduce their predation risk by putting other conspecifics between themselves and predators
Edge effect
Higher exposure to predation risk at the edge of a group
Creates competition for good positions
Consider motivation vs. risk (e.g. hunger)
Part of the selfish herd theory
Position is affected by: social status, age, health, food motivation, reproductive status
Domain of danger
A key element in the theory is the domain of danger, the area of ground in which every point is nearer to a particular individual than to any other individual
Social networks
Animal social networks are descriptions of social structures
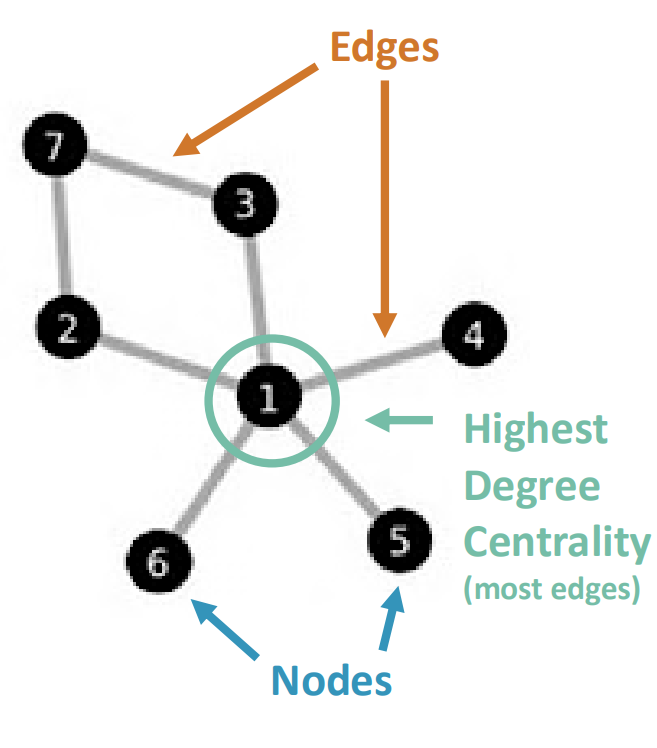
Networks consist of nodes connected by edges
Consists of nodes and edges
Centrality, social networks
A measure of an individual’s structural importance in a group based on its network position
Degree centrality, social networks
Based on the number of direct edges an animal has
An animal with more edges (degree node) will have more influence on those around it and possibly on the whole network (e.g. disease transmission)

Direct edges, social networks
A focal individuals immediate connections
Indirect edges, social networks
A focal individuals connections with individuals through other individuals
Bridges, social networks
Some individuals (nodes) serve as bridges in or between networks (node B)

Dominance
A social relationship reducing conflicts
Determines priority access to contested resources
mating opportunities, food, shelter
Not a personality trait, rank can change
Only applicable within a species
Signals and dominance
Can provide information about rank or fighting ability and helps in the establishment of dominance hierarchies
Can signal dominance, individual identity and fighting ability
A few examples of how rank is earned:
Signals
Age (birds born in succession)
Inherited rank
Affiliative
Relating to forming social and emotional relationships with others, or to the feeling of wanting to form these relationships
Tit for tat
Cooperate on the first move, then copy what the opponent did on the last move
Works because defection is punished immediately, but can also be forgiven if the defector corrects
Cooperation between non-relatives can be favoured when individuals are likely to interact again
Conditional cooperation that tracks a partner's recent behaviour
Kin selection
When natural selection favours a trait due to its positive effects on fitness of an individual’s relatives even when this process comes with a cost to the individual’s own fitness
Helping behaviour is favoured by selection whenever the relatedness-weighted benefit exceeds the cost to the helper (Hamilton’s rule)
Kin selection explains how altruism evolves because relatives share a portion of the same genes
Example: Ground squirrels emit loud warning calls to alert others of approaching predators. This behaviour puts the caller at a higher personal risk of being spotted by the predator, but it saves nearby family members.
Cooperative breeding
When an individual, a helper, foregoes its own reproduction to help raise the young of others. Most often the helper is related to the young
Why help?
Kin selection
Habitat saturation/fragmentation
Reliable food supply
Succession for breeding opportunity
Cooperative breeders are disproportionately found in regions with high climatic variability and unpredictability – adaptive strategy
Hamilton’s rule
r × B > C
r relatedness of helper to recipient
B fitness benefit gained by the recipient
C fitness cost to helper
Different kinds of eyes
Pupils
Can be round and expanded
e.g. humans, birds
180 degree visual field with mostly overlap/depth perception
Narrow —> round
e.g. cats, dogs
Better at adjusting their size
Broader visual field with more narrow overlap
Horizontal
e.g. horses, goats, sheep
Very broad visual field (almost 360 degrees)
Horses still have 65-80 degree frontal overlap, just like canids.
Additional “white fingers” that stick out/forwards of the eye to block sunlight (the shade from this can be visible)
“Dots”
Very small dots turning into covering the entire iris (basically)
e.g. gecko, tarsier
Mammal eye
Cornea
Lens
Iris
Ciliary muscle
Zonule
How does the mammalian eye work?
Ciliary muscle is a “circle” around the iris, “attached” through the zonule.
When the ciliary muscle contracts, the zonule become relaxed and the lens becomes rounded to focus on close objects
When the ciliary muscle relaxes, the zonule taut and flattens the lens to focus on more distant objects
Fish eye
Spherical Gradient Lens
(Lens doesn’t change in shape ?)
(Retractor/Protractor Lens in some species)
Reptile eye
Bony ossicle
Brucke’s muscle
Bird eye
Bony ossicle
Brucke’s muscle
Crampton’s muscle
How do reptile/avian eyes work?
Active changing of the lens, actively pressing to change the shape
In birds, you have the additional Crampton’s muscle to change the size of the cornea
Diving birds also use it as a surface for water (?)
Amphibian eye
Protractor lentis
How does light reach the retina?
Light must go through all layers of cells before reaching the photoreceptors
Light might “change”/reflect throughout this journey
Cones vs rods
Cones see colours and are more “angular” in shape ( > )
Rods are bigger and more light sensitive, have more pigment, and are rod shaped ( ニI )
Explain eyesight (?)
Light must go through all layers of cells before reaching the photoreceptors
Light might “change”/reflect throughout this journey
When light is absorbed, there is a hyperpolarization
(not depolarisation as in other processes)
In the relaxed state, you have a lot of neurotransmitters. When light is absorbed, you get less neurotransmitters.
“It is only the outer segment that is light sensitive, A larger outer segment can absorb more light
Ganglion cells
Ganglion cells are the last step before the signals are sent to the brain.
When densely packed, there are less photoreceptors
= think of them as pixels. When they are smaller (and more) we can see finer details
Packed areas of ganglion cells is called the fovea
Fovea
Where the ganglion cells are the most packed
in humans, this area only consists of cones (not rods)
Horses, wolves, hares etc have rods as well in their fovea
Most birds have 2 fovea in each eye (other species only have 1)
Correlation between domestication and vision in dogs ?
Dogs with more “wolf-shaped” nose have a broader area of ganglion cells
In pugs (and other dogs with flatter noses), they have a very small but very “good”/Intense? spot — just like humans
This spot is called “area centralis”
Similar pattern in horses
Spatial resolution
Measure of how closely lines can be resolved in an image
(e.g. black-white stripes. One black-white is one cycle. Measured as “cycles per degree (at a certain distance)”)
dvs how many degrees could one’s eye detect?
Is sacrificed in dim light
Spatial resolution becomes worse in darker environments
Temporal resolution
“shutter time”
Photoreceptors can only code information up to a certain temporal frequency
Cones are generally better than rods to discriminate fast movements.
Imagine a fan:
With short shutter time, you can see each individual blade
With long shutter time, you see it all as a blur
Sacrificed in dim light
Explain how color vision works
Colour requires two or more cone types
The reflected light from a surface enters the cones and the brain considers which type of cone absorbed the most amount of light, compare them, and then the brain makes us perceive a certain colour based on the cones that absorbed the light.
An absorbed photon has no “identity”, it’s just what cone absorbed it
Colour is just a hallucination
Ancestral cone photopigments
Most animals have the four ancestral cone photopigments
As mammals, we lost two of these four due to the nocturnal history from the dinosaur ages and whatnot
Primates have created a new third one 30 million years ago (unrelated to the four ancestral ones) to experience red colour
Neutral point
Dichromatic visioned mammals have a so-called “neutral point” where they cannot discriminate grey shades from a green-blue shade at 480nm.
Ways to improve night vision in dim light
Enlarge pupils
Enlarge eyes
Short focal length
Shorter distance = less “disturbance” —> clearer image
Summation in space and time
Can extend visual range down to intensities 100 000 dimmer than provided by optics itself
Discuss colour vision in dim lights
Horses, despite having large eyes + tapetum lucidum, they cannot distinguish colours in darkness due to their vision being mostly based on rods.
Nocturnal helmet geckos can see colours in dim light when we can’t.
Several bees and hawkmoths can see colours at night.
Decline effect
Effect sizes shrink systematically in follow-up studies
Early studies of a phenomenon report large, striking effect sizes. Follow-up studies tend to report smaller effects. Over many replications, estimates regress toward the true (usually smaller) value. This is the expected consequence of publication bias plus small initial sample sizes.
Currently the field has many studies on similar questions but few close replications. This makes it difficult to separate methodological variation from true biological variation.
P-Hacking is:
Collecting data, or conducting statistical analyses, until a non-significant result becomes significant
Driven by the pressure to produce positive findings rather than by the data or the research question
How p-hacking occurs:
Stopping data collection to early
Ending data collection the moment p < 0.05 is reached, before pre-specified sample size
Collecting data until the p-value is significant
Conducting multiple experiments; reporting only the one that worked.
Cherry-picking outcomes
Measuring many variables but only reporting those that reach significance.
Tweaking the data
Post-hoc decisions on outlier removal or data transformation to achieve significance
Doing multiple comparisons without corrections
Performing many tests without correcting for family-wise error rate
Type I errors
Untrue significant results (false positive)

Type II errors
Untrue non-significant results (false negative)

HARKing is:
When a hypothesis is invented after the data collection and results, and presented as if it was pre-formulated
Makes a chance finding look like a prior prediction
You’re pretending to have tested for something that was just a chance finding
Why is HARKing problematic?
Inflates false-positive
p = 0.05 means there is a 5% probability that your results occurred by pure random chance. If you run 20 independent tests at α = 0.05 and report the best one as a "prediction," your actual false positive rate is closer to 1 − 0.95²⁰ ≈ 64%, not 5%
Results cannot be replicated
Because results are post-hoc justified they are unlikely to replicate in a study with new data. Entire research fields can be based on non-replicable results. Researchers will spend time and money trying to replicate findings that cannot be replicated.
Invisible in publications
Readers cannot detect HARKing from the published paper alone. Peer review cannot catch HARKing without access to study logs
Publication bias
Positive findings are far more likely to be reported than null or negative results - regardless of scientific value
File-drawer effect
Direct consequence of publication bias
Null results are not written up, submitted or published
How can you detect publication bias?
Using a funnel plot
A funnel plot is a scatterplot used in meta-analyses to visually detect publication bias. It plots individual study effect sizes against a measure of precision (like standard error)
No Publication Bias: The plot resembles an inverted, symmetrical funnel. The larger studies cluster tightly near the center, while smaller studies spread out equally on both sides. This indicates that all studies, regardless of their positive or negative results, had an equal chance of being published.
Publication Bias: The plot is assymetrical. This usually means that small studies with negative, nonsignificant, or unfavourable results were left unpublished (the "file drawer effect"), while small studies with positive, statistically significant results made it to publication.

Types of replication
Close replication
Conceptual replication
Both types of replications are needed but close replications are rare. Currently the field has many studies on similar questions but few close replications. This makes it difficult to separate methodological variation from true biological variation.
Close replication
Repeats the original study using the same species, setting, protocol and sample size
Rare
Conceptual replication
Tests the same hypothesis with a different design
How can we improve the reporting in academia
Pre-registration of hypotheses
Register hypotheses, design, sample size, and analysis plan on repositories before collecting data. Eliminates HARKing and reduces p-hacking.
A Priori Power Analysis
Calculate minimum N needed to reliably detect an effect of the expected magnitude before starting. Prevents underpowered studies, which inflate effect sizes and produce unreliable results.
Open Data & Materials
Raw data, analysis scripts, and methods should be provided with the paper. The environmental confound in Hare et al. (2002) would have been easier to detect if the full protocol had been openly accessible.
Replication Studies
Actively conduct and publish close replication studies using the same species, same protocol, but from independent labs. Laskowski et al. (2026) describe a dedicated journal section for exactly this.
Report All Results
Report null results, failed conditions, and unexpected findings, not only p<0.05 outcomes. Reduces the filedrawer effect. Krause et al. (2018) explicitly name this as a priority for the animal pointing literature.
A good research question…
Uses defined terminology
Can be answered by your study
Clarifies what you would measure, in which species, at what age, or under what conditions
Can be falsified
“The first and most consequential decision in any study is choosing the right question at the right level of explanation. Tinbergen's framework provides guidance.”
Tinbergen's Four Questions (short)
Mechanism
How does it work?
Development
How does it develop?
Function
What is it for?
Evolution
How did it evolve?
All four questions matter
No single question sufficiently describes the complexity of animal behaviour
Proximate and ultimate explanations are complementary - not competing
A behaviour’s function (e.g., to find a mate) is fundamentally different from its mechanism (i.e. the hormones that trigger it)
Animals are not static organisms - they develop over time and are constantly influenced by the environment. A single mechanistic rule cannot adequately capture why animals behave the way they do.
Innate behaviours
behaviours that are not changed by learning
Tinbergen's Four Questions: Mechanism
Causation
What underlying mechanism causes the behaviour?
Which stimuli elicit the behavioural response?
A mechanistic question asks what internal states and external stimuli produce the behaviour. It can be addressed by measuring hormones, neural activity, or the stimuli that trigger responses.
Tinbergen's Four Questions: Development
Ontogeny
How does the behaviour change with age?
Is development of the behaviour affected by environmental factors?
A developmental question asks how behaviour presents across the lifetime. It can be addressed by comparing individuals at different developmental stages or with different early experiences.
Tinbergen's Four Questions: Function
Adaptive value
What is the (current) function of the behaviour?
How does the behaviour affect survival and reproduction?
A functional question asks what the behaviour does for the animal. What is its effect on survival and reproduction? It can be addressed by estimation of fitness.
Tinbergen's Four Questions: Evolution
Phylogeny
How did the behaviour evolve?
Which species share the behaviour, and did it evolve once or multiple times?
An evolutionary question asks where a behaviour came from, which species share it, and whether similarities reflect shared ancestry or independent evolution. It can be addressed by comparing genetic expression, phylogenetic analyses etc.
Ultimate vs proximate explanations
Ultimate
Function & Evolution
“Why”
Why does the organism do is?
Why did it evolve?
Proximate
Mechanism & Development
“How”
How does it work?
How did it develop?
Hypothesis vs prediction
Hypothesis: A proposed explanation for an observed behaviour. A hypothesis should always state WHY.
Prediction: What you would observe in your data if your hypothesis is true. States WHAT the results will look like.
One hypothesis can generate multiple predictions
One prediction can be consistent with multiple hypotheses
If a prediction fails the hypothesis is challenged
If a prediction succeeds the hypothesis is supported, but not proven - other hypotheses may make the same prediction (i.e. there may be other explanations for the behaviour you observe)
Example:
Observation: Male long-tailed widowbirds have tails far longer than needed for flight. We suspect this might be driven by female choice (a behaviour driving sexual selection).
Hypothesis: Tail length evolved through female choice with females preferring longer-tailed males, and this preference drives exaggeration of the trait over evolutionary time.
Two predictions: 1. Males with experimentally elongated tails will attract more females than controls. This prediction supports the hypothesis. But are there any alternative explanations? 2. Tail length will not correlate with territory size. This prediction rules out that females prefer resources, not tails.
Use the lecture slides for Research Questions to practice writing good hypotheses and predictions
Motivation and decision making
Different motivations can strongly affect decision making

What can affect motivation
Motivation fluctuates through time and life history stages
Hormones
Age
Biological sex
Time of day
Season
Climate
Homeostasis
The maintenance of a stable state of internal physical and chemical conditions within narrow optimal ranges by living organisms
Involves many things, including: o Blood pH o Core temperature o Blood glucose and oxygen levels
How is homeostasis maintained?
Homeostasis maintains stability through negative feedback
The behavioural response is reactive – it occurs as a reaction to a deviation from homeostasis

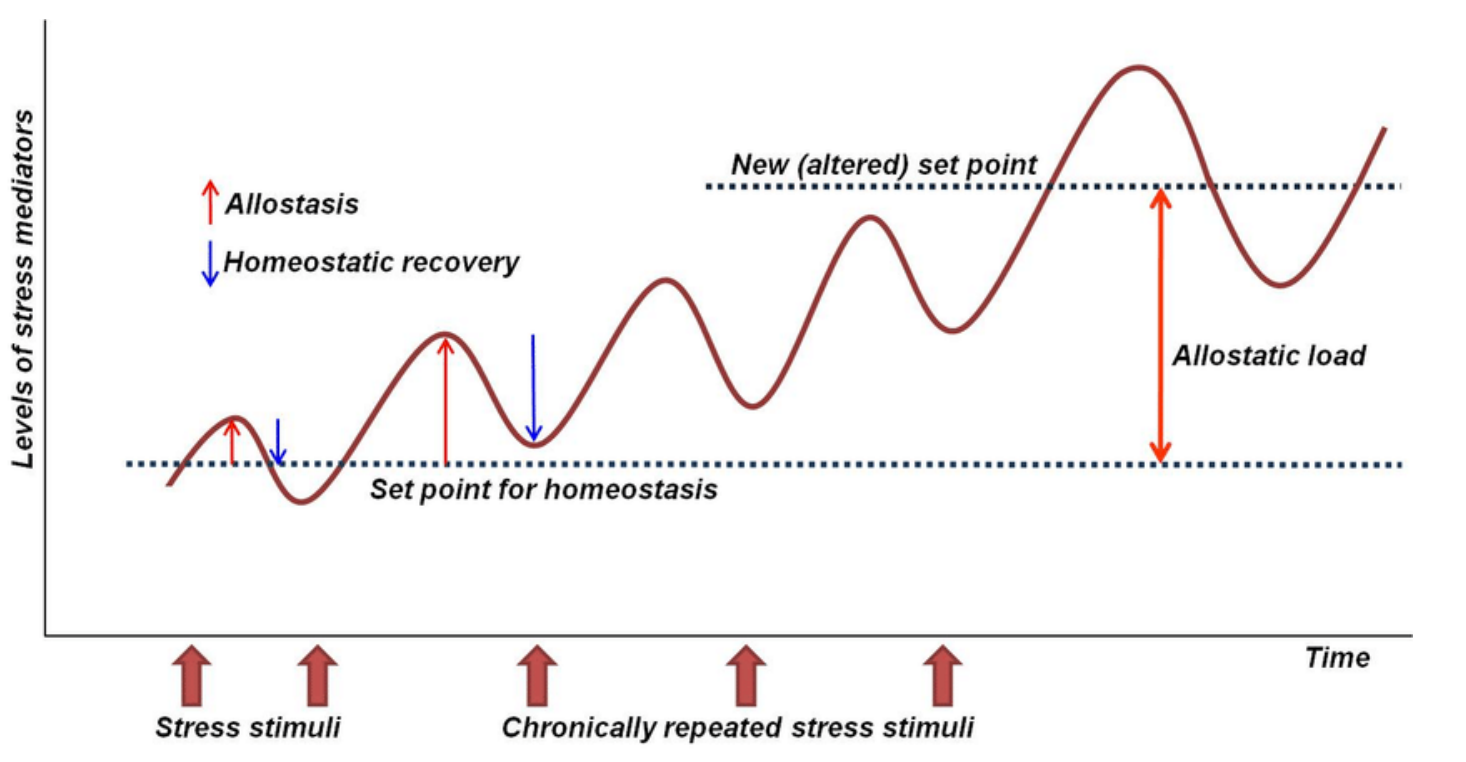
Allostasis
Stability through change
Process by which animals actively adjust their internal state to meet predictable and unpredictable demands
Allostatic parameters allows for dynamic shifts in parameters to match needs to eventually return to homeostasis
Examples of allostastic adjustments:
The increase in heart rate and blood pressure during physical activity
Elevation glucocorticoids before a breeding season
Why this matters in the context of motivation: not every rise in a hormone or a drive reflects a deficit being corrected — some reflect anticipation of a demand
Allostasis and motivation
STABLE STATE vs ADAPATBILITY
Homeostasis: Fixed set points within a narrow range
Allostasis: Dynamic set points that can adapt to changing demands
Allostatic responses can be predictive, i.e. changes occur before deviation from a set point occurs
Example: You watch a movie and anticipate that a scene will be scary – your pulse goes up
Allostatic load
The cumulative cost to the body of allostasis
All animals experience acute daily and seasonal stressors that they need to cope with. However, when stressors are repeated too often, there can be “wear and tear” across multiple somatic systems, which can lead to chronic stress
Can lead to an altered set point
Measuring motivation
The cost and animals is able to pay to gain access to a resource can tell us about its motivation for this specific resource
Preference tests with costs
Can measure:
How flexible the animal is in its motivation for this resource
Resource value
Maximum cost paid to get to the resource
Displacement activities
A normal behavioural pattern that appears out of its usual context
Expressed when motivations compete, or a motivated act is hindered
Ex: redirected behaviour, intention movements & ambivalence
Redirected behaviour
The correct behaviour is directed at the wrong object
Intention movements
Suboptimal or fractions of the correct behaviour
Ambivalence
Combination of intention movements from both conflicting motivational systems (e.g. approach and retreat)
Stereotypic behaviour
Repetitive, functionless and often damaging behavioural pattern
Stereotypic behaviour is most often a response to chronic stress, frustration or an inability to continued perform natural behaviours
Stereotypic behaviour is not necessarily a displacement activity but a repeated state of motivational conflict can lead to the development of stereotypic behaviours as a coping mechanism
Even if an animal is taken out of the situation in which it is not thriving the stereotypic behaviour often persists
Judgement vs decision making
Early decisions can modify subsequent judgments, which in turn can modify subsequent decisions

How to differentiate between lack of judgement and decision not to act in a behaviour study?
Potential solution – add additional measures to your set up:
Physiology
Neurology
More behaviours

State-dependent decision making
Energy reserves affect the decisions made by educated predators foraging on defended prey
Higher motivation leads to more risk taking
Aposematism
An advertising defence strategy where an animal uses bright colours, bold patterns, distinctive sounds, or strong smells to warn predators that it’s toxic, venomous, or tastes bad
Designing a study with motivation in mind
Separate motivational strength from loaded or andromorphic terms
“worked hard for it” is not the same as motivation
Control for and report deprivation/energy state before testing
it confounds tests involving food
Some animals are just less food motivated
will this influence your test?
Watch for general activity and arousal masquerading as a specific motivational or decision effect
Is your focal animal affected by the test situation itself? Something secondary in its environment? Or internally not related to your research question?
Watch for displacement activities being mistaken for the trait you are actually measuring
Ethogram
A written inventory of behaviours in a species’ repertoire
Can be partial or complete depending on the research question
Should be based on pilot observations
Classifying behaviours in an ethogram
Descriptive/Structural: “Nose is pressed or close to the ground (less than 10 cm) with jaw muscles moving”
Can sometimes be too exclusive and detailed
Functional: “Feeding”
Can sometimes be too broad
Behavioural categories for an ethogram
In order to quantify behaviour we have to divide them into categories. These categories should be:
Mutually exclusive
There can be no overlap between behaviours. Each observation fits only one category
Objective
Describe what you see, not what you think it means
Reliably measurable
Can a stranger use the ethogram without instructions?
States vs Events
Distinguish between behaviours with duration (states) and instantaneous behaviours (events)
Events
Classification of behaviours
Relatively short duration
Typically low variance in duration
Usually measured in frequency of occurrences
Common pitfalls when making an ethogram
Anthropomorphism
Categories that are too broad
Categories that are too narrow
Unnecessary detail makes coding impossible in real time.
Overlap between categories
Assuming universality
Always validate your ethogram for your specific species and context – even across populations of the same species behaviours might differ.