ESS Standard Topic 2.1
 Call Kai
 Learn
Learn Practice Test
 Spaced Repetition
 Match
Match Flashcards
 Knowt Play
1/43

Earn XP
Description and Tags
Population Ecology
Name | Mastery | Learn | Test | Matching | Spaced | Call with Kai | Chat |
|---|
No analytics yet
Send a link to your students to track their progress
44 Terms
Biosphere
The part of the earth in which life exists
Indicator Species
Organisms whose presence, absence, or abundance reflects specific environmental conditions, helping scientists assess the health of ecosystems.
Example: Mayflies and Sludge to assess water quality.
Mayflies- Present where there are :] Oxygen
Sludge- Present where there is :[ Oxygen
Example: Lichen used to indicate pollution levels. ( They are tolerant of pollution and sulphur dioxide, doesn’t mean they like it )
Green - No pollution
Blue - Some pollution
Orange - More pollution
None - Too much Pollution
How are Organisms classified?
How would you also write them using the Binomial Latin names?
Kingdom
Phylum
Class
Order
Family
Genus
Species
Genus is always capitalised and species is in lower case, Italics on device and Underlined on paper
Classification/Taxonomy
The process of grouping organisms into classes
Based on common physical features and DNA making communication of ideas easier so features of organisms can be predicted.
Organisms with similar characteristics are in the same Genus, DNA evidence helps prove this.
Taxonomy
The science of naming/classifying things, putting it into a group and then naming it by using DNA and Physical Features
Abiotic and Biotic factors examples
Abiotic factors are non-living elements of an ecosystem E.g. Temperature, Water, Nutrients, Light
Biotic factors are living elements of an ecosystem E.g. Consumers, Competition, Predators/Prey, Producers, Disease.
Population
How many of one species in in one place at one time.
Species
Organisms that can reproduce to produce fertile offspring.
Community and Interactions
Different species living in a habitat and interacting with each other.
Competition (Interspecific, Intraspecific)
Interdependence
Mutualism
Parasitism
Producers
Carnivores/Omnivores/Herbivores
Saprolites/Detritivores
Competition between species and between populations
Between species: Interspecific
Between populations: Intraspecific
Distribution
Describes where an organism is found
Either wide ranging or specialised. Specialised species are at in increased risk of becoming extinct.
Niche
The specific set of resources required and the role by which a population needs for it to survive.
Ecological Niche - part of the habitat that provides all the specific needs of the organism.
(A populations distribution will be concentrated where niche resources are available.)
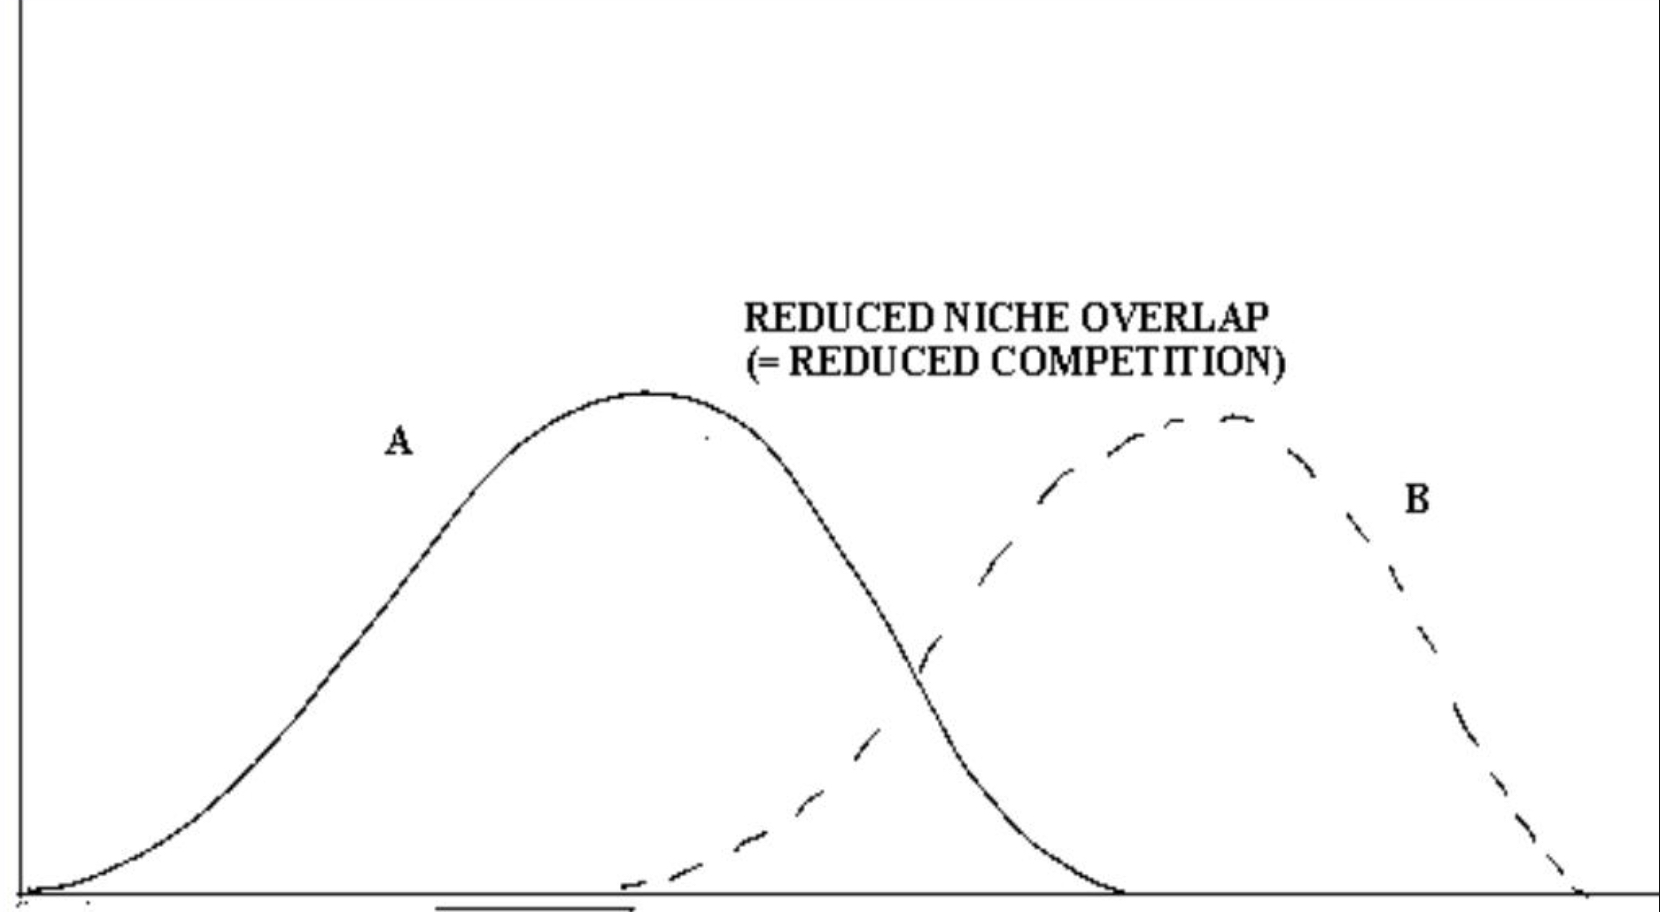
Evaluate this graph briefly
A and B will be competing for nutrients, space, light and water where they overlap because they have the same ecological niche in those areas. They will not have to compete where the graph does not overlap because they are not in the same area.
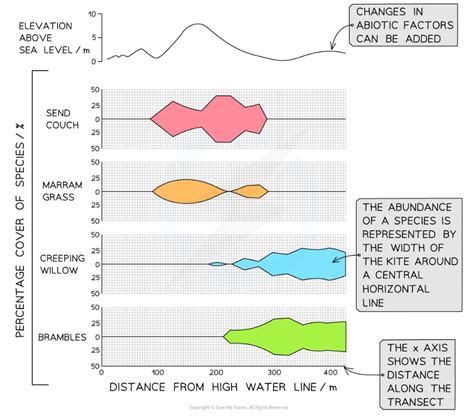
What are Kite diagrams for?
Kite diagrams are used to visually show the abundance of of a species against land Distance along a transect line.
They are drawn in a way where for abundance they have the same on both sides of the y axis and the x axis intercepts it at the midpoint. And when plotting the number, you half the number you have then plot that new number on both sides. So if there is 3 you go up 1.5 on both sides.
What is a Dichotomus key, what is it used for and how does it work?
It identify’s an organism based on physical features.
-Must contain YES or NO questions
-Used when scientists are unsure
-The key can’t be subjective, known details, or not be known by looking at the image.
Examples of things used to measure Abiotic factors.
All Abiotic Factors most likely will have a measure for it.
Light Meters
pH probes
Rain meters
Oxygen meters
Nitrate meters
Universal Indicator
Turbidity (cloudy) meters
Why is the Human Population a problem?
The Carrying Capacity of the Earth is 600 million people as that is what it was during the Victorian era. However due to improved technology, healthcare, Agriculture
They also now as a result have no definable niche
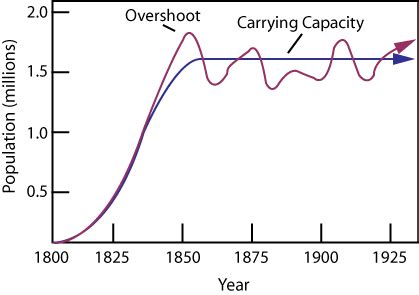
Carrying Capacity
The MAXIMUM SUSTAINABLE population an ecosystem can support.
Transition Phase is when abiotic and biotic factors start to have an impact on the population.
Stationary Phase is once the carrying capacity is reached its peak (now just fluctuating)
What is the difference between a J-Curve and a S-Curve?
J Curve - What would happen if there were no biotic or abiotic factors
No Competition
No Disease
No Predators
No Toxic Waste Products
S Curve - A more realistic model of population growth that takes into account abiotic and biotic factors ,and carrying capacity.
Food, Nutrients, Space and Water are Density Dependent Factors. What does this mean?
The Larger the Population = more competition
What is an example of Carrying Capacity being changed by external Factors?
St Matthew’s Island
In the 1940s, lot of reindeer where placed on st Matthew’s island as emergency food while the Russians were researching. However when they were done, They left them on the island.
Their population increased 10 fold in the next decade while surviving off of lichen for protein. However they eventually ran out of lichen and had to resort to eating grass which had less nutrients. A brutal winter then occurred causing many of the reindeer to either freee or starve to death due to the lack of food, weather and the fact they were unable to prepare like they normally would for the winter. The fact there was no apex predator to keep the reindeer population down was also a factor.
What are some sampling strategies or plants?
Random Quadrants - Used to determine the species in an area.
Place random quadrants in an area
Estimate population using either percentage cover of percentage frequency
Multiply up in order to fit the whole sampled area.
Transects - Placed every couple metres in order to remove bias.
Stratified sampling
Splitting the sampled zone into sections then randomly sampling from each section.
Three non lethal traps meant to help sample animals?
Posters
Nets
Pitfall Traps
What is the Lincoln Index used for? (Aka capture-recapture)
To estimate population size.
What is the equation used with the Lincoln Index
Population size = (n1 x n2) / m
Where:
N1 is animals captured the first night
N2 is animals captured the second night
M is animals captured the second night who are marked
How does capture-recapture work
Use posters, nets and pitfall traps to capture the animals
Mark the animals in a way that does not cause them ham or predation bias then release them back into the the wild.
Wait a little to give the animals enough time to disperse so it wont effect your results and make the population size too big.
What could negatively affect the reliability of the Lincoln Index?
-Marking animals in a way that causes them harm ore makes them prone to predator attacks.
-Not giving the animals the chance to re disperse.
-Cognitive Animals - They know that an ecologist will take care of them if they fall into a trap so will purposely go back effecting the results.
When is the term Ecosystem used and When is the term Habitat use?
Ecosystem (Open system) is used when looking at the dynamics of a system.
Habitat is used when looking through the perspective of living organisms.
Sustainability
The ability to provide for current needs whilst maintaining enough resources for future generations
E.g. The constant recycling of Carbon in the carbon cycle
Tipping Point
The extent of environmental change lead to a collapse of the original ecosystem and development of a new equilibrium.
The only way to return the ecosystem to its original state is to have human intervention.
What is an Example of a Tipping point?
Desertification
What is the Oldest Rainforest on Earth and How old is it.
Pain tree Rainforest. 180 million Years old (Self sustaining)
Keystone Species
Species that have a disproportionate effect on the ecosystem.
Ecosystem Engineers
Organisms that maintain, create or modify an environment. E.g. Elephants and beavers.
What happens when a Keystone species are removed from their habitats?
It can result in a trophic cascade which can further result in the ecosystem going beyond their tipping points.
Trophic Cascade
If you kill one thing the next thing dies.
When the removal of a predator or prey in a food web is removed causing the food web to destabilise and for example primary consumers to overpopulate to food chain, put stress on producers etc.
Bottom up Species
Producers are important to the food chain as without it the whole food chain collapses. (Primary consumers cant be fed, so Tertiary consumers cant be fed and predators cant be fed.
Top Down Species
Apex Predators preventing species lower in the food chain from becoming overpopulated.
What is an example of a trophic cascade.
Wolves of Yellowstone National Park
They were removed from the park do the elks started to overpopulate the park and overconsume vegetation and ruin the ecosystem. They were reintroduced and the population sizes of all the species in the national parks stabilised preventing a trophic cascade
Planetary Boundaries Model
Listed 9 categories for judging the effects on the Anthroposphere on the sustainable global ecosystem (biosphere)
Each fresh hold represents a tipping point. Where it will no longer be self sustaining.
What are the Planetary Boundaries
Climate Change
Ozone
Biosphere Integrity
Aerosols
Novel Entities
Biochemical Flows
Land Use
Freshwater Use
Ocean Acidification
What is the regular background extinction rate? What is it now?
1 species per million every year.
It is currently 1000x higher so its -2000 species going extinct every year.
Ecosystem
Community of living organisms together with the nonliving components of their environment, interacting as a system