Raster Data
1/64
There's no tags or description
Looks like no tags are added yet.
Name | Mastery | Learn | Test | Matching | Spaced |
|---|
No study sessions yet.
65 Terms
why use raster’s
some data is only available as a raster
what is an example of data only available as a raster
imagery
what type of data is typically stored in raster format
continuous data
what are advantages of rasters
a simple data structure
ability to represent continuous surfaces
ability to store points, lines, polygons and surfaces
what does it mean rasters are simple data structure
they are a matrix of cells with values representing a coordinate and value
examples of continuous surfaces
elevation
rainfall
temperature
vector data tends to be ______ in a raster
coarser
what happens when you try to make vector data finer
it takes more memory to store and do
what are some disadvantages of raster data
spatial inaccuracies due to limits imposed by pixel size
can be very large datasets
loss of precision accompanying restructuring of data into raster
what is each cell known as in raster data
known as a pixel that has a value
what do cell values represent
represents the phenomenon portrayed by the raster dataset (categorical, magnitude, height or spectral values)
what are four requirements for rasters
coordinate system
reference coordinate or XY location (ex. 0,0)
pixel size
count rows or columns
how are coordinates calculated
counting number of rows and columns from corner with coordinates and multiplying by cell size
what does the area represented by the cell have
the same width and height
how does cell size vary
by product (some are small and others large)
what do satellite images or digital images HAVE? what do they NOT have?
have - raster format
lack - internal information beyond cell value
how many values per cel
ONE
what type of value is a raster cell
brightness value
how are the brightness value recorded
as a Digital Number (DN)
what makes it easier to see but NOT changes the cell value
contrast stretching
what value represents dark brightness? light brightness?
dark = closer to 0
light = closer to 255 (upper limit)
what do satellites measure
how bright the reflectance of a target is
what is reflectance recorded in
as a DN
what does the range of the DN values depend on
bit depth of the sensor
what is the range of DN values for 8 bit data
2^8 = 256
range is 0 to 255
what defines the radiometric resolution of the sensor
number of DN values
what is radiometric resolution
measure of a sensor’s ability to detect and differentiate small variations in energy intensity (brightness) from a target
are all raster’s satellite images
NO - vectors can be raster
what can cell values be
positive or negative, integer, floating point
what are integer values used to represent
categorical (discrete) data
what are floating point values used to represent
continuous surfaces
what kinds of data have the value at the center of the cell? the whole area of the cell?
center = DEM
whole area = soil PH, rainfall, land classification
what is count
the number of cells equal to value
what number must values be under for a table to be created
under 500
types of data
nominal
ordinal
continuous
nominal vs ordinal vs continuous
nominal
categorical or qualitative
have names or codes
NO quantitative value
ex. land use or soils
ordinal
categorized classes
categorical or ordered
has rank
ex. risk, land suitability
continuous
spatially continuous phenomenon
each pixel holds a measurement with any value in a range
ex. elevation, temp, rainfall
what are rasters well suited for representing
data that changes continuously across a landscape
how do rasters provide a method of storing continuity of a surface
using regularly spaced grid cells to represent the surface values
_____ values are a common application of surface maps
elevation
can rasters have math preformed on them
YES
what should be done BEFORE doing raster math
cell sizes are the SAME
matrix size is the SAME (columns and rows)
rasters align/snap to each other
what is the extent
geographic bounding area within which spatial analysis can occur
what is the extent bounding area defined as
the maximum x and y coordinates of opposite corners
what is a mask
identifies areas to be included in analysis either as a raster or feature layer
mask vs extent
extent - a rectangular bounding box for the entire map or the analysis,
mask - a more specific area within the extent that limits where analysis occurs
rasterization vs vectorization
rasterization: vector → raster
vectorization: same raster → vector
what can cause rasterization to be spatially inaccurate
if the rid cell size is TOO large
(points too large, polygon edges too coarse, lines too wide)
what defines how coarse or fine the feature will appear in a raster (rasterization)
the cell size
smaller cell size in rasterization means? larger cell size?
smaller = the smoother or more detailed the raster will be BUT needs more processing power
larger = coarser or less detailed the raster BUT needs less processing power
contrast the FOUR types of GIS analysis functions
local - preformed on SINGLE cell at a time where neighboring cells DO NOT influence the result
(ex. trig functions, exponential functions)
focal - preformed on single cell AND its neighboring cells
(ex. sd, mean, sum or values)
zonal - calculation on a zone/set of cells with common value
(ex. area, perimeter)
global - computation on the raster as a WHOLE
(ex. watershed delineation)
slope identifies
the maximum rate of change in value from each cell to its neighbours
what can the output slope grid be calculated as
percent slope
what does the slope use when calculating values
revolving 3×3 window
what are some stats calculated by the 3×3 window
mean
max
range
slope
aspect
terrain roughness
percent of slope formula
(rise/run) * 100
degree of slope
tran-1(rise/run)
what happens to the slope as grid cell size increases
the mean slope decreases and the surface smooths out
aspect identifies
the downhill direction of a slope at a specific location
what can aspect be thought of
the slope direction
what are aspect values
compass direction
what does a zero slope mean and what is the aspect
flat slope, aspect = -1
what makes up zonal statistics
zone layer - defines the zones
value raster - the input values used in calculating the output for each zone
output table - can be joined to the zone layer to display stats per zone
what is a distance raster
raster file where each cell’s value is its distance from the specific feature (point, line, polygon)
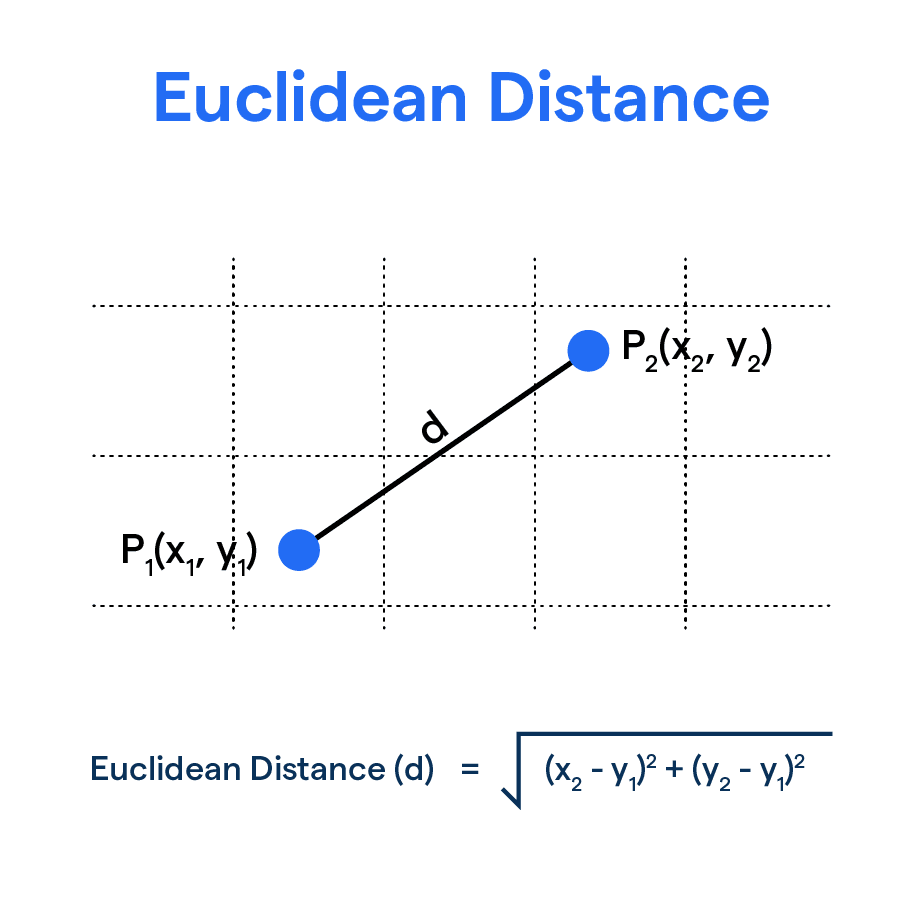
what is Euclidean distance
the "straight-line" distance between two points calculated using the Pythagorean theorem
what is reclassify
assign new values to old cells which put wide range of values into meaningful classes