Clinical trials
1/20
There's no tags or description
Looks like no tags are added yet.
Name | Mastery | Learn | Test | Matching | Spaced |
|---|
No study sessions yet.
21 Terms
in a clinical trial, what is the independent and dependent variable
independent
intervention → what we do to the patient e.g. give drug and compare with placebo
exposure → what happens to the patient that we don’t intervene with e.g. did pollution affect the outcome/endpoint
dependent
outcome or endpoint e.g. compare the quality of life of the treated vs untreated
causality → does the intervention/exposure cause the outcome endpoint?
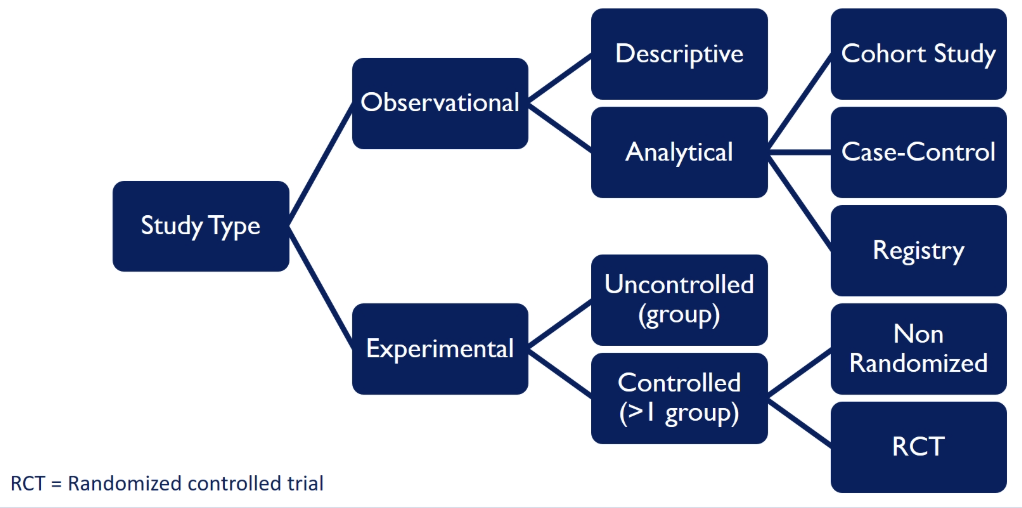
what are the different classes of clinical studies
observational → we observe what happens naturally and don’t intervene
experimental → we intervene and give some type of intervention (the most useful experimental study is the randomised controlled trial, RCT)
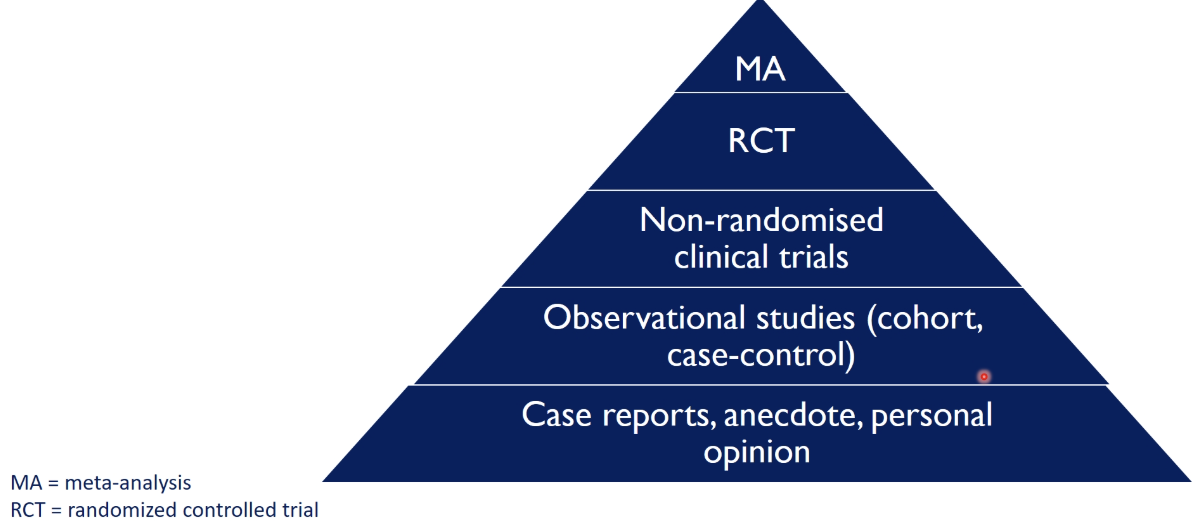
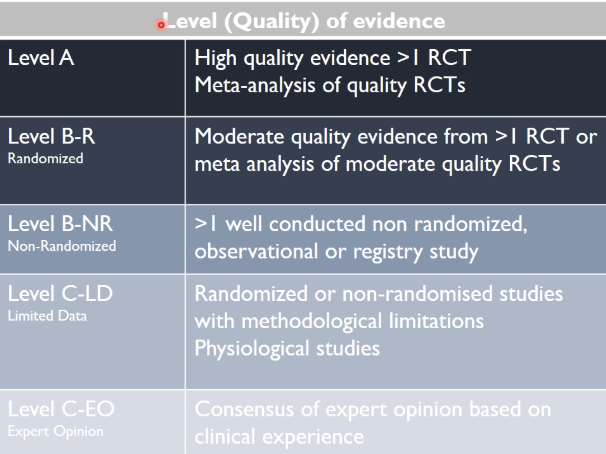
how are clinical studies graded
using the hierarchy of evidence
case reports, anecdote, personal opinion → not a good way to make decisions on clinical practice
meta-analysis → combines the results from a number of studies into one, than a single study alone
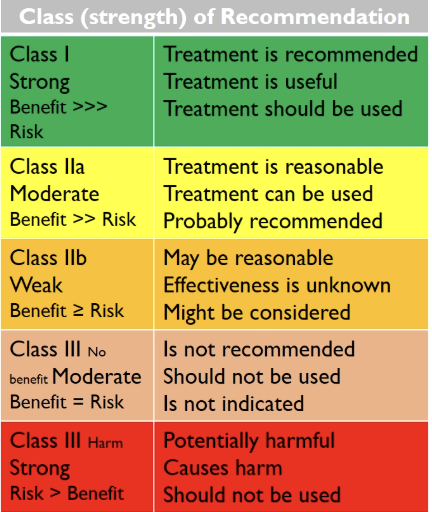
what techniques are used to make guidelines, considering the strength of the evidence
class (strength) of recommendation
level (quality) of evidence
class (strength) of recommendation
level (quality) of evidence
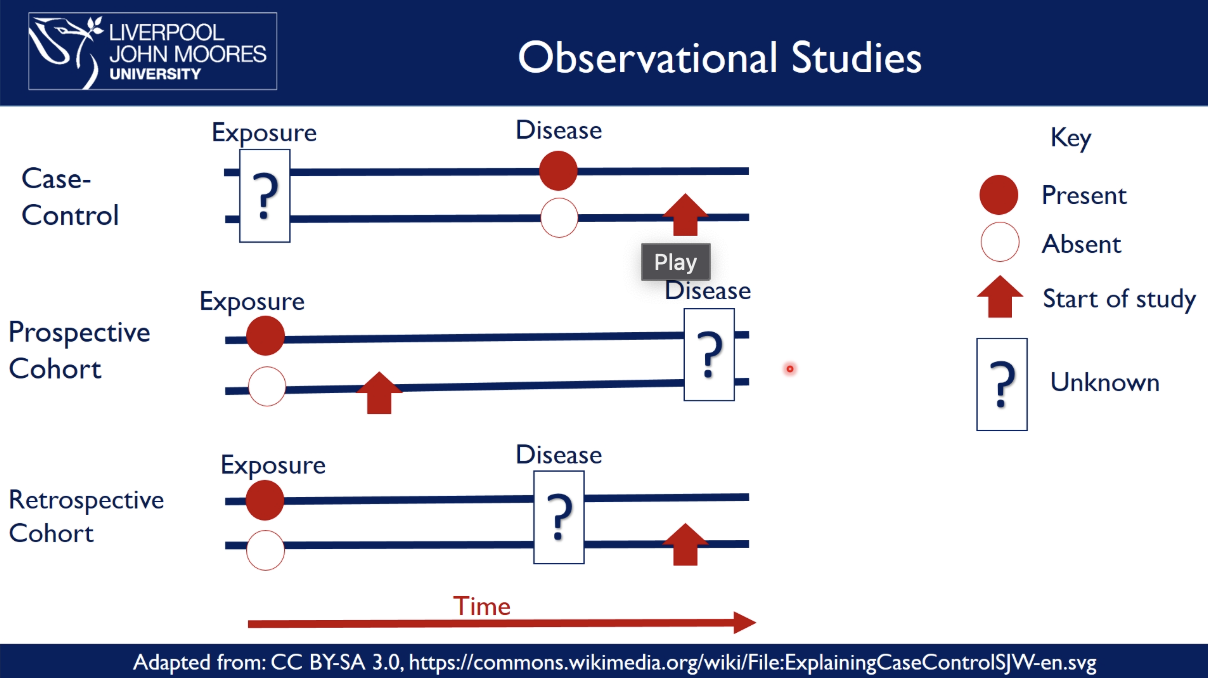
what are types of observational studies
case-controlled study
exposure is unknown → compare people with a disease to those without it and → start the study
e.g discovering the links for lung cancer and if they have a history of smoking
prospective cohort
exposure is known → compare the exposed vs unexposed groups over time → start the study before the disease occurs → see who develops the disease
e.g. smokers vs non-smokers and see how many have lung cancer
retrospective cohort
exposure and disease are known and have occurred → look backwards at old records to show how exposure over time is related to the development of a disease
e.g. look at records to compare heart disease rates between patients who were given Drug A vs. Drug B, who developed the disease?
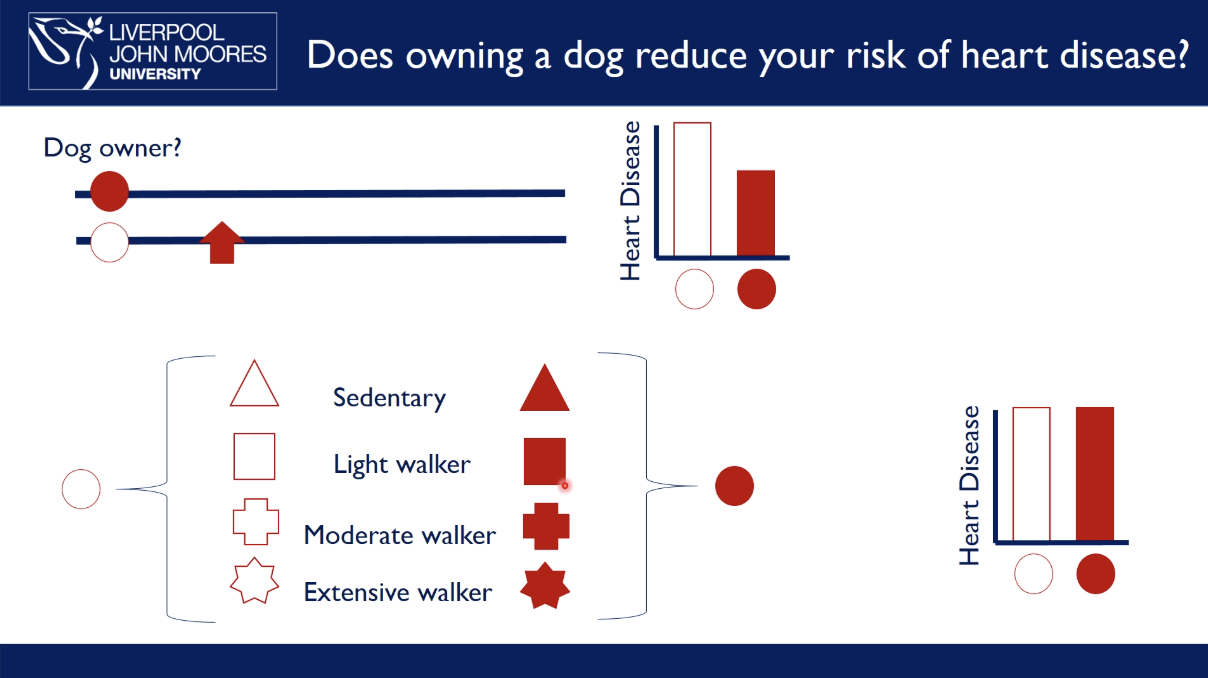
examples prospective cohort study: does owning a dog reduce your risk of heart disease
take a group of people and find out which of them are dog owners and not dog owners
follow up over ten years to see who develops heart disease
results may show that people that aren’t dog owners have a higher incidence of heart disease
we can’t conclude that owning a dog reduces risk of heart disease as you have to make the assumption that both groups are identical in everything except whether they own a dog or not
look at other characteristics in the individuals e.g. how much walking they do: from sedentary → extensive walkers
however, people with dogs walk more, which explains the relationship → owning a dog doesn’t reduce the risk of heart disease but going for a walk
this is known as confounding
how are observational studies prone to confounding
cofounders are variables related to both the exposure and the outcome
in the example study before, walking confounds the relationship between dog ownership and disease
if we know about and measure confounders, we can apply statistics to correct for them
however, observational studies always have some ‘residual confounding’ → observational studies determine association, not causality
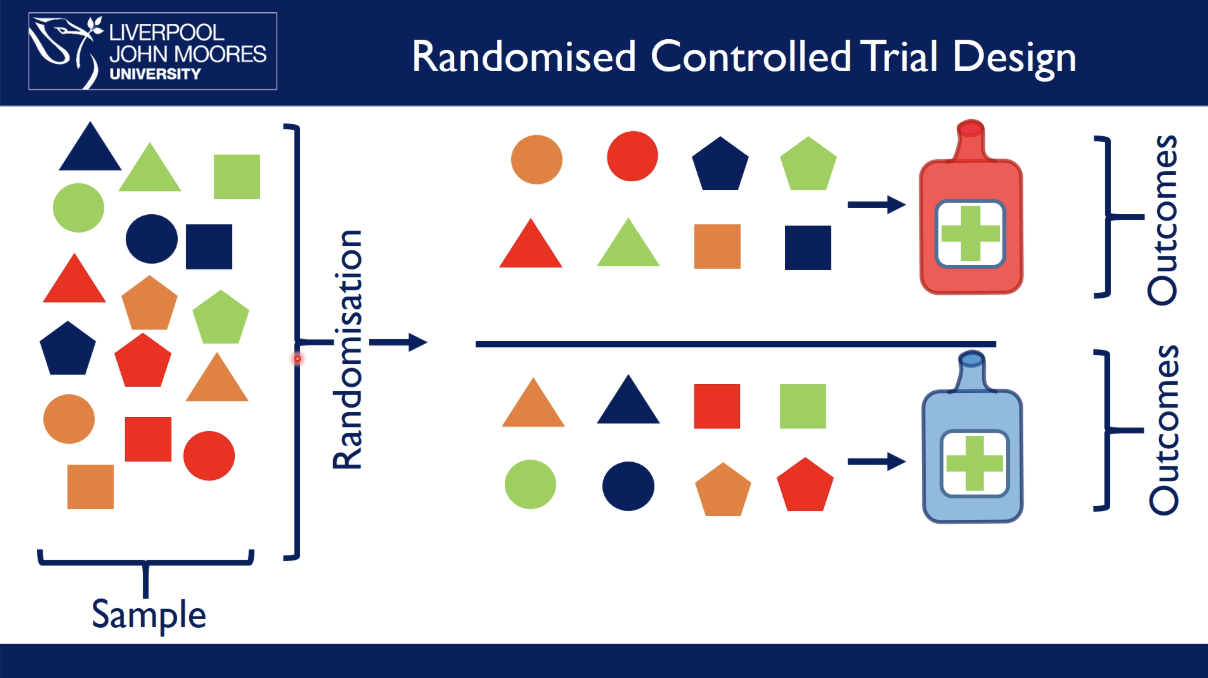
what are randomised controlled trials, RCT
example: which drug is best at preventing heart disease
test drug on a sample of people at risk of heart disease in a population
randomly allocate people to a certain drug treatment
follow up overtime and measure outcomes
there are now two identical populations, except in respect of the experimental intervention → randomisation eliminates confounding → RCTs demonstrate causality
what is a systematic review
a literature review that focuses on a research question that tries to identify, appraise, select and synthesise all high quality research evidence relevant to the question
systematic reviews that have high-quality RCTs are crucial to evidence-based medicine
what is meta analysis
combining the results of several independent studies for the purpose of integrating the findings
results come from multiple underpowered clinical trials
it uses existing data to test new hypotheses, which may not have been considered by original investigators
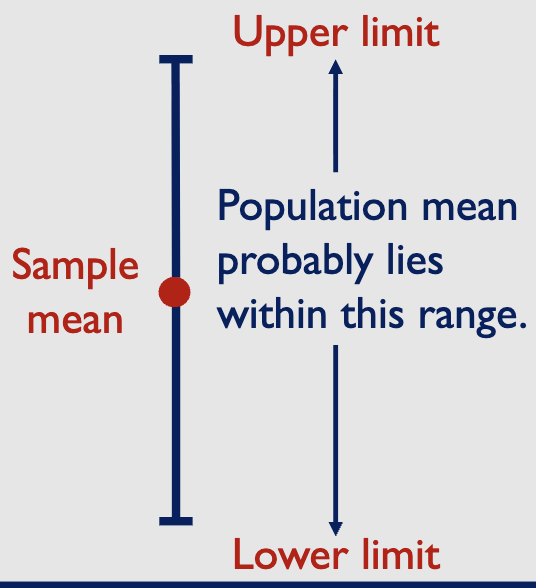
what are 95% confidence intervals
19/20 of the confidence intervals will be correct → true population mean is enclosed by the interval
the remaining one will be wrong → an unrepresentative sample
why are statistics useful
can describe quantities (Descriptive statistics and effect size e.g. mode, median)
can decide whether there is a difference between two (or more)
groups: hypothesis testingif we are evaluating an antihypertensive drug, we need to know:
whether differences between the groups are due to the drug, or due to chance (hypothesis testing).
how much blood pressure is reduced by the new drug (effect size)
null hypothesis vs alternative hypothesis
null → no difference exists between data sets
alternative → opposite of the null hypothesis
scenario
we conduct a trial to compare the antihypertensive effects of Drug A and Drug B
hypertensive patients are randomised to receive Drug A or Drug B
at the end of the trial, systolic blood pressure is 120 mmHg in patients treated with Drug A, and 125 mmHg in those treated with Drug B
is Drug A more effective than Drug B?
is the difference (5mmHg) a real effect, or can it be explained by
random variation (chance)null Hypothesis: No difference between effectiveness of A and B
alternative Hypothesis: there is a difference
we need an objective way to decide which hypothesis to accept. We are at risk of:
Type I ( α) error (Rejecting the null when it is true – ‘False Positive’)
Type II (ß) error (Accepting the null when it is false – ‘False Negative)
what is p-value
the probability of obtaining results as extreme as (or more extreme than) the observed results assuming that the null hypothesis is correct.
a smaller p-value → less likely that results are due to chance → stronger evidence in favour of the alternative hypothesis
what is p<0.05
many researchers use p=0.05 as a threshold for ‘statistical significance’
they reject the null hypothesis if P<0.05 → we therefore accept a risk of 5% * of rejecting the null when it is true (Type 1 ( α) error )
Many people think P<0.05 is too lenient
However, P<0.05 is equivalent to non-overlapping 95% CIs
(relates to ideal experimental conditions, in most situations the risk is >>5)
when p<0.05, what else do you need to consider
where P < 0.05 all you have produced is evidence that an effect does exist → should always consider the size of the effect
with a measured end point – How much does the mean value change as a result of the change in treatment?
with a classified end point – How great is the change in the proportion of individuals falling into each category?
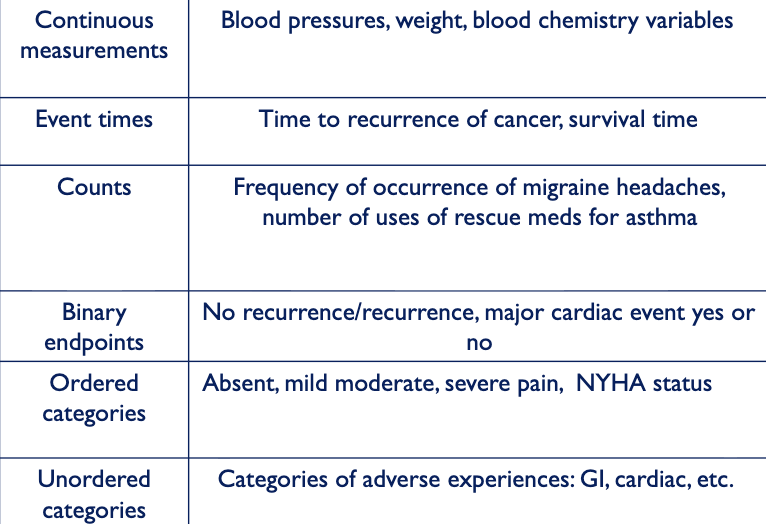
what determines how to quantify data
variable type e.g. effect of drug A and B on BP and mortality
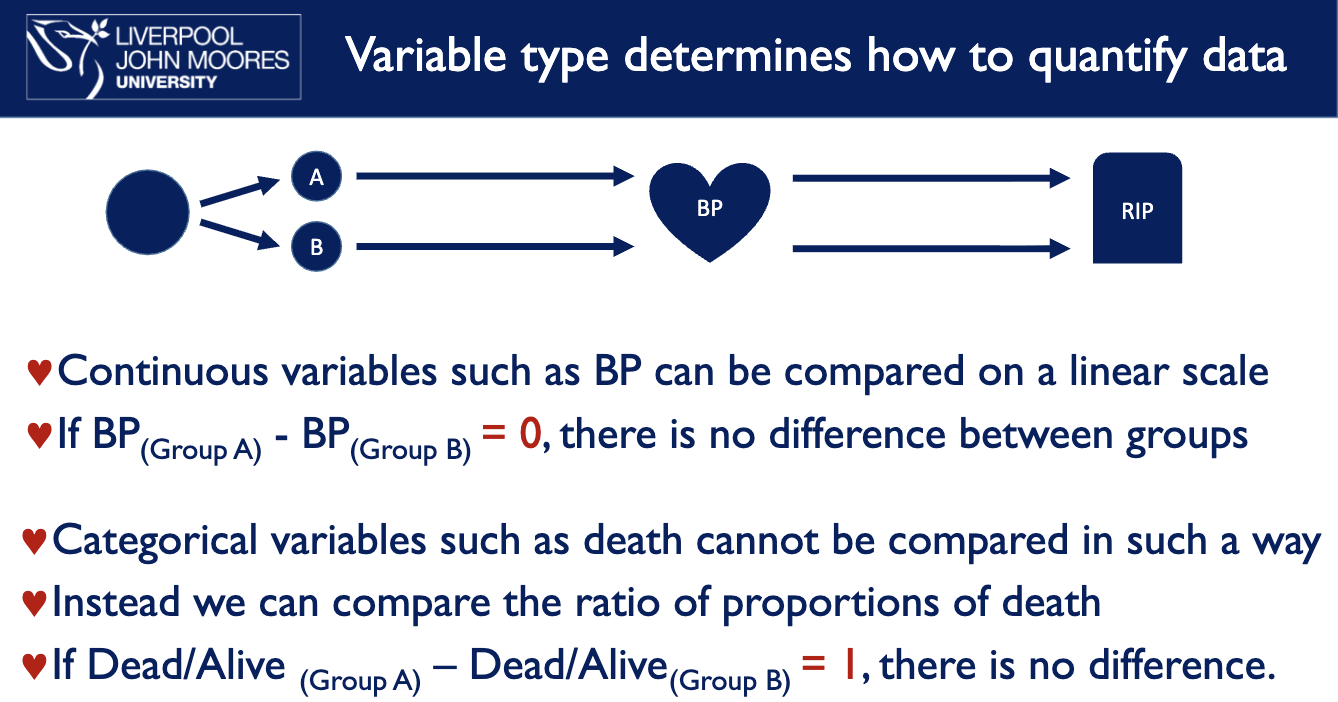
what tests do you use for different types of data