AP Psychology Unit 0: Introduction to Psychological Science
Due: Sep 4, 2025, 8:29 PM
1/76
There's no tags or description
Looks like no tags are added yet.
Name | Mastery | Learn | Test | Matching | Spaced | Call with Kai |
|---|

77 Terms
Psychodynamic/psychoanalytic perspective
Focuses on unconscious processes and childhood experiences affecting behavior.
Evolutionary perspective
Examines how natural selection of traits promotes survival of genes.
Behavioral perspective
A psychological approach that emphasizes the study of observable behaviors and the ways in which they are learned and reinforced.
Biological perspective
This perspective in psychology emphasizes the impact of genetic, hormonal, and neurochemical processes on behavior.
Cognitive perspective
Explores how we encode, process, store, and retrieve information.
Socio-cultural perspective
Looks at how social and cultural environments influence behavior.
Biopsychosocial perspective
Considers the combined influence of biological, psychological, and social factors.
Curiosity
A desire to learn and understand.
Skepticism
Questioning and doubting accepted ideas.
Humility
Recognition of one's own limitations and mistakes.
Critical thinking
Analyzing information and arguments logically and objectively.
Cultural norms
Shared rules or guidelines within a culture.
Cognitive biases
Systematic patterns of deviation from norm or rationality in judgment.
Confirmation bias
Tendency to search for, interpret, and remember information that confirms one's beliefs.
Hindsight bias
Belief that one could have predicted an outcome after knowing it occurred.
Overconfidence
Tendency to overestimate one's own abilities and knowledge.
Peer reviewers
Experts who evaluate and critique research before publication.
Theory
Explanation of phenomena based on observations and reasoning.
Hypothesis
Testable prediction derived from a theory.
Falsifiability
Ability of a hypothesis to be proven false.
Operational definition
Precise description of how variables are measured or manipulated.
Replication
Repeating a study to see if the results can be duplicated.
Variable
Any factor that can change and is measurable.
Participant
Individual who participates in research.
Sample
Subset of individuals selected from a population for a study.
Population
Entire group of individuals a researcher is interested in.
Representative sample
Sample that accurately reflects the characteristics of the population.
Random sampling
Every member of a population has an equal chance of being selected.
Convenience sampling
Selecting participants based on availability and convenience.
Sampling bias
Systematic error due to a non-random sample of a population.
Survey
Data collection tool that involves asking people questions.
Self-report bias
Participants may not provide accurate or truthful responses.
Generalizability
Extent to which research findings apply to settings or groups other than the sample studied.
Case study
In-depth analysis of a single individual or group.
Naturalistic observation
Observing subjects in their natural environment without interference.
Experiment
Research method involving manipulation of variables to establish cause and effect.
Correlation
Measure of the relationship between two variables.
Correlation coefficient
Numerical representation of the strength and direction of a relationship between two variables.
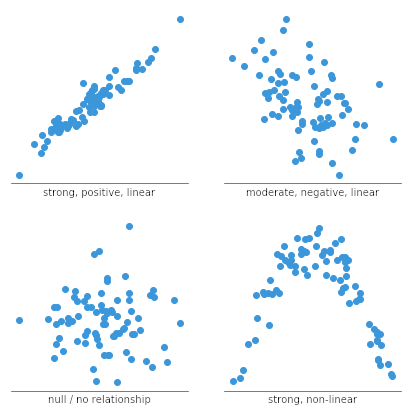
Scatterplot
Graph that shows the relationship between two variables using dots.
Independent variable
Variable that is manipulated by the researcher.
Dependent variable
Variable that is measured and affected in an experiment.
Confounding variable
Variable other than the independent variable that could influence the results.
Random assignment
Assigning participants to groups by chance to minimize preexisting differences.
Experimental group
Group that receives the treatment in an experiment.
Control group
Group that does not receive the treatment and is used for comparison.
Placebo
Inactive substance or treatment given to the control group.
Single-blind
Participants do not know if they are in the experimental or control group.
Double-blind
Both the researchers and participants do not know who is in the experimental or control group.
Experimenter bias
Unconscious influence of researchers' expectations on the outcome of the study.
Social desirability bias
Tendency to respond in a manner that will be viewed favorably by others.
Representation
Degree to which the sample reflects the population.
Peer review
Process by which other experts evaluate research for quality and validity.
Institutional review
Review of research proposals for ethical considerations.
Institutional Review Board (IRB)
Committee that reviews and approves research involving human participants.
Informed consent
Participants' agreement to take part in a study after being informed of its purpose and procedures.
Informed assent
Agreement from a minor to participate in research, in addition to parental consent.
Protection from harm
Ensuring participants are not harmed physically or psychologically.
Confidentiality
Keeping participants' data and identity private.
Deception
Misleading participants about the true purpose of a study.
Debriefing
Informing participants about the true purpose of the study after it has concluded.
Descriptive statistics
Methods used to summarize and describe the main features of a data set.
Histogram
Bar graph that represents the frequency distribution of a data set.
Mode
Most frequently occurring score in a data set.
Mean
Average of a data set.
Median
Middle score in a data set.
Percentile rank
Percentage of scores in its frequency distribution that are equal to or lower than it.
Regression toward the mean
Phenomenon where extreme scores tend to move closer to the mean over time.
Skewed distribution
Distribution that is not symmetrical and has scores that cluster to one side.
Range
Difference between the highest and lowest scores in a data set.
Standard deviation
Measure of how spread out the scores are in a data set.
Normal curve
Bell-shaped curve representing a distribution of scores.
Inferential statistics
Techniques used to determine if results can be generalized to a larger population.
Meta-analysis
Combining data from multiple studies to draw a broader conclusion.
Statistical significance
The likelihood that a study's results are not due to random chance.
Effect size
Measures the strength of the relationship between variables, indicating how impactful the findings are within a study.
Positive Correlation
A relationship where an increase in one variable is associated with an increase in another variable, indicating a direct connection between the two.
Negative Correlation
A relationship where an increase in one variable is associated with a decrease in another variable, indicating an inverse connection between the two.