ECONOMETRICS 1-4
1/35
There's no tags or description
Looks like no tags are added yet.
Name | Mastery | Learn | Test | Matching | Spaced | Call with Kai |
|---|
No analytics yet
Send a link to your students to track their progress
36 Terms
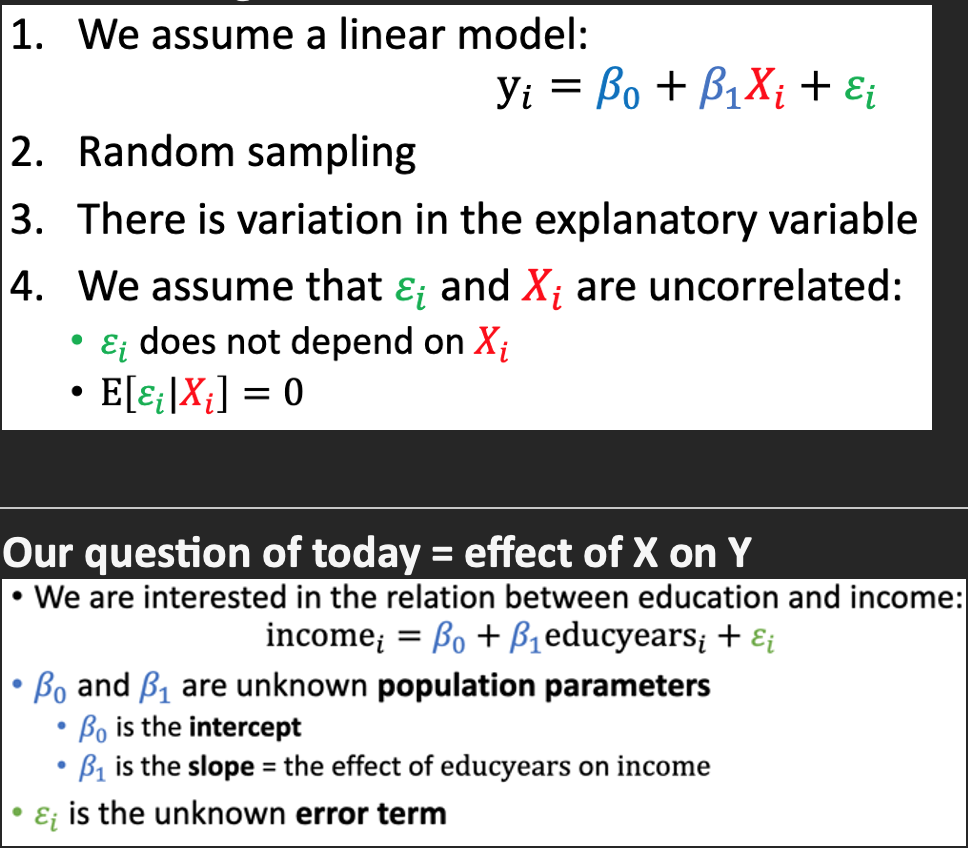
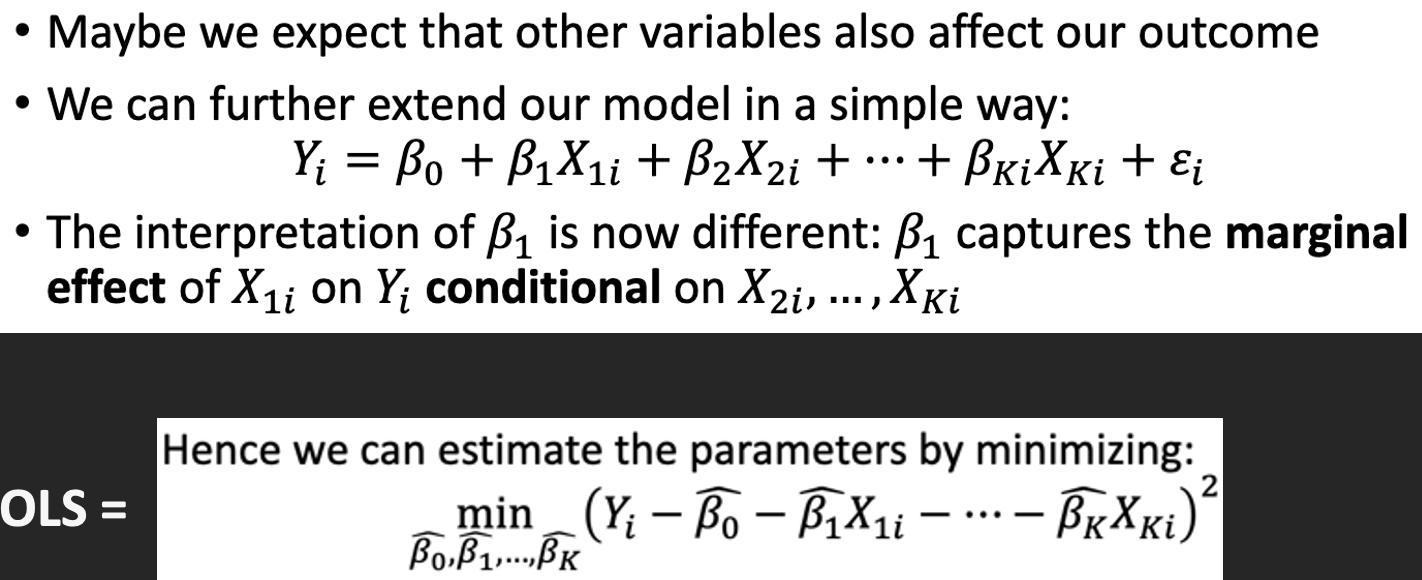
Formula for linear regression:
+ assumptions
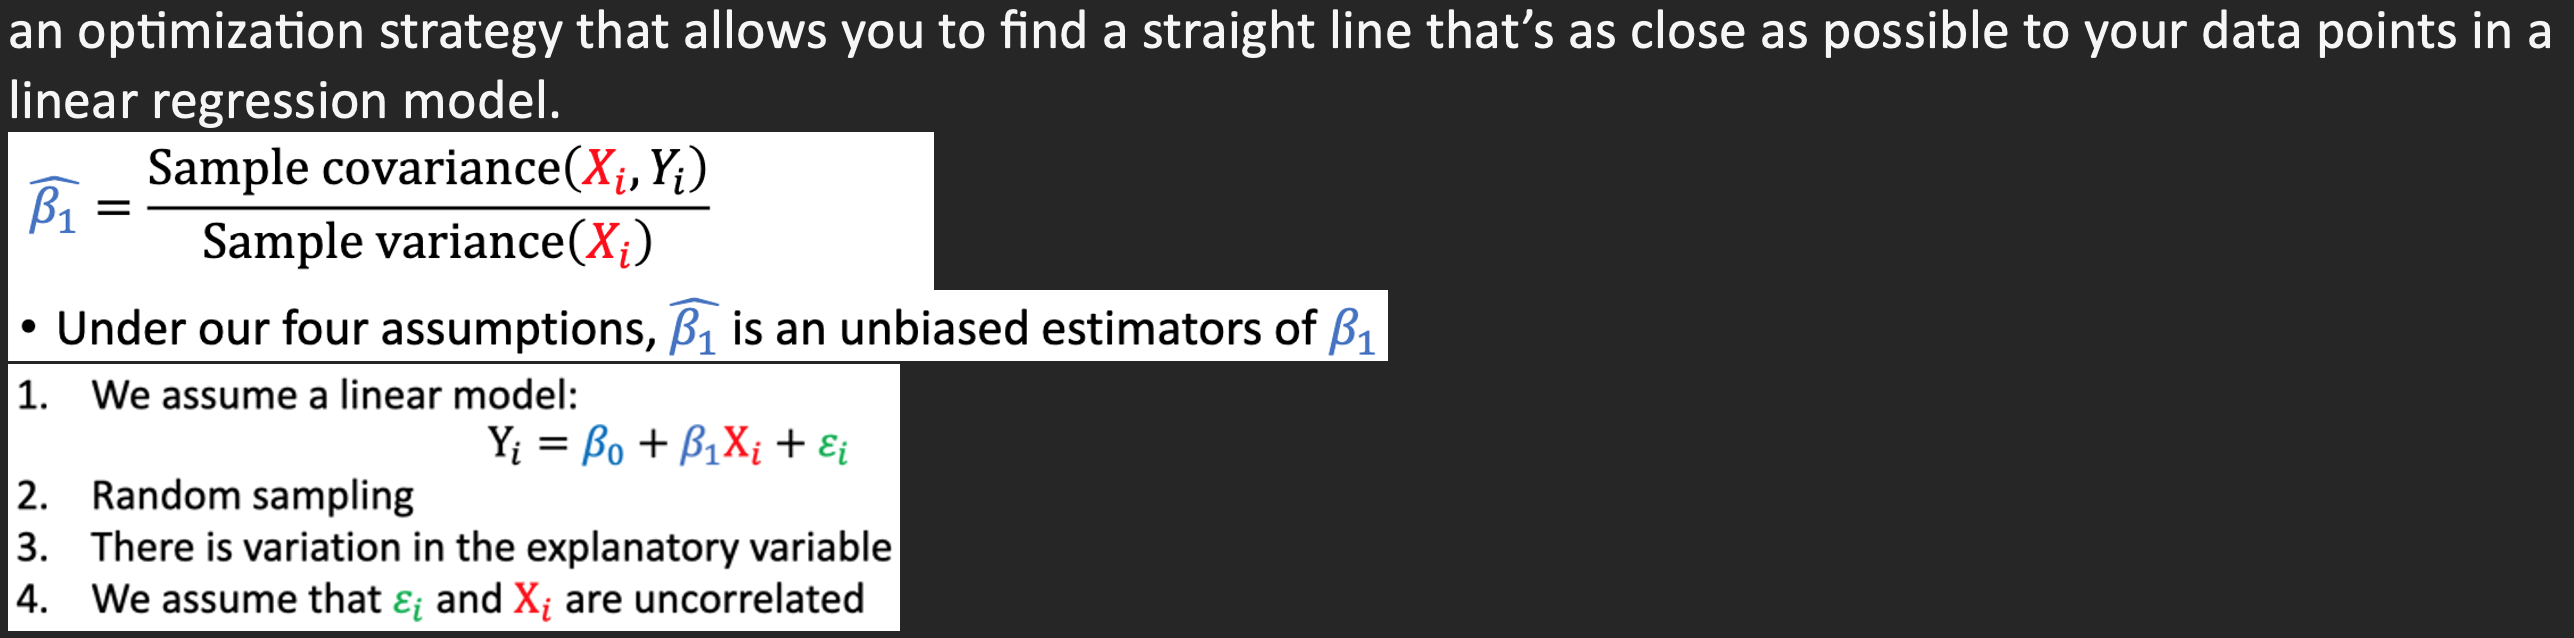
Unbiased estimator
Sample statistic is on average equal to the population parameter => estimator is unbiased estimator

Ordinary Least Squares (OLS); filmpje bekijken
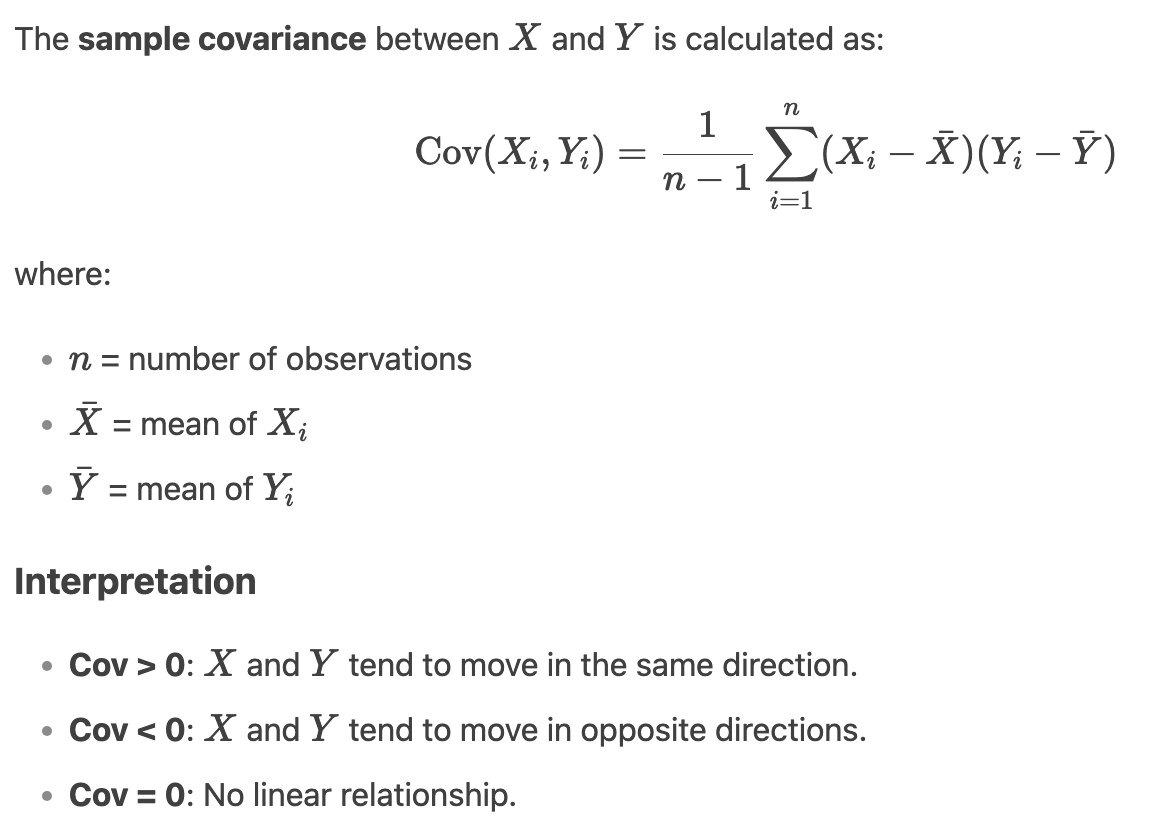
Covariance =
Multivariate case (multiple X)
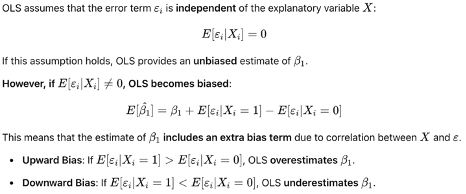
Bias in OLS Estimation
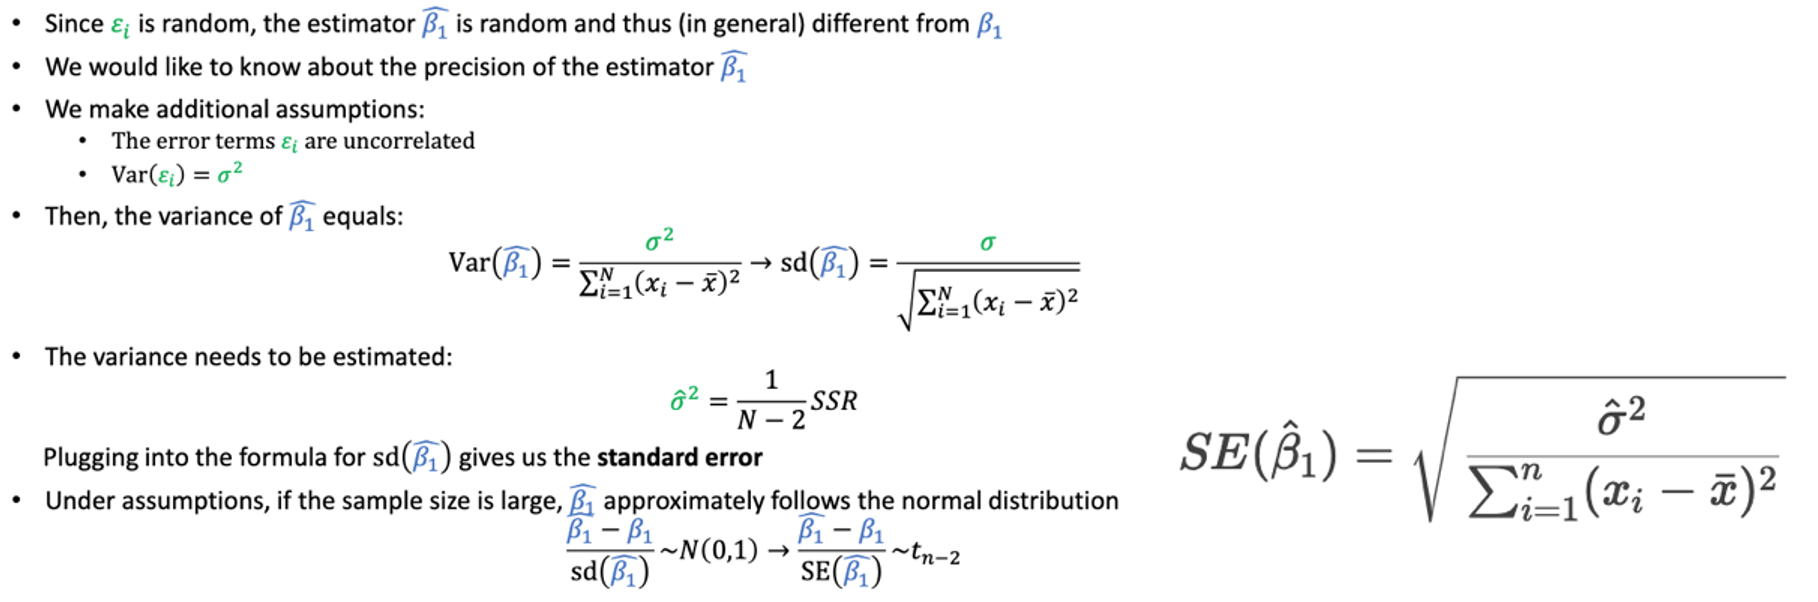
Uncertainty in the estimator:
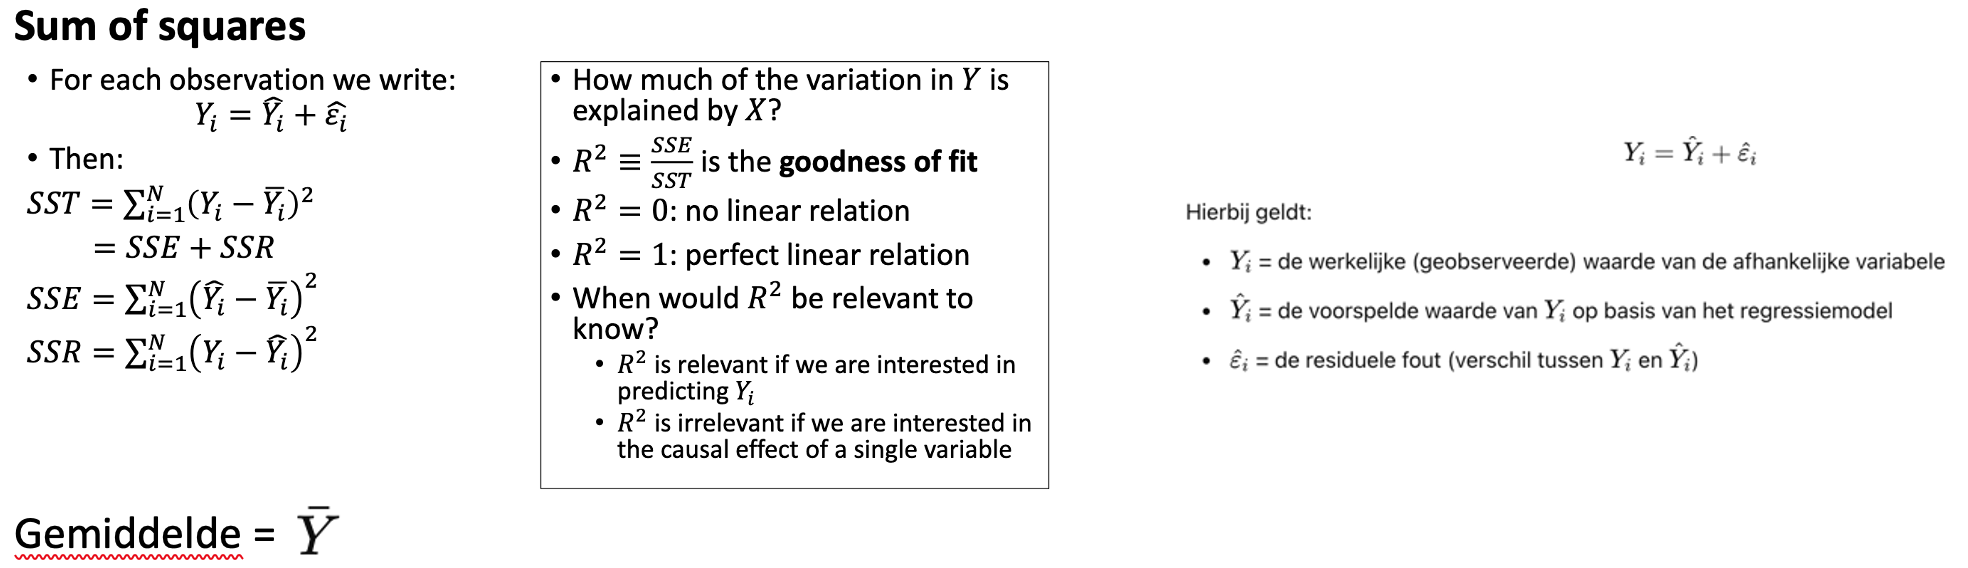
Sum of squares
SST = Total Sum of Squares
SSE = Explained Sum of Squares
SSR = Residual Sum of Squares
Uncertainty in the estimator:
Standard error
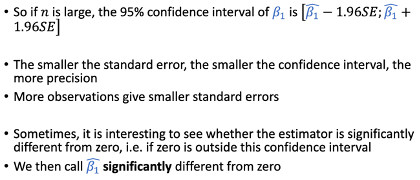
Uncertainty in the estimator:
Confidence of interval
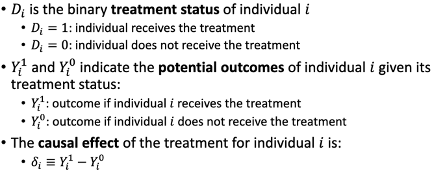
Treatment status + potential outcomes + causal effect formula
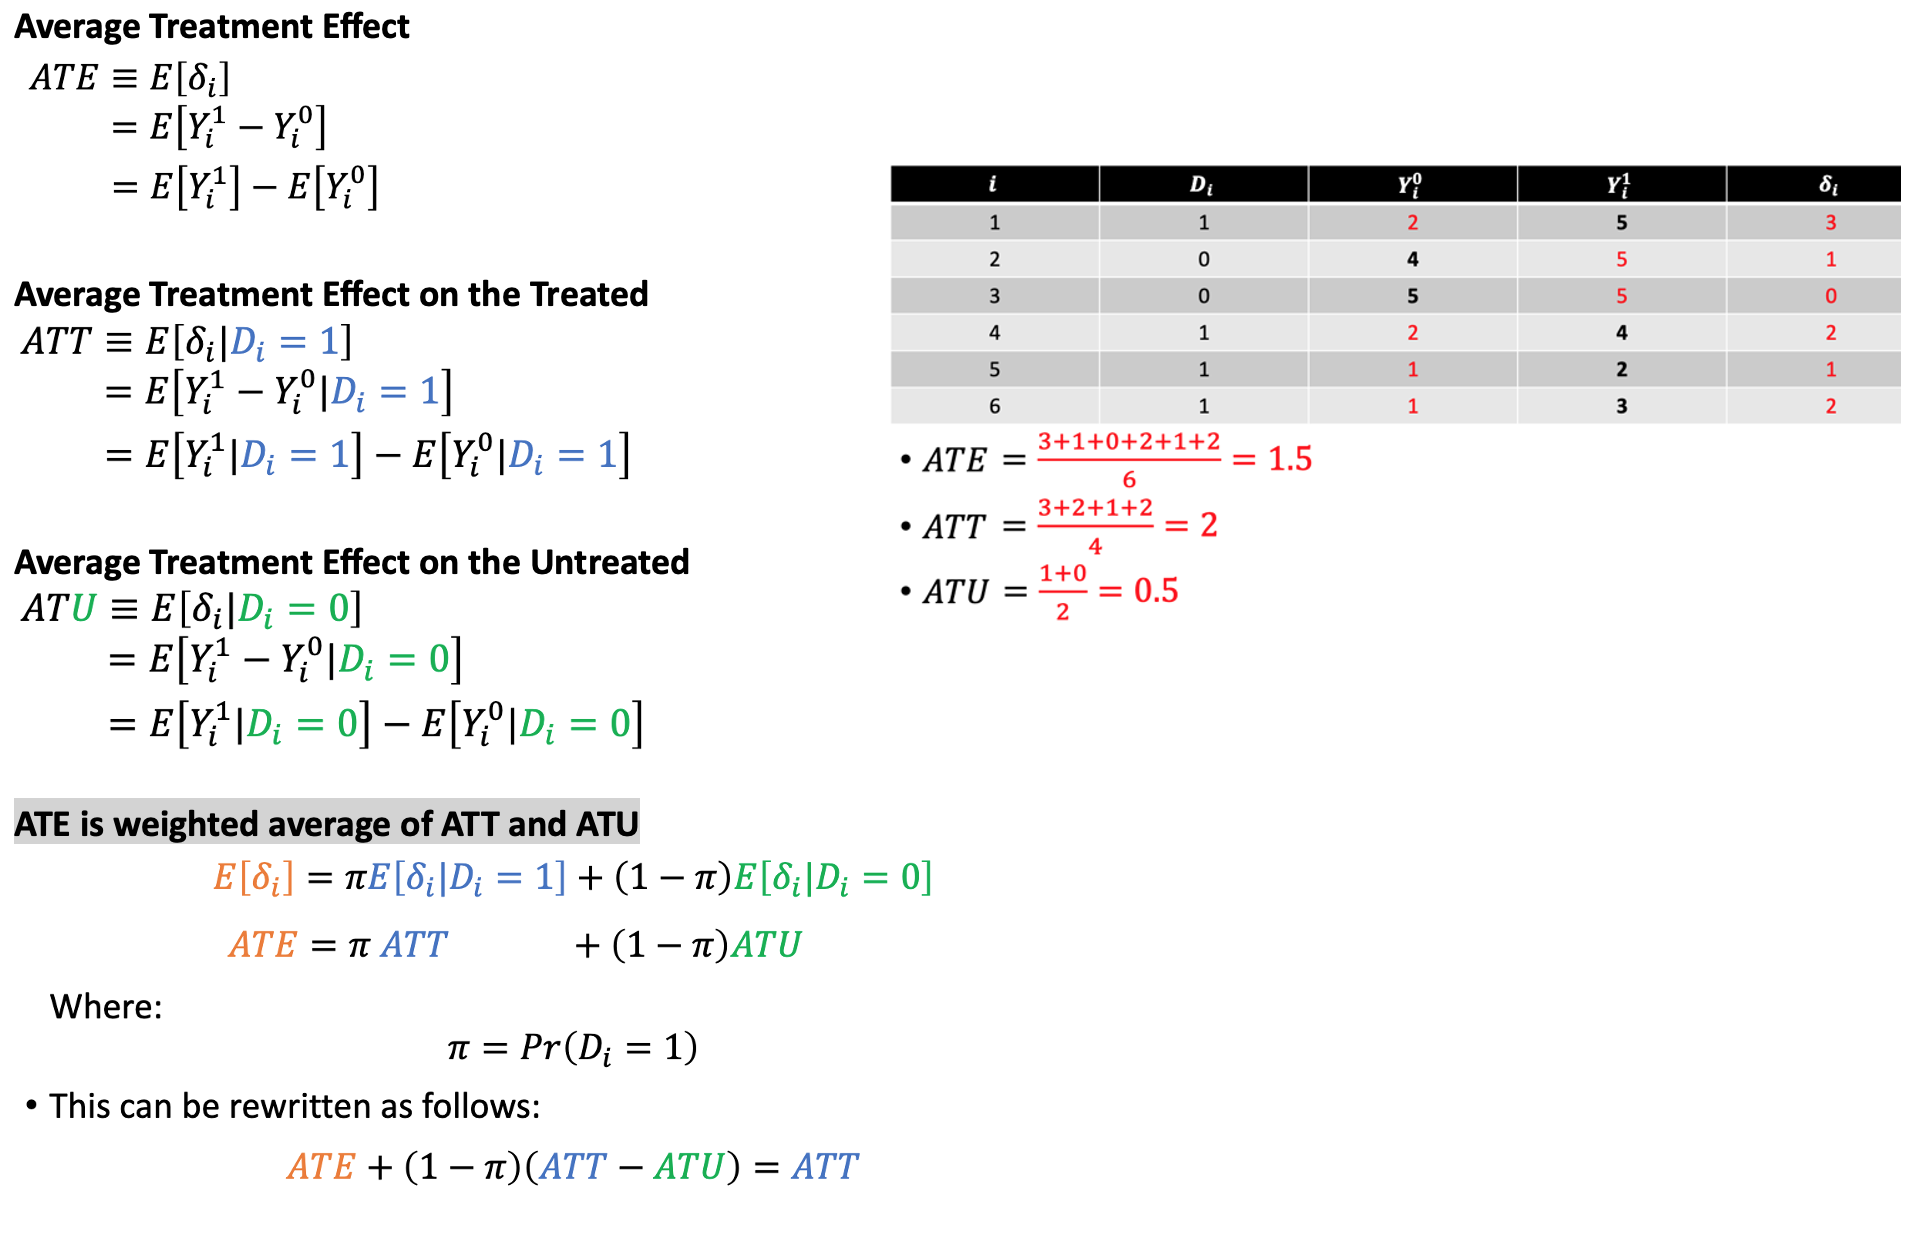
ATE =
ATE on the treated =
ATE on the untreated =
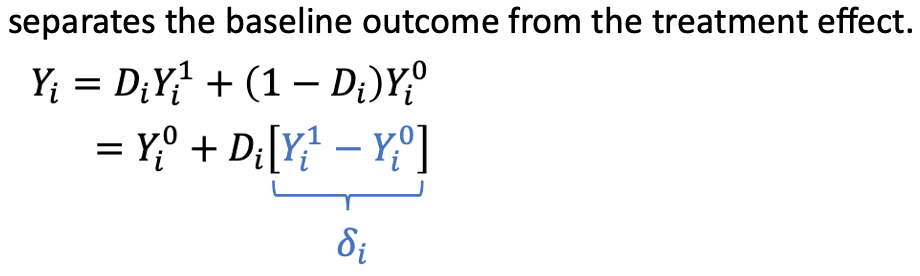
Counterfactual problem
What would the outcome have been if a certain factor had been changed, while keeping all else constant?
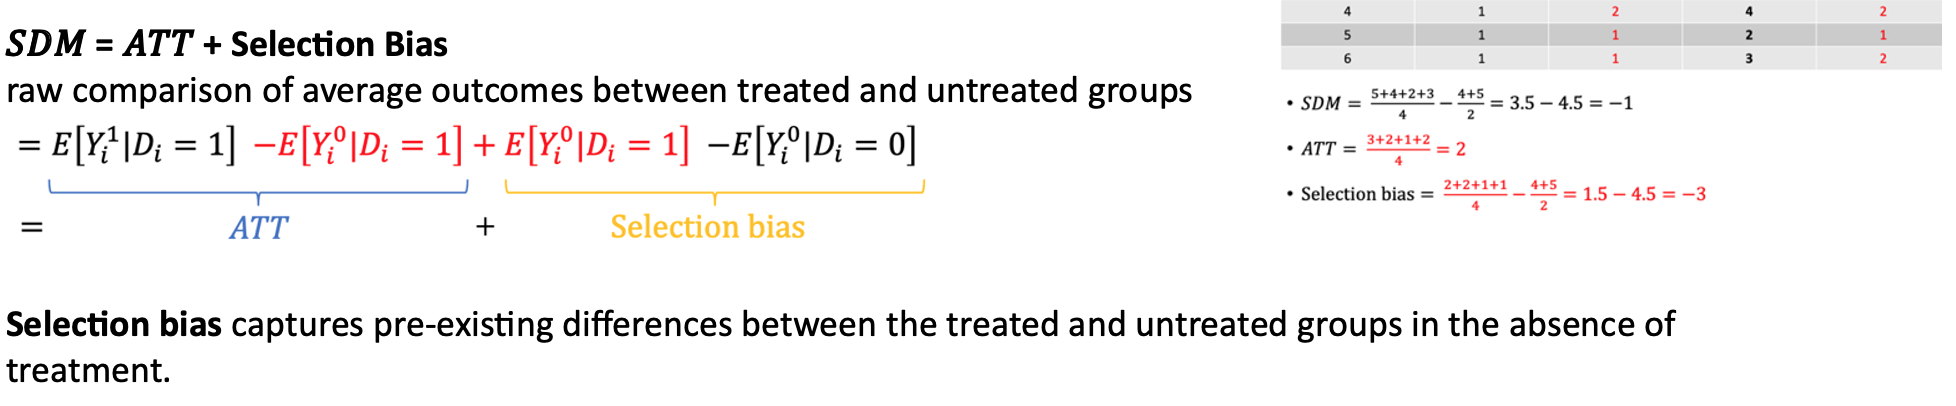
𝑆𝐷𝑀 =
Simple Difference in Means = unadjusted difference in average outcomes between the treated group and the untreated group
Regression Discontinuity (video bekijken)
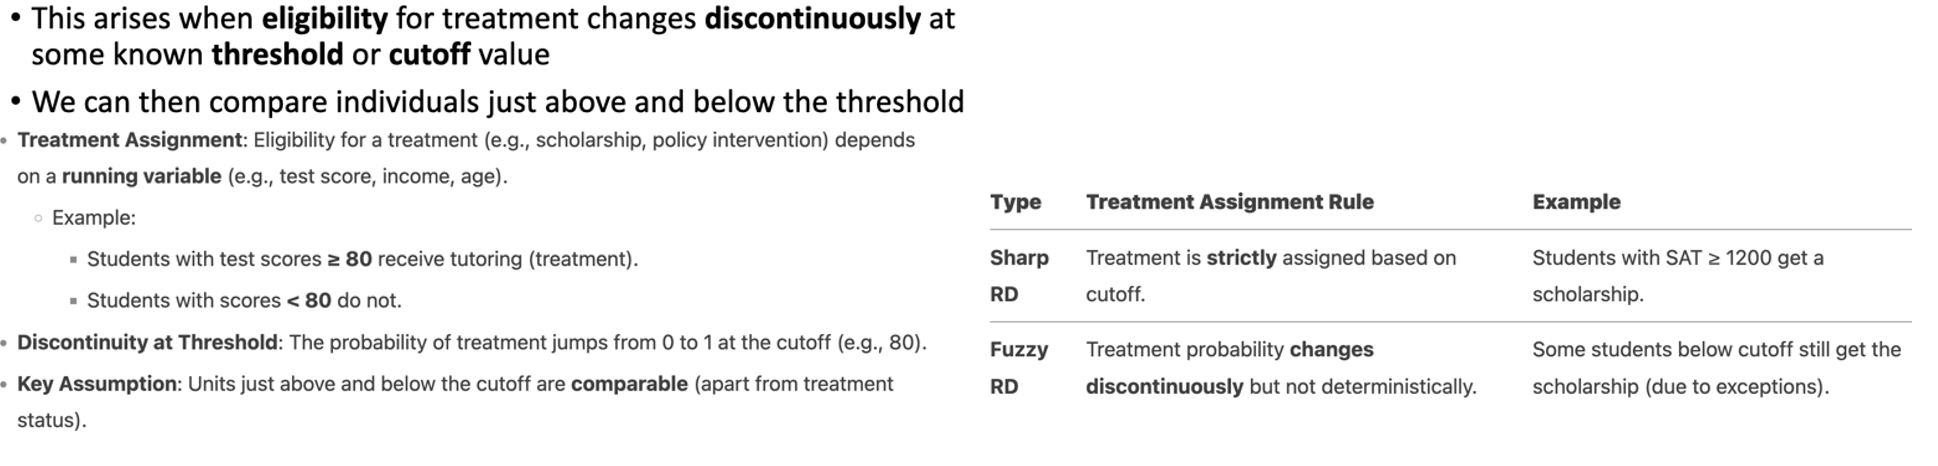
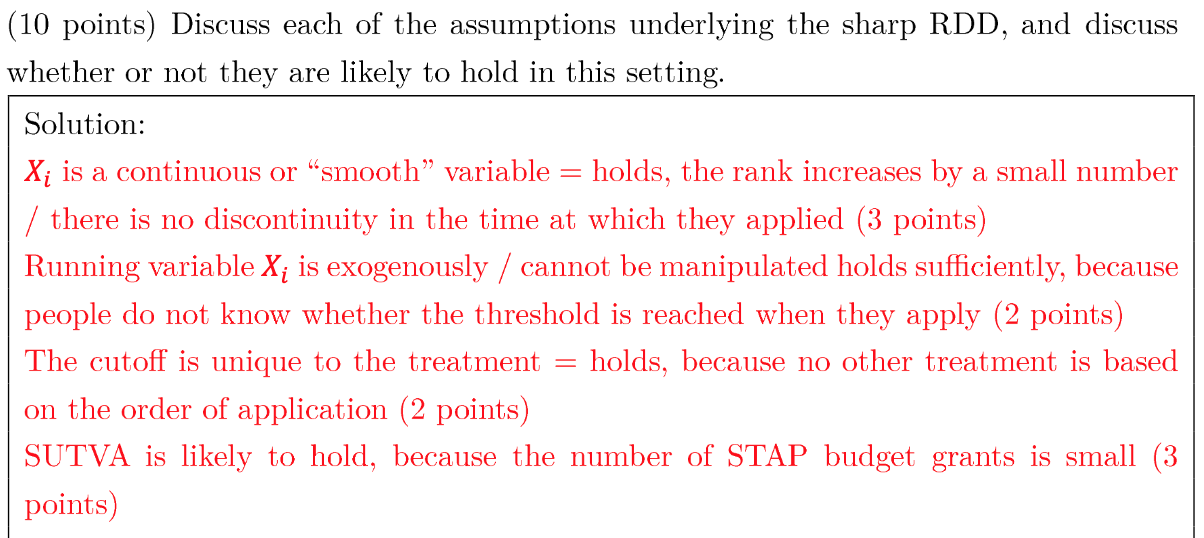
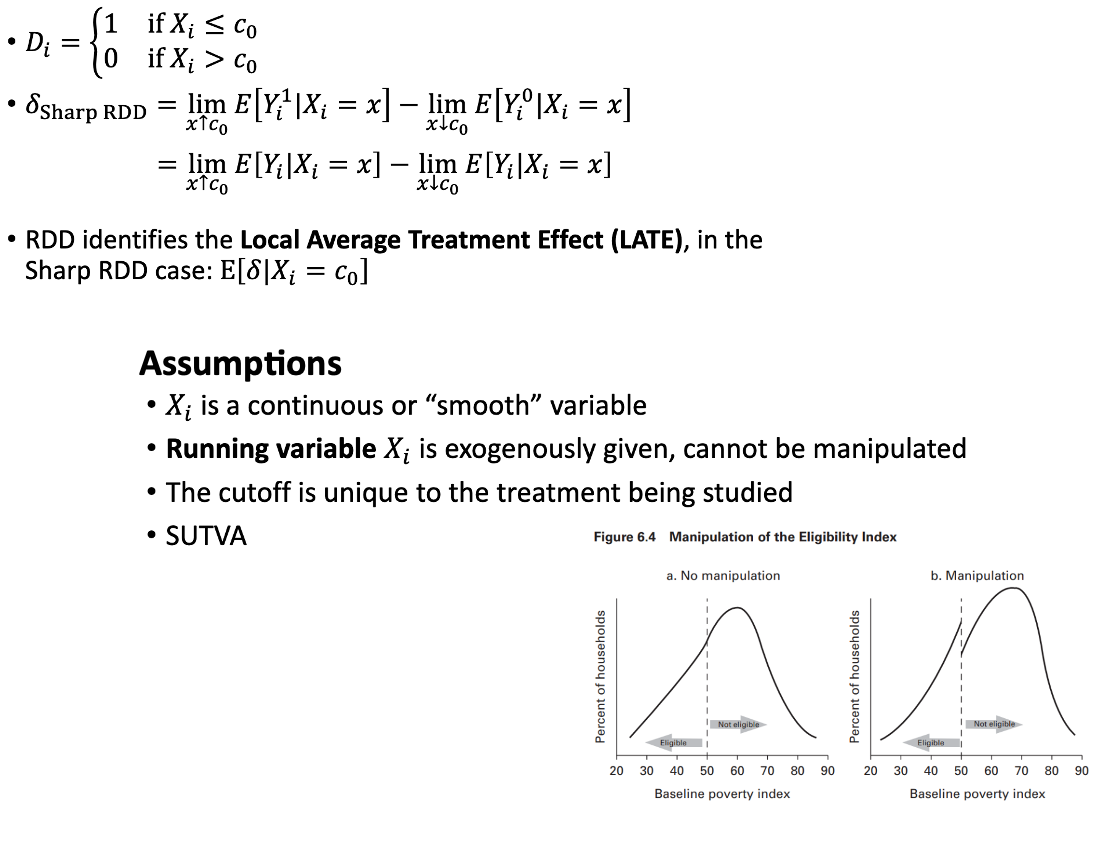
Sharp RDD
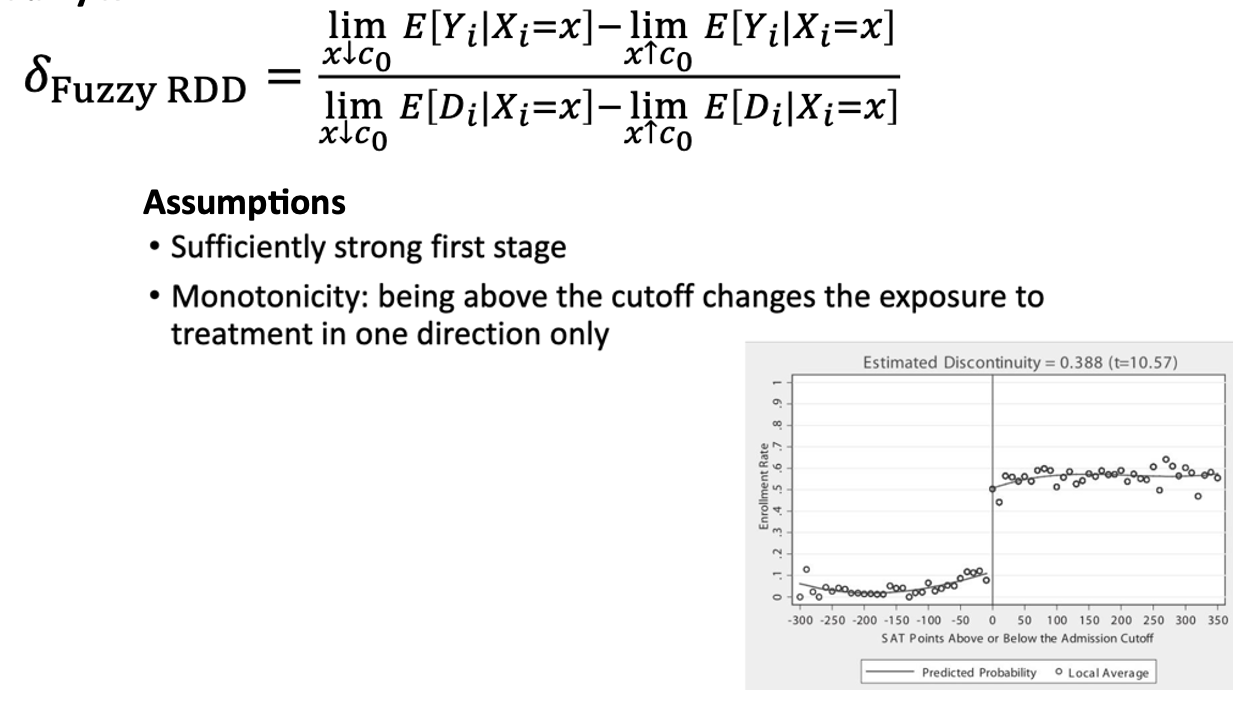
Fuzzy RDD
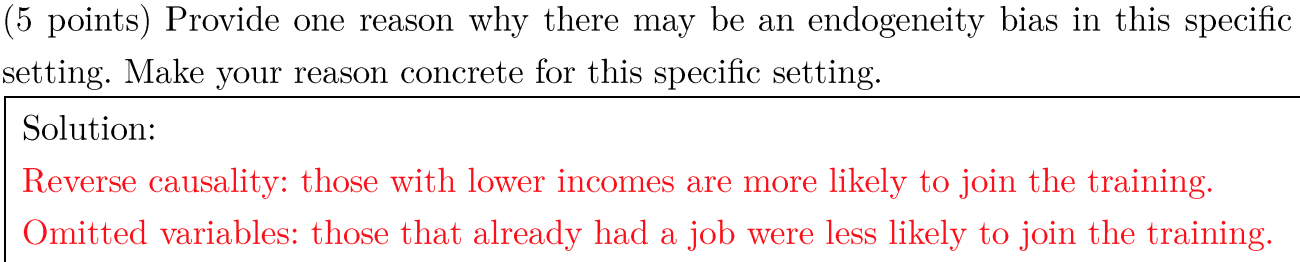
Endogeneity bias =
Part of the difference between the average income of university graduates and non-university graduates is not causal but reflects the better unobserved characteristics.
The variable University𝑖 is endogenous: prospective students choose whether they go for university or not, and this choice is correlated to the error term (which leads to the bias in estimating impact).
Exogenous
If the variable X𝑖 would not be correlated to the error term. This means that 𝑋𝑖 influences Y𝑖, but there is no reverse causality or omitted variable bias affecting both.
Omitted variable bias =
When a relevant variable is left out of a regression model, leading to biased and inconsistent estimates of the included variables
ITT =
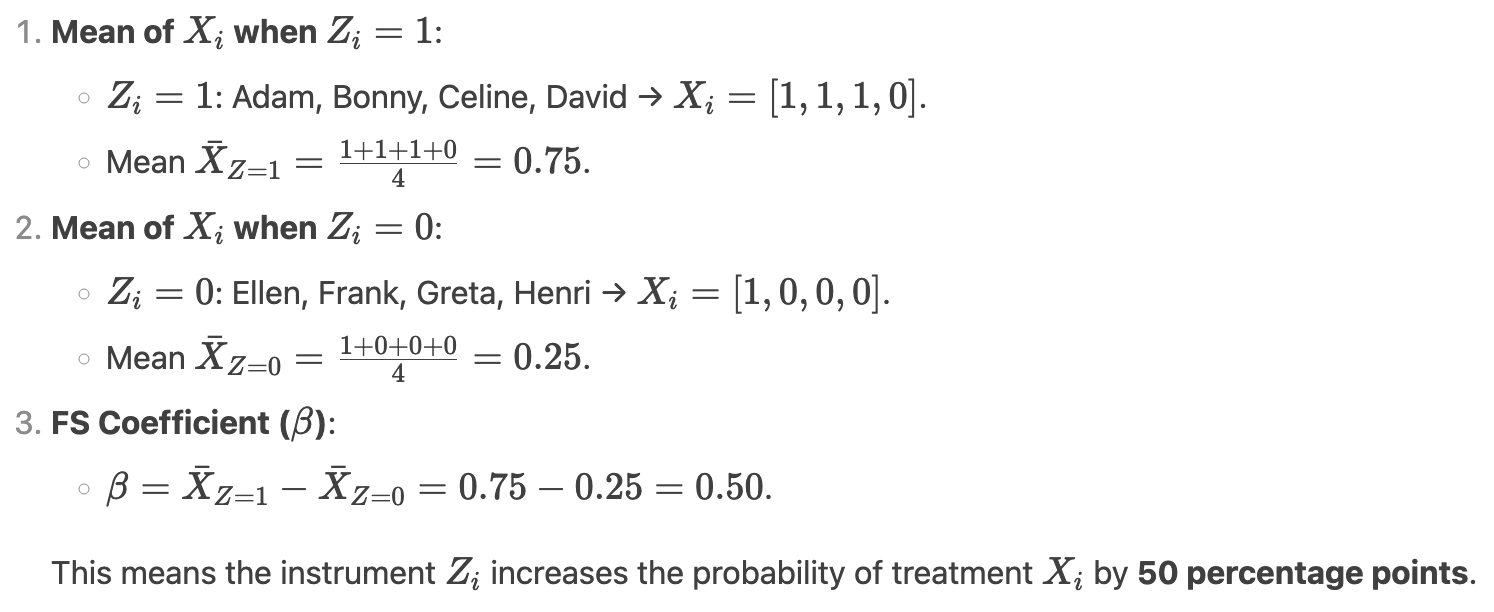
FS =
LATE =
“LATE is externally valid for compliers”
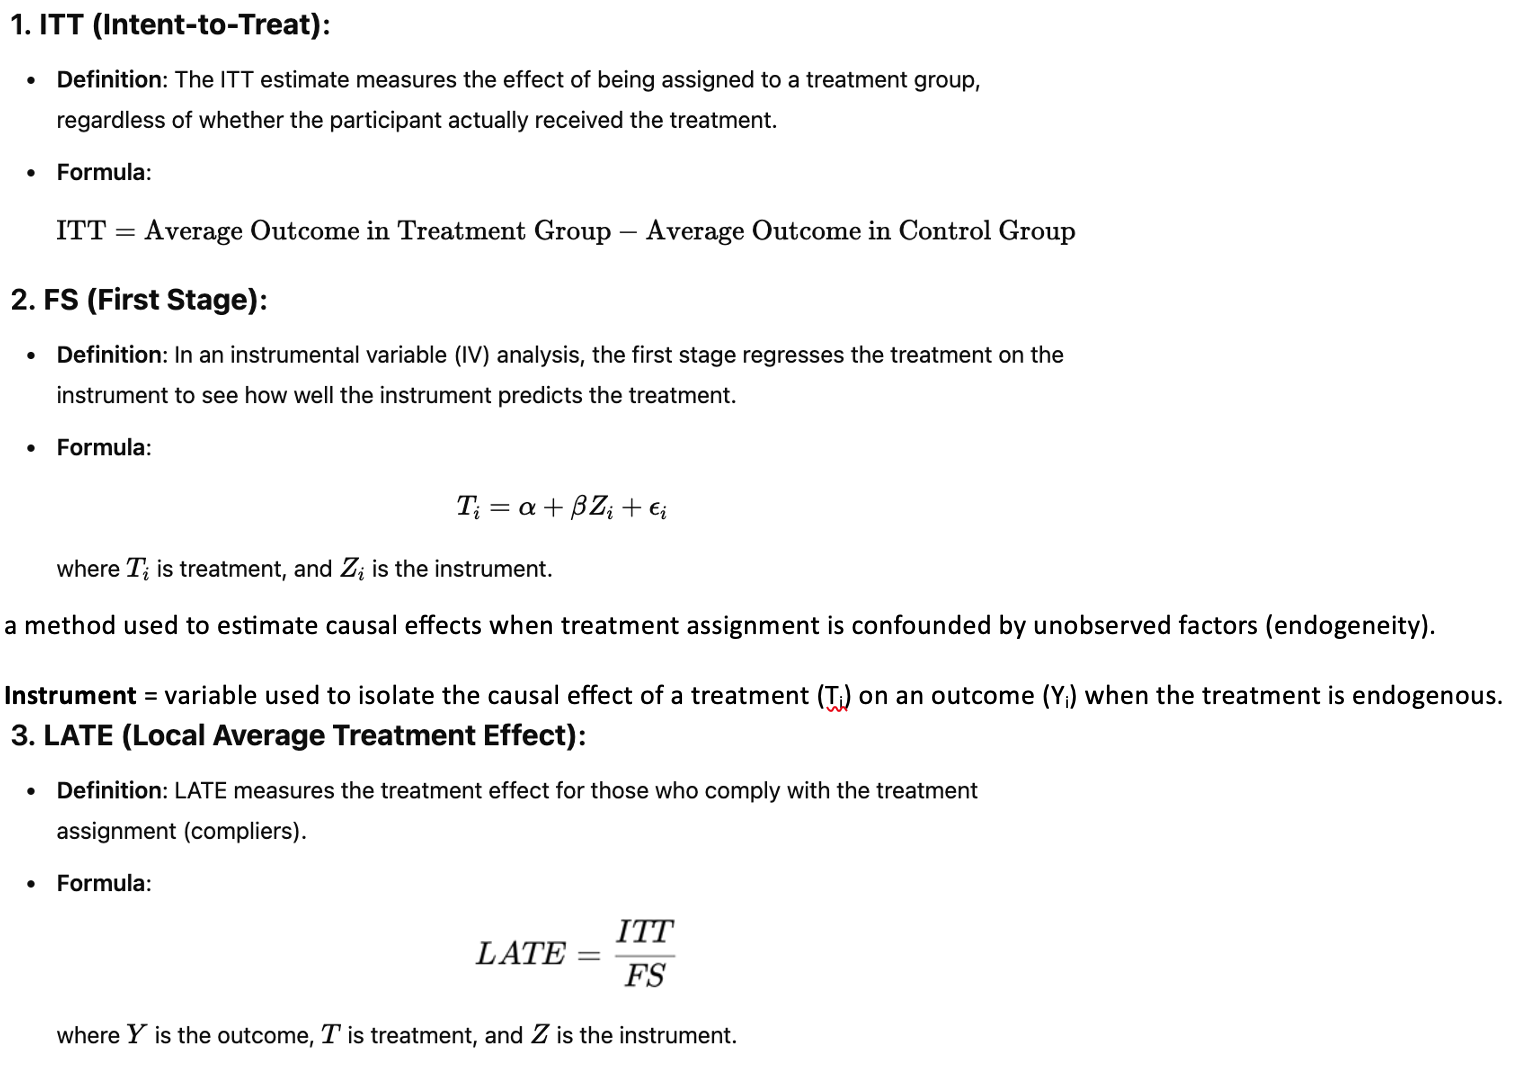
FS =
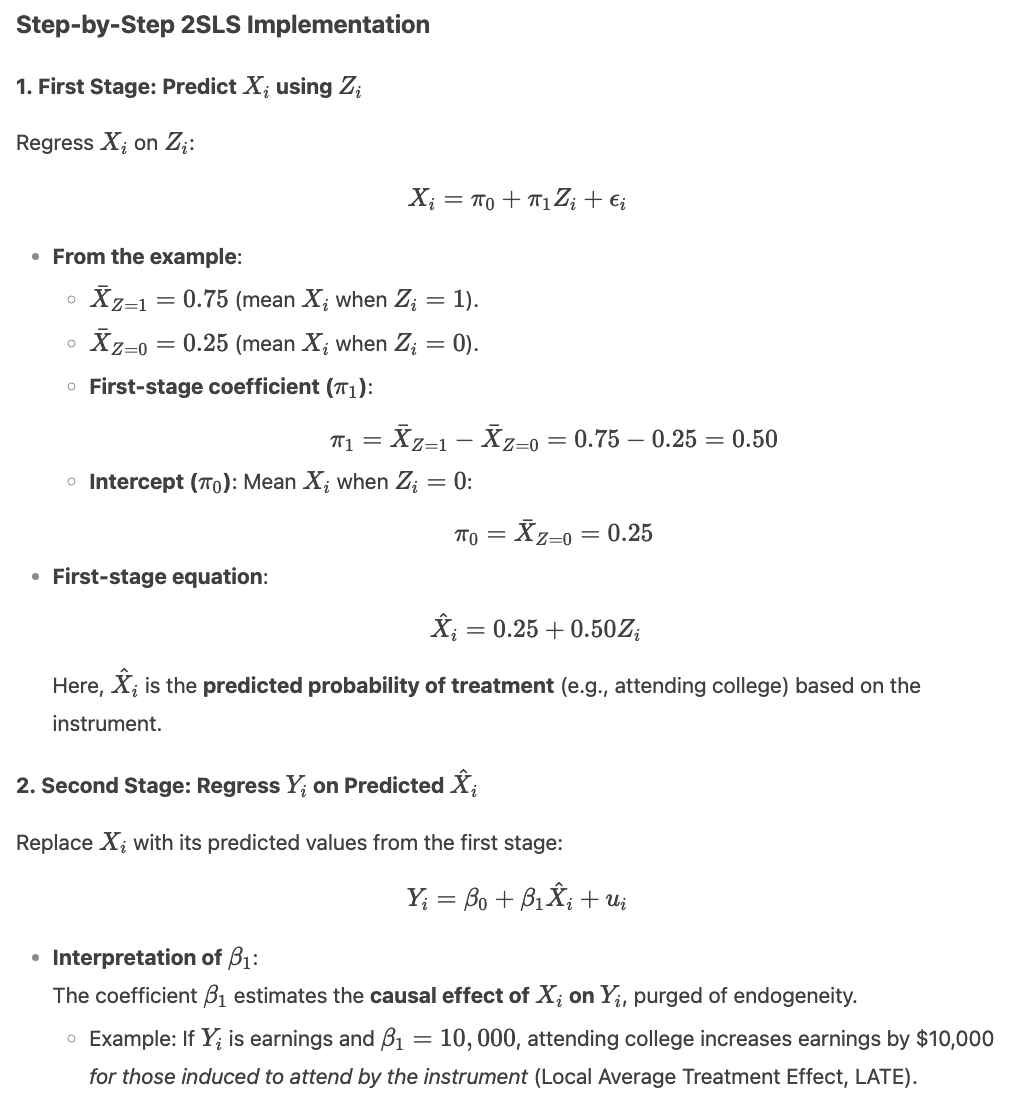
Two-Stage Least Squares (2SLS) (video bekijken) =
Perfect multicollinearity
occurs when one independent variable is an exact linear combination of another.
Panel/longitudinal data =
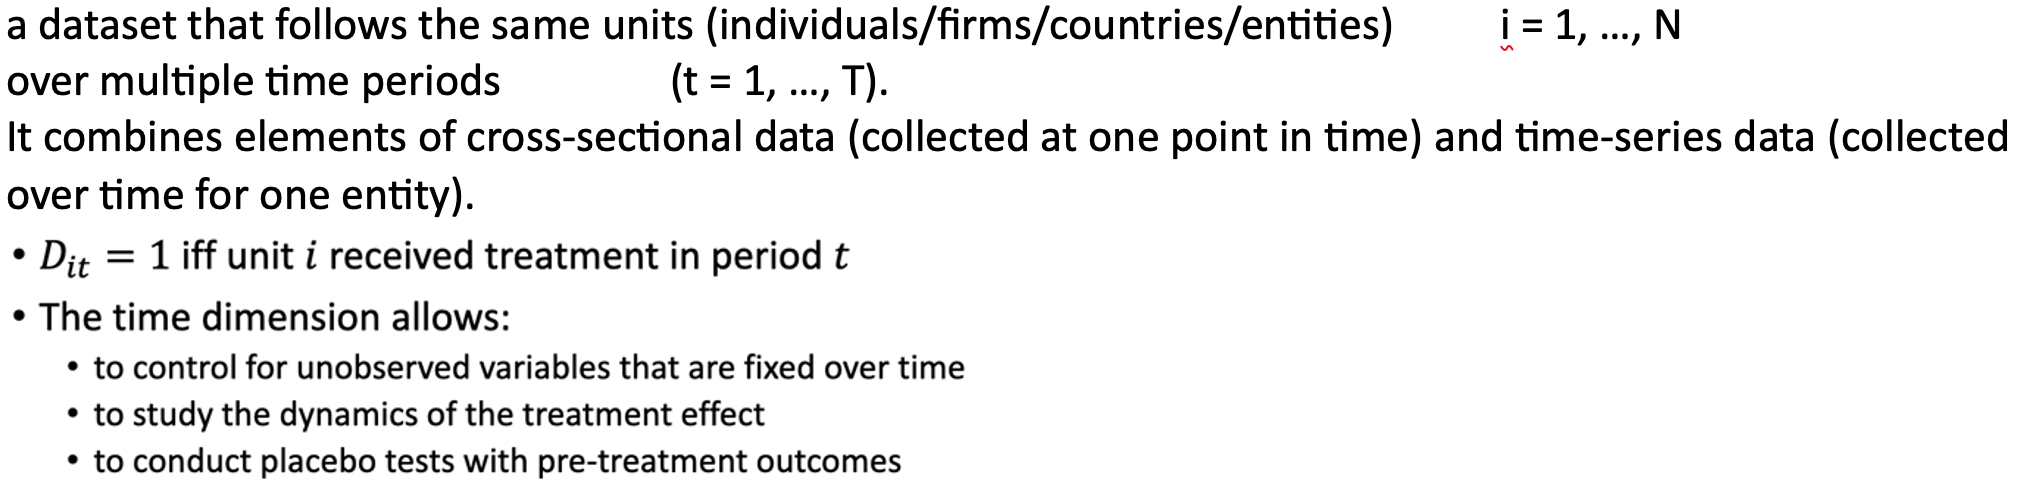
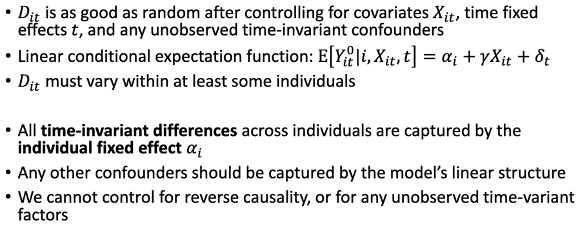
Assumptions paneldata
Confounding variable =
an unmeasured third variable that influences both the supposed cause and the supposed effect.
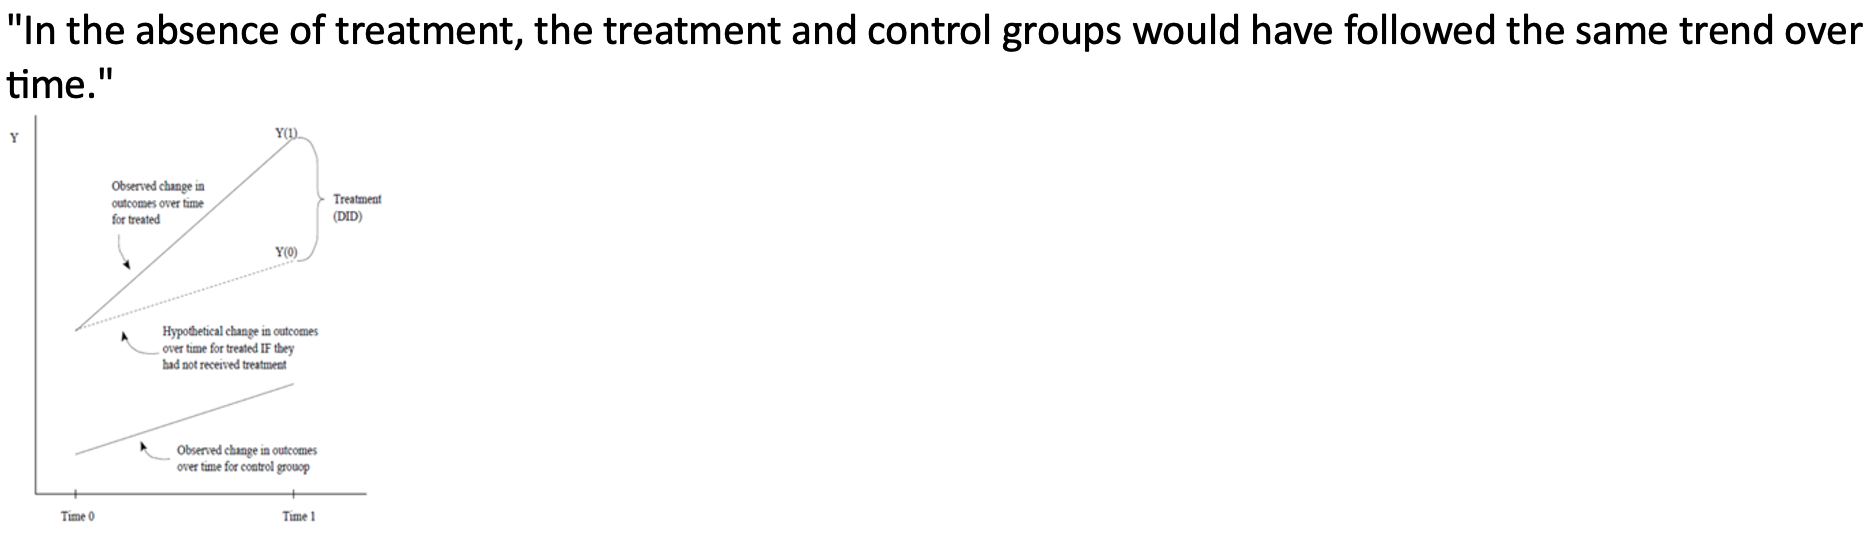
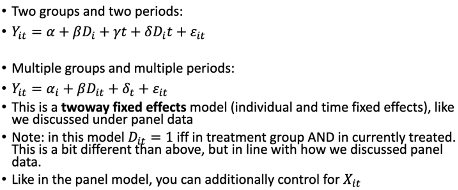
Difference-in-Differences =
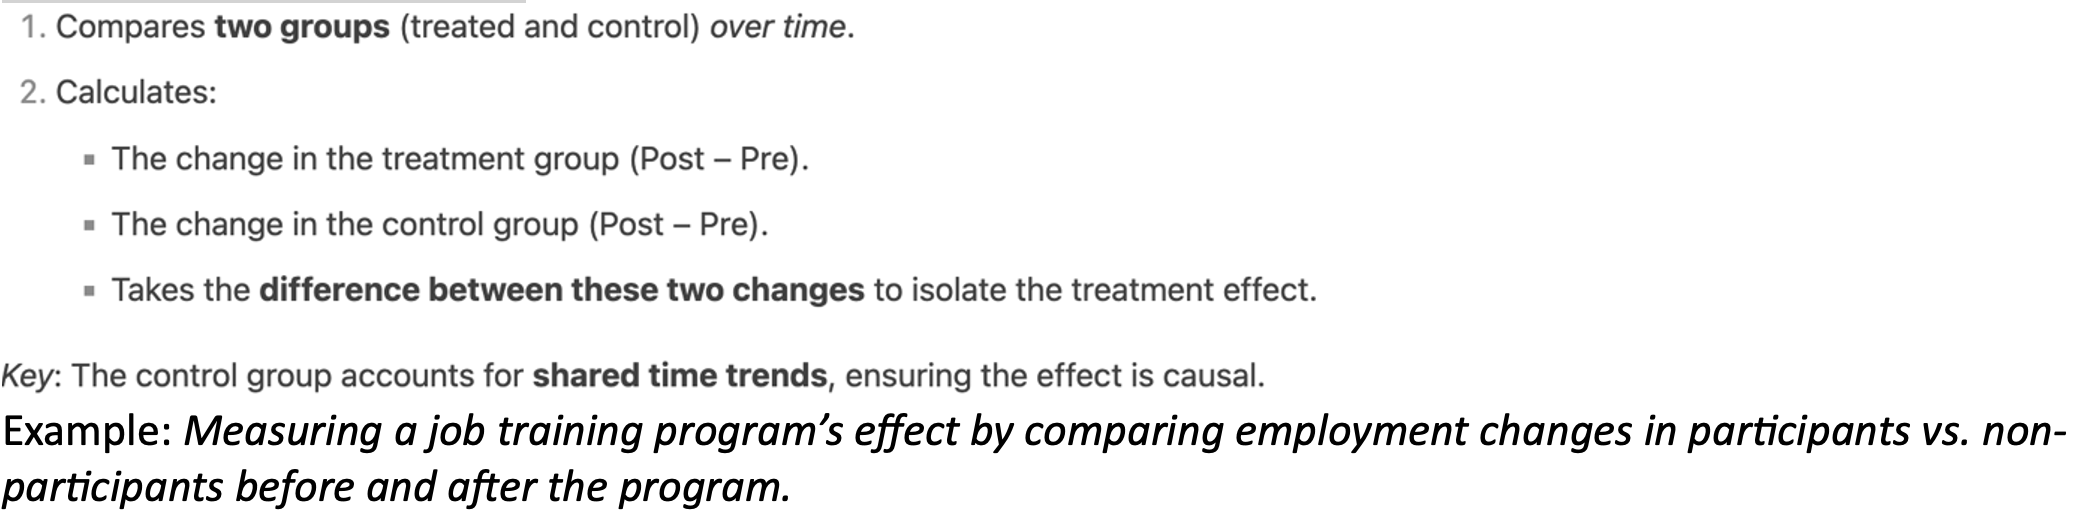
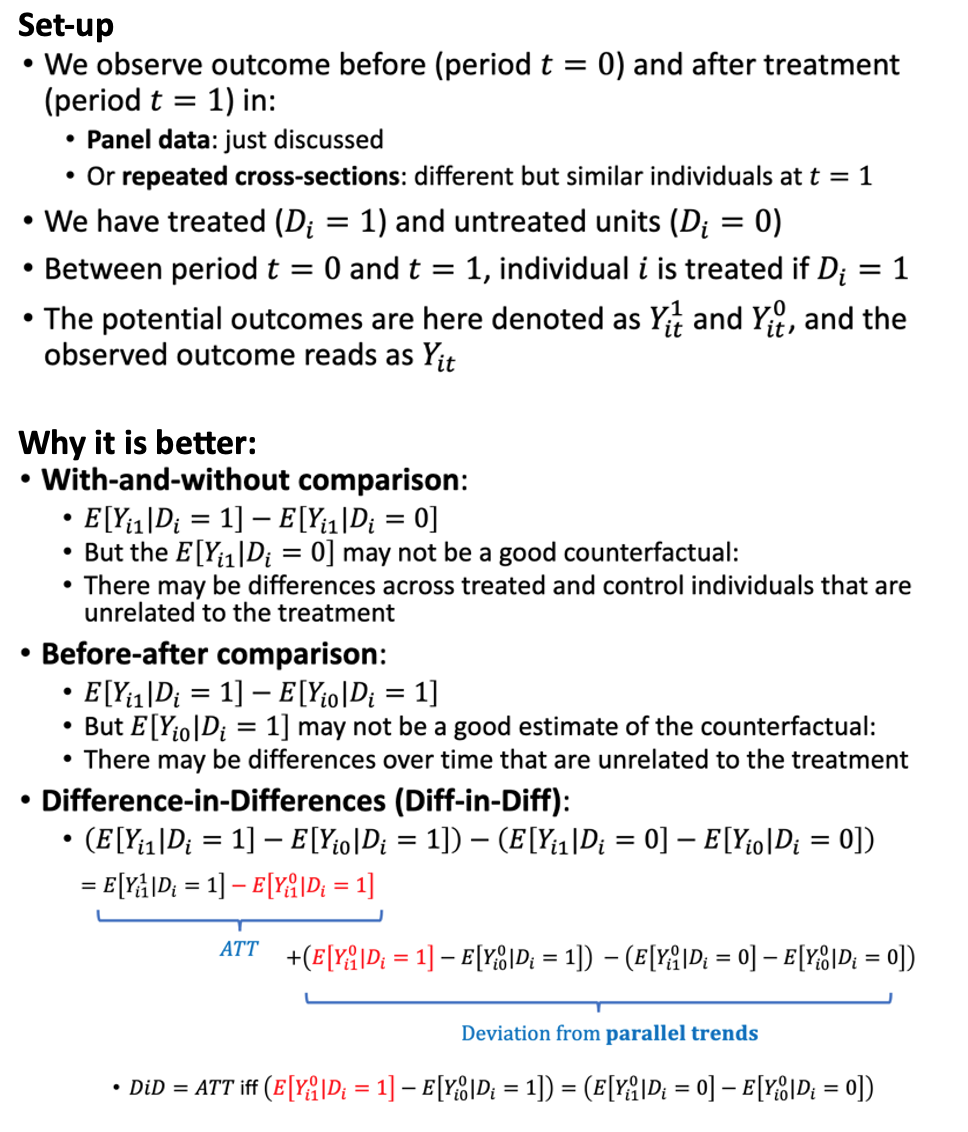
Difference-in-Differences:
Set-up
Why is it better?
Parallel trends assumption
Difference-in-Differences:
estimating using OLS
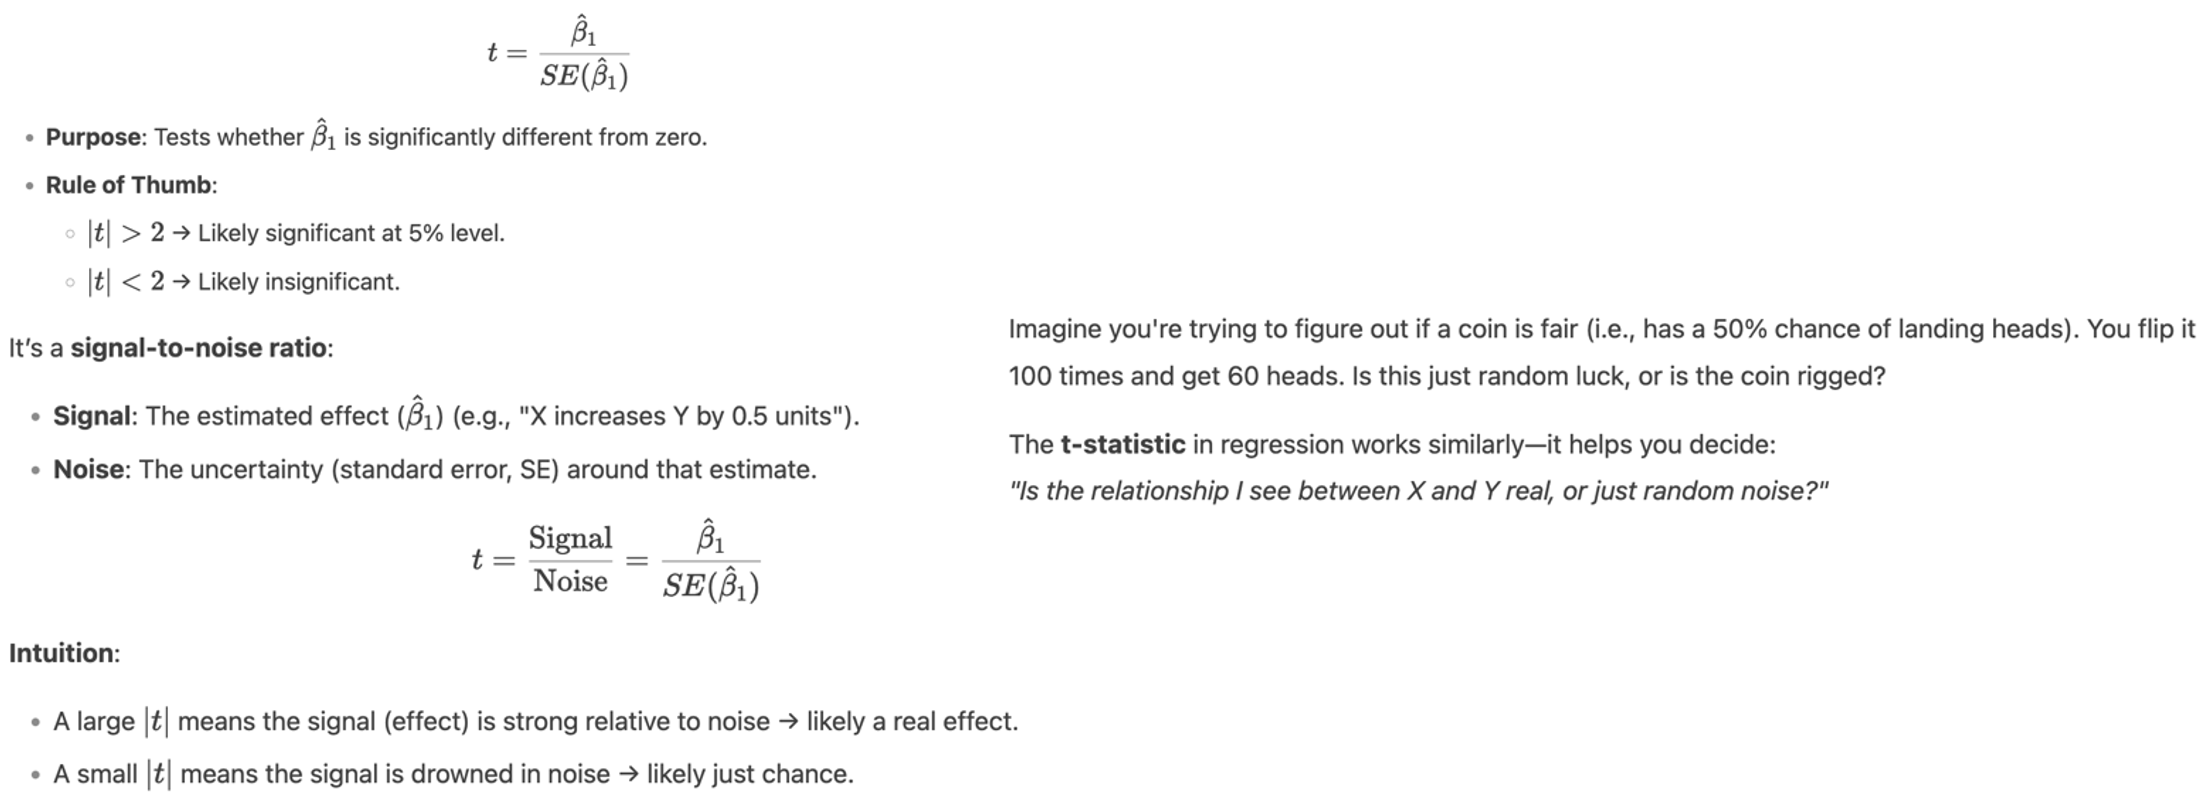
Standard Errors:
t-Statistic
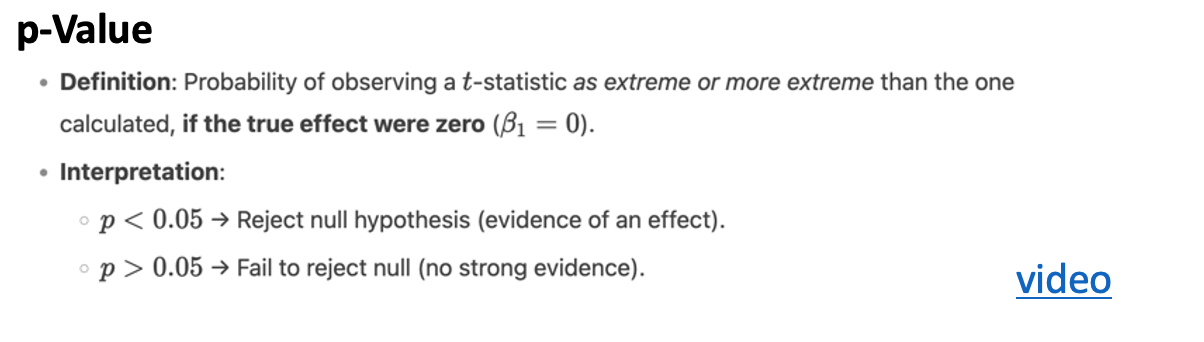
Standard Errors:
p-Value (video)
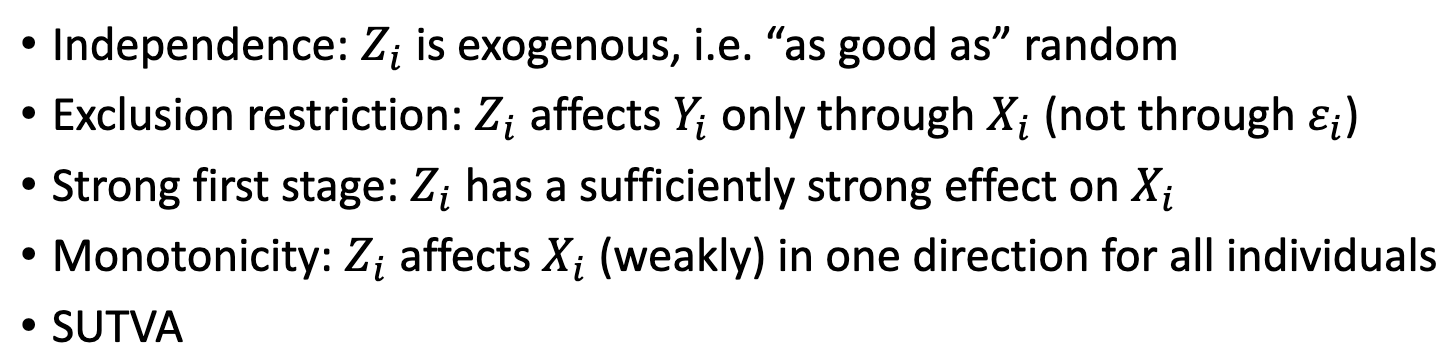
Instrumental variables: Assumptions
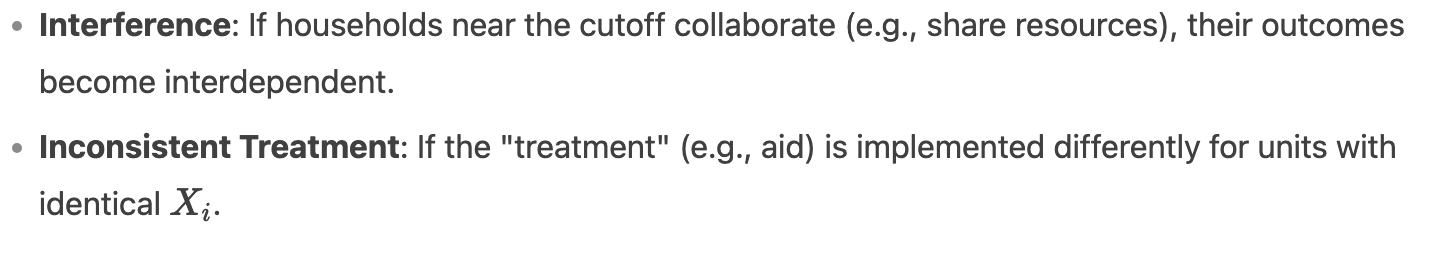
Violations of SUTVA
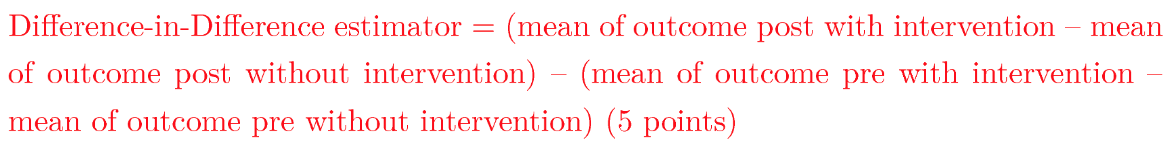
DiD estimator without running a regression
Sharp RDD; assumptions hold or not?