Unsupervised Learning and Clustering Techniques
1/89
There's no tags or description
Looks like no tags are added yet.
Name | Mastery | Learn | Test | Matching | Spaced | Call with Kai |
|---|
No analytics yet
Send a link to your students to track their progress
90 Terms
Unsupervised Learning
Analyzing data without labeled response variables.
Supervised Learning
Predicting outcomes using features and response variables.
Clustering
Grouping similar observations into distinct subgroups.
Hidden Structures
Unseen patterns within the data set.
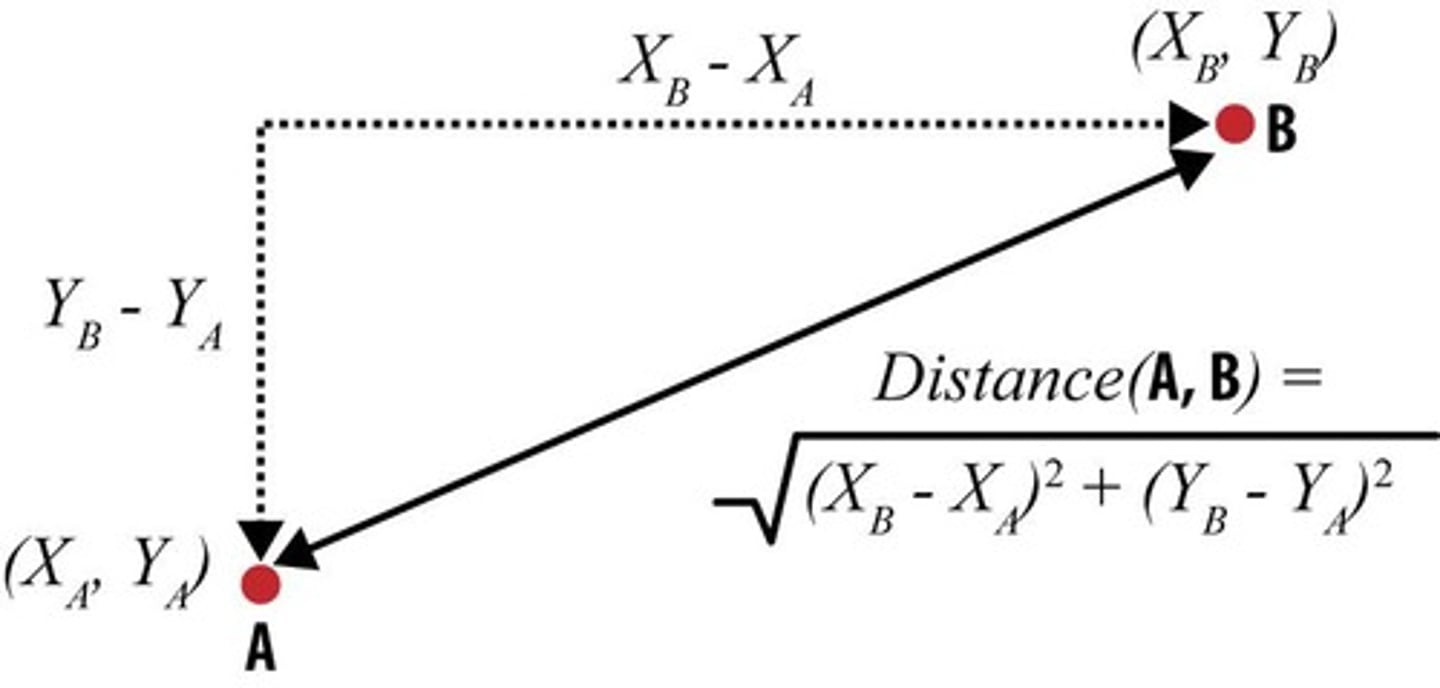
Distance Measure
Metric to quantify similarity between data points.
Euclidean Distance
Straight-line distance between two points in space.
Manhattan Distance
Distance measured along axes at right angles.
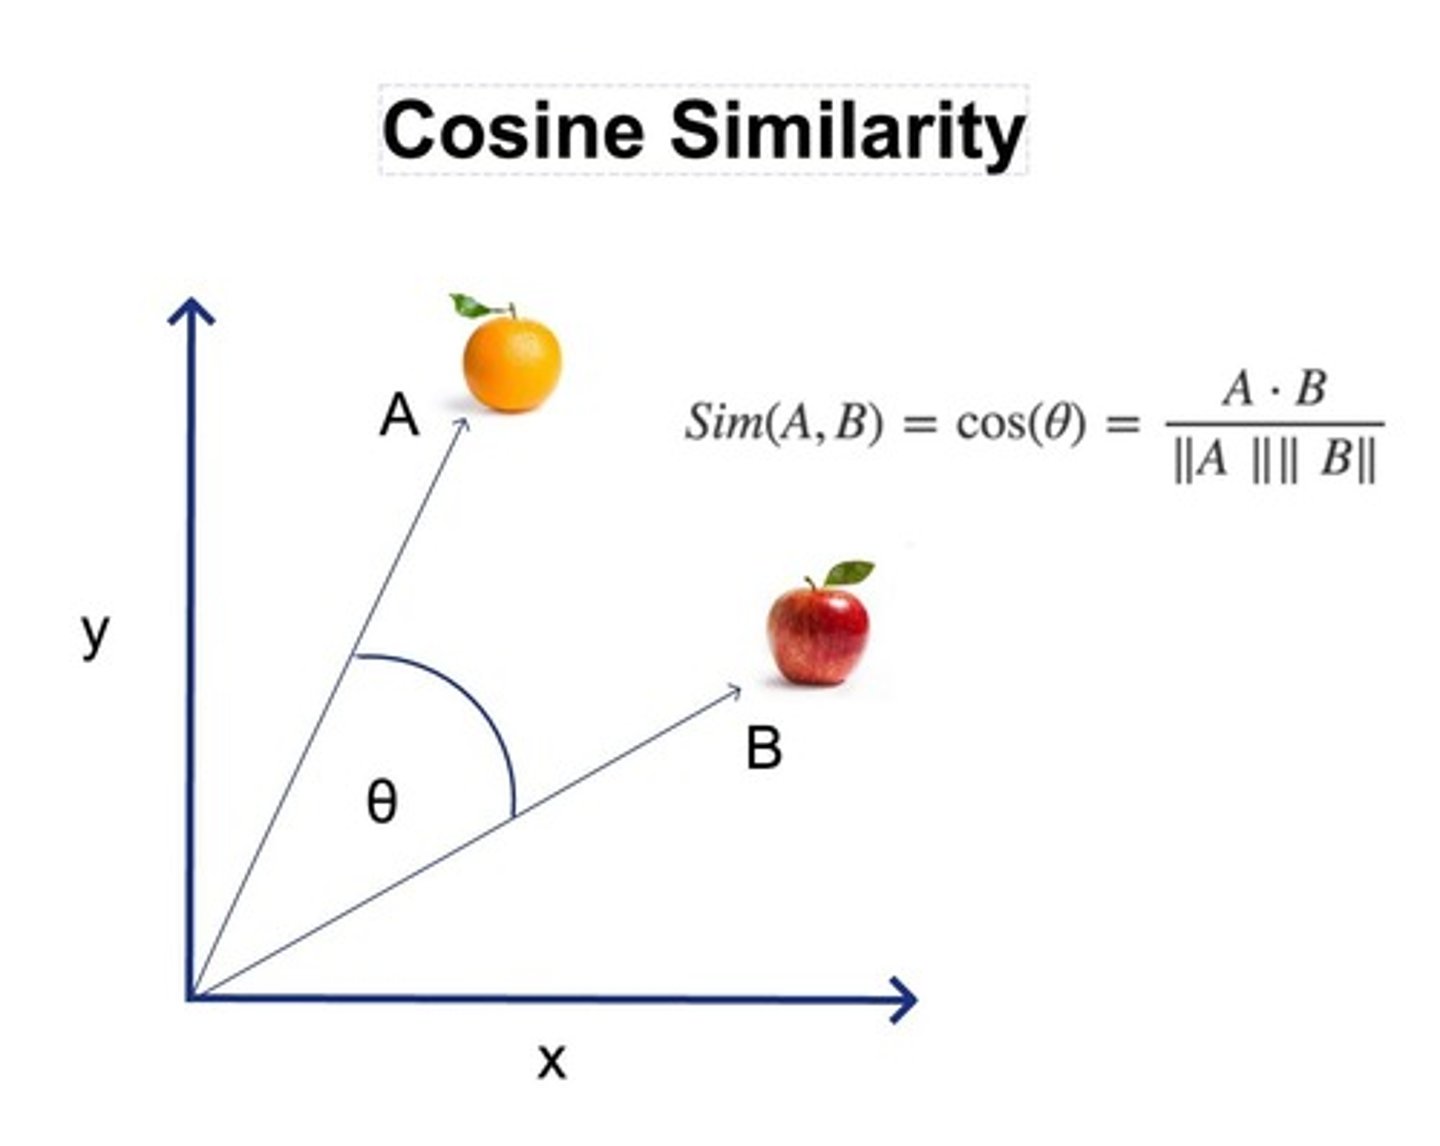
Cosine Similarity
Cosine of the angle between two vectors.
High-dimensional Space
Data represented by vectors of large size.
Subgroups Discovery
Identifying distinct groups within a dataset.
Data Visualization
Representing data to reveal patterns or insights.
Subjectivity in Analysis
Interpretation varies based on data context.
Gene Expression Measurements
Data used to group breast cancer patients.
Shoppers Characterization
Grouping shoppers by browsing and purchase history.
Movie Ratings Clustering
Grouping movies based on viewer ratings.
Clustering Problem Setup
Grouping points based on proximity in data.
Similarity Definition
Criteria for determining observation closeness.
Sky Objects Catalog
2 billion objects characterized by 7 radiation dimensions.
Cluster Members
Observations within a cluster are similar.
Dissimilar Clusters
Members of different clusters are not alike.
Domain-specific Consideration
Knowledge-based criteria for similarity assessment.
Broad Class of Methods
Various techniques for subgroup discovery in data.
Cosine Similarity
Ranges from -1 (opposite) to 1 (same)
Orthogonality
Indicates zero similarity between vectors
Cosine Distance
Calculated as 1 minus cosine similarity
Sparse Data
Data with many zero values, often binary
Jaccard Similarity
Measures similarity between finite sample sets
High Distance
Indicates low similarity between points
Low Distance
Indicates high similarity between points
Hierarchical Clustering
Clusters formed through agglomerative or divisive methods
Agglomerative Clustering
Combines nearest clusters into one cluster
Divisive Clustering
Starts with one cluster and splits recursively
K-means Clustering
Partitions data into K distinct, non-overlapping clusters
Centroid
Average of all data points in a cluster
Euclidean Distance
Assumed distance metric in K-means clustering
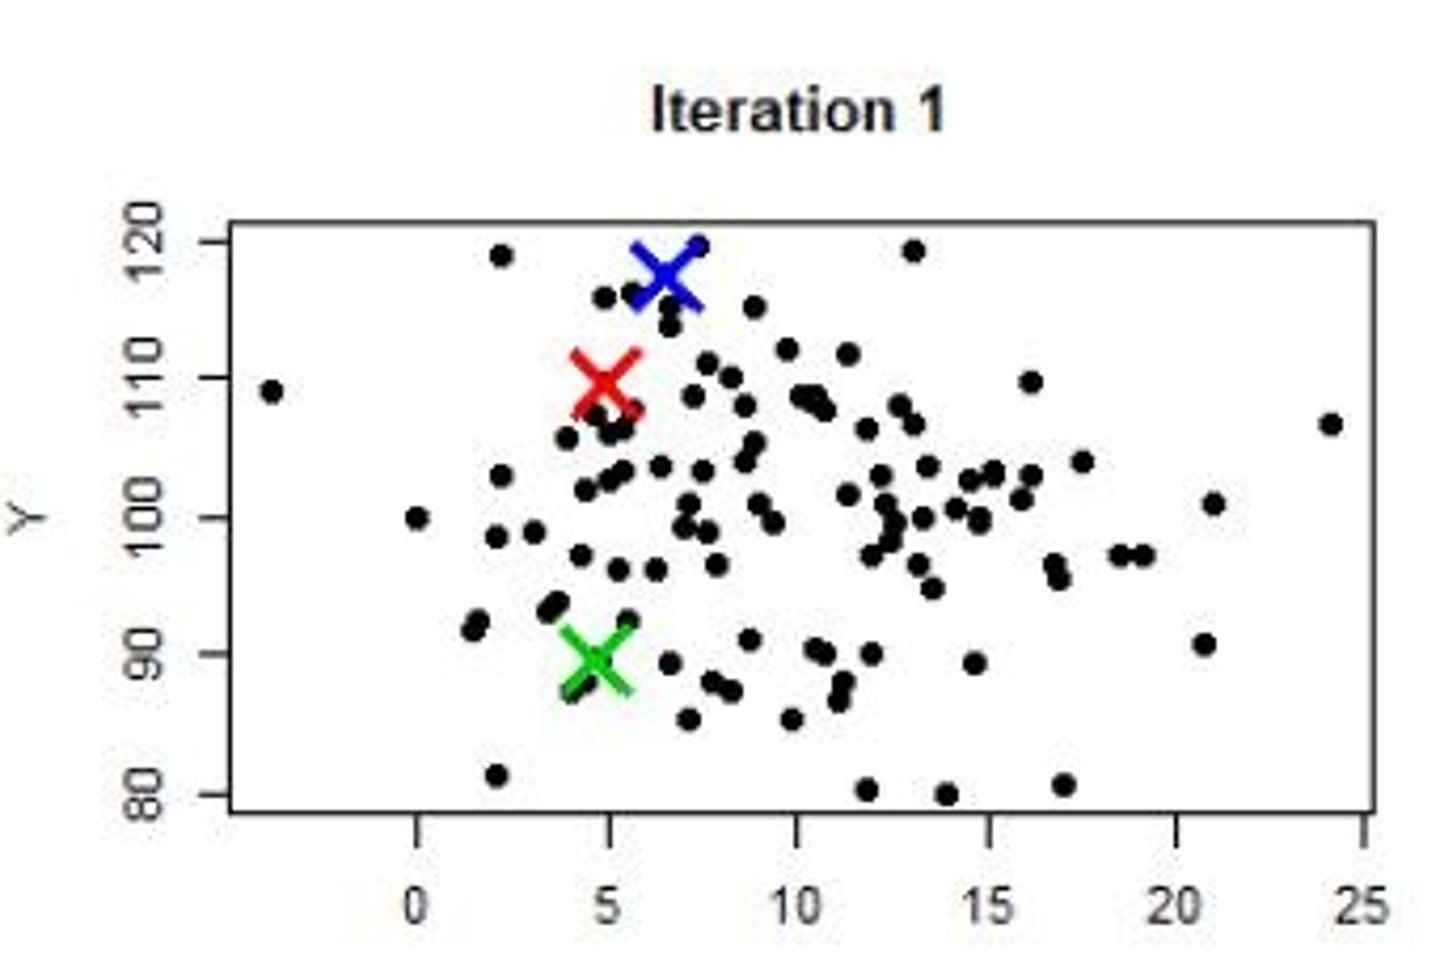
Initial Cluster Assignment
Randomly assign points to clusters or select centroids
Convergence in K-means
No points move between clusters, centroids stabilize
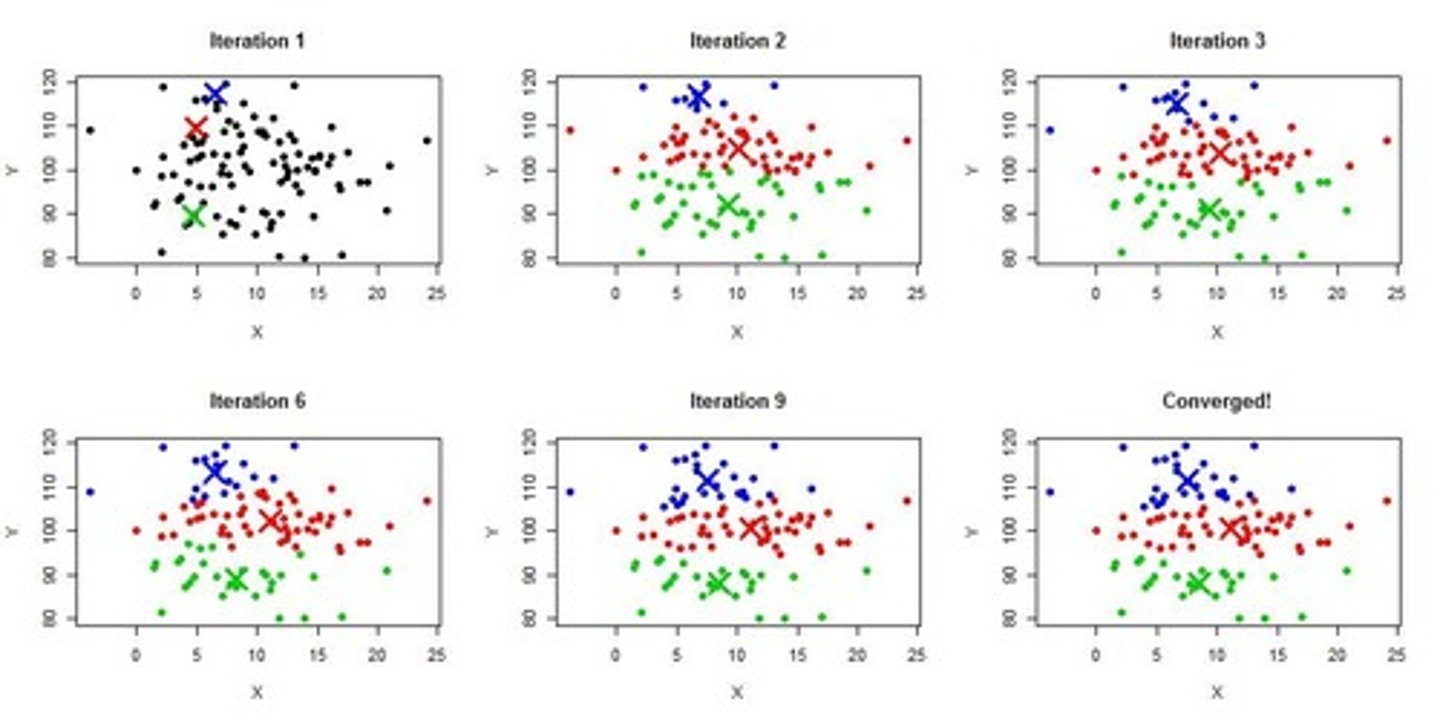
Cluster Assignment Process
Assign points to nearest centroid iteratively
Random Initialization Effect
Random selection can lead to different clustering results
Compact Clusters
Clusters with smallest distances within themselves
Selecting K
Determining the optimal number of clusters
Iterative Process
Reassign points and update centroids until stable
K-means Algorithm
Iteratively assigns points to clusters based on centroids
Distance Metric
Measures similarity or dissimilarity between data points
K-means clustering
Requires pre-specifying the number of clusters K.
Silhouette score
Measures cluster cohesion versus separation.
Silhouette range
Values range from -1 to +1.
High silhouette value
Indicates good cluster matching.
Hierarchical clustering
Does not require pre-defined number of clusters.
Agglomerative clustering
Bottom-up approach to cluster merging.
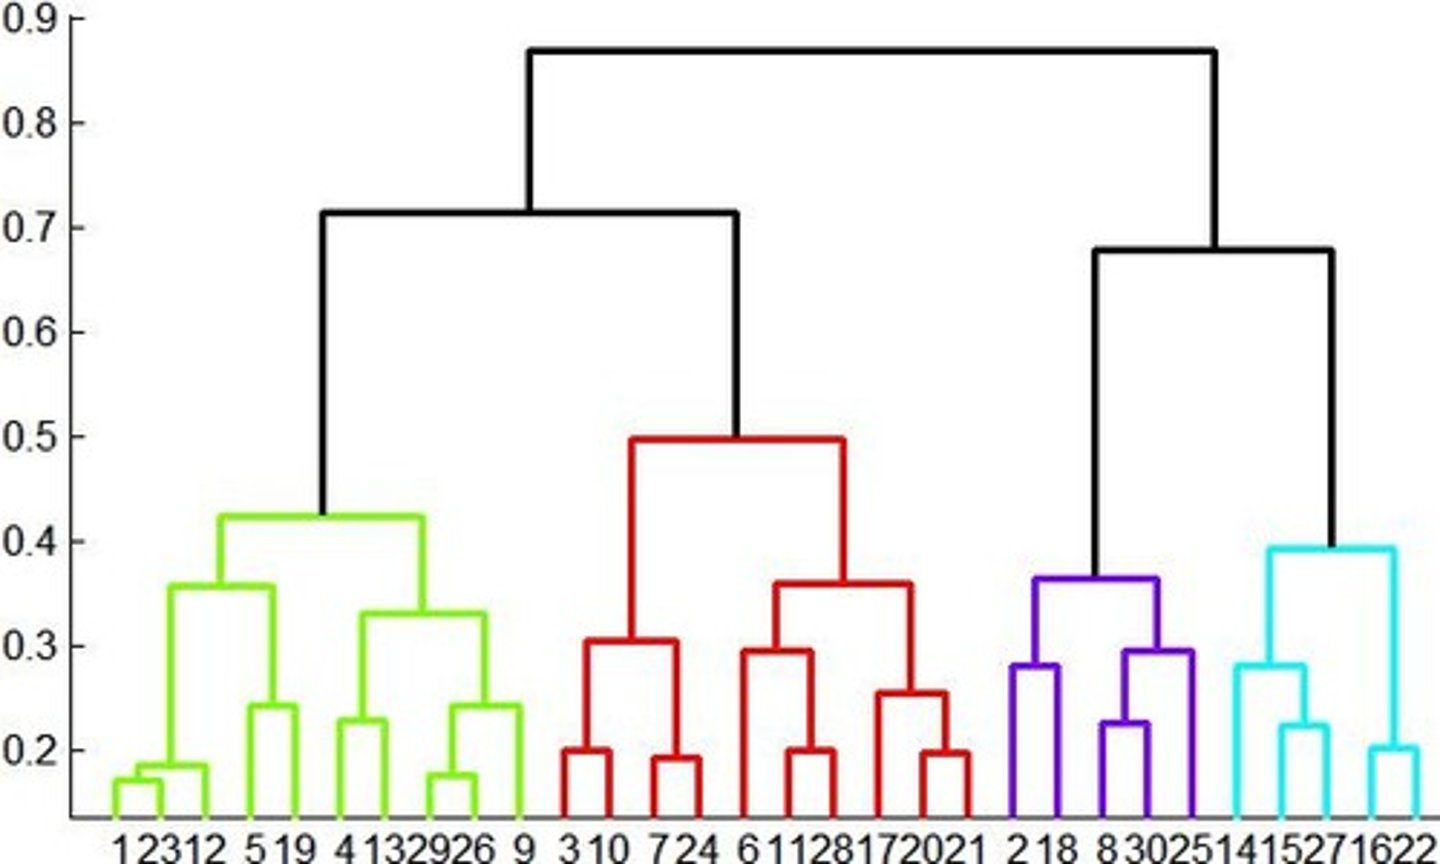
Dendrogram
Visual representation of hierarchical clustering.
Centroid
Average location of points in a cluster.
Cluster merging
Repeatedly combine nearest clusters until stopping criterion.
Euclidean distance
Distance measure for determining cluster nearness.
Key operation
Combine two nearest clusters iteratively.
Stopping criterion
Condition to end the clustering process.
Cluster representation
Location of clusters determined by centroids.
Distance measurement
Assessing cluster proximity using centroid distances.
Data point
Individual observation in a clustering dataset.
Centroid example
Average of data points in a cluster.
Fusion height
Indicates similarity of merged observations.
Bottom of dendrogram
Indicates high similarity between observations.
Top of dendrogram
Indicates low similarity between observations.
Preventing feature dominance
Solutions to avoid skewed clustering results.
Cluster analysis
Examining data points grouped into clusters.
Picking k
Choosing the optimal number of clusters.
Cohesion
Similarity of an object to its own cluster.
Feature Scaling
Rescaling features to a common range, e.g., [0,1].
Euclidean Distance
A common measure of similarity in clustering.
Manhattan Distance
Distance calculated as the sum of absolute differences.
Cosine Similarity
Measure of similarity based on angle between vectors.
Jaccard Index
Similarity measure for comparing sets of data.
Pearson Correlation
Statistical measure of linear correlation between variables.
Clustering
Grouping data points based on similarity.
Cluster Centroid
Average point representing a cluster's members.
Exploratory Analysis
Analyzing data to discover patterns without prior hypotheses.
Cluster Profiling
Describing and understanding characteristics of clusters.
Fresh Food Lovers
Cluster of customers favoring organic and fresh foods.
Distance Measure Choice
Selecting appropriate metric for clustering data analysis.
Data Preparation
Preprocessing data before applying clustering algorithms.
Customer Segmentation
Dividing customers into groups for targeted marketing.
Transaction History
Record of customer purchases used for clustering.
Dendrogram
Tree-like diagram representing data clustering hierarchy.
Unsupervised Learning
Learning patterns from data without labeled responses.
Customer Features
Attributes like age and income used for clustering.
Marketing Strategies
Tailored approaches based on customer segment characteristics.
Cluster Analysis
Technique to identify patterns in data without explanations.
Buying Behavior
Patterns in customer purchases used for segmentation.
Data Mining
Extracting useful information from large datasets.
Numerical Features
Quantitative attributes used for analysis and clustering.