U4 - Population Dynamics
1/101
There's no tags or description
Looks like no tags are added yet.
Name | Mastery | Learn | Test | Matching | Spaced |
|---|
No study sessions yet.
102 Terms
Population Dynamics
refers to the changes that occur in a population, and includes how and why these changes occur
Global Population Distribution - 2023
Asia - 59.18%
Europe - 9.29%
Oceania - 0.56%
Africa - 18.14%
North America - 4.68%
Latin America & The Caribbean - 8%
Global Population Growth
- Growth has been slow due to birth rates and death rate being high. E.g. Life expectancy in England in the 1300s was 24, only increased to 34 in early 1700s
- Following the industrial revolution in the UK and Western Europe (late 1700s onwards) low population growth, high birth and death rates changed
Life expectancy factors
- Improved farming techniques = more food
- Improved medicine
- Improved hygiene/clean drinking water
Growth Rates in High Income Countries Have slowed because
- Rising age for marriage
- Wider access to contraception
- Desire for smaller families (cost if living)
- Changing roles of women in society
Countries with the Highest Natural Population Growth
- Sub-Saharan Africa
- Lesser degree in the Middle East
- Central Asia
Countries with the Lowest Natural Population Growth
- Common in Europe
- North-east Asia
- Australia
- North America
Population Growth - Australia
- Naturally growing at 0.5%, could take 120 years to double (without migration)
- More than 20 countries are currently experiencing population decline. E.g. Russia expected to decline by 13 million up to 2050
Population Structures
are used to illustrate the characteristics of a population, in particular age and gender
Population Structures - Low-Income Countries
- Wide base = high birth rate
- High death rate
- High young dependent population, low levels of aged dependency
- Stage 2 of the Demographic Transition Model
Population Structures - Newly Emerging Economy
- Lower dependency ratio (increase economic growth)
- Stage 3 of the Demographic Transition Model
- Buldge in the middle of high growth
Demographic Transition Model - Stage 1
High stationary
Birth rate - High
Death rate - High
Natural increase - Slow
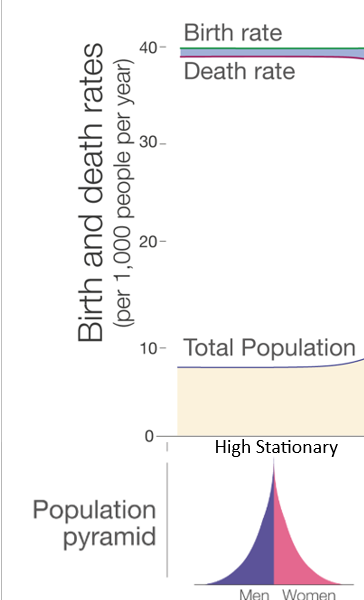
Demographic Transition Model - Stage 1 Examples
-Remote tribes in Papua New Guinea, Amazon, Iran
Demographic Transition Model - Stage 1 Reasons for Changes in Birth Rates
- No contraception
- Large families are preferred
- Traditional roles for women
Demographic Transition Model - Stage 1 Reasons for Changes in Death Rates
- Regular disasters
- Diseases are common
- Water and sanitation are limited
Demographic Transition Model - Stage 2
Early expanding
Birth rates - high
Death rates - Falling
Natural Increase - Increasing
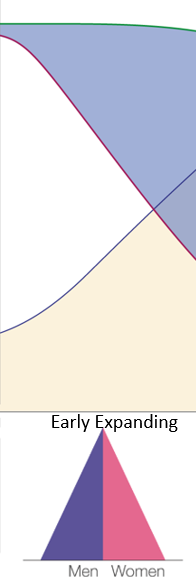
Demographic Transition Model - Stage 2 Examples
Low income countries:
- Chad
- Niger
Demographic Transition Model - Stage 2 Reasons for Changes in Birth Rates
- Little contraception access
- Traditional roles for women
Demographic Transition Model - Stage 2 Reasons for Changes in Death Rates
- Developments in water and sanitation
- Basic medical standards
- More reliable food supply
Demographic Transition Model - Stage 3
Late expanding
Birth rate - Falling
Death rate - Declining
Natural increase - Increasing
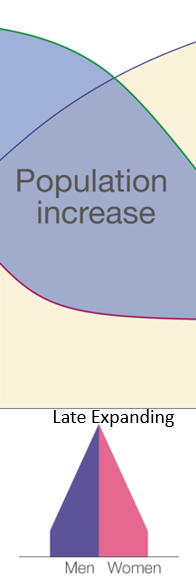
Demographic Transition Model - Stage 3 Examples
Newly Emerging Economies
- Brazil
- Mexico
Demographic Transition Model - Stage 3 Reasons for Changes in Birth Rates
- Knowledge and access to contraception
- Role of women changing
- Infant mortality improves
Demographic Transition Model - Stage 3 Reasons for Changes in Death Rates
- Developments in water and sanitation
- More reliable food supply
- Basic medical standards
Demographic Transition Model - Stage 4
Low stationary
Birth rate - low
Death rate - low
Natural increase - steady

Demographic Transition Model - Stage 4 Examples
High Income Countries
- UK
- USA
- Australia
Demographic Transition Model - Stage 4 Reasons for Change in Birth Rate
- Children are an economic liability
- Women marry and have children later due to work
- Contraception is available and understood
Demographic Transition Model - Stage 4 Reasons for Change in Death Rate
- Standards of medical care are high
- Clean water and sanitation
- Plentiful food supply
Demographic Transition Model - Stage 5
Declining
Birth rate - low
Death rate - increasing
Natural Increase - slowly declining

Demographic Transition Model - Stage 5 Examples
Ageing population
- Japan
Demographic Transition Model - Stage 5 Reasons for Change in Birth Rate
- Cost of children
- Women marry and have children later due to work
- Contraception is available and understood
Demographic Transition Model - Stage 5 Reasons for Change in Death Rate
- Standards of medical care
- Clean water and sanitation
- Plentiful food supply
Crude Birth Rate
refers to the number of live births (during the year) per 1000 of population
Crude Birth Rate - Context
- Strong correlation between Crude birth rate and economic development
Crude Birth Rate - Influencing Factors
Low Income Countries
- Limited access and knowledge of contraception
- Traditional roles of girls and women to leave school early and marry young. Median age for marriage in Niger us 15.7 years
- Social success linked to larger families
High Income Countries
- Children are an economic liability, cost of raising children is high. Australian Government estimates $430,000 to raise a child to 18
- Knowledge and access to contraception
- Roles of women have changed, more work focused and married later. Australia’s average marriage age is 29
Crude Birth Rate - Statistics 2024
Highest
Niger - 46.6
Lowest
South Korea - 5.62
Australia - 12.5
Total Fertility Rate
refers to the average number of births per woman of child bearing age (15-49)
Total Fertility Rate - Context
- Total fertility rate has rapidly decreased in recent decades
Global average
In 1970 - 4.7 children per women
In 2024 - 2.4 children per women
Total Fertility Rate - Influencing Factors
- Declining infant mortality. In 1980 in Niger - 32.3% infant mortality per 100 live births, in 2023 - 11.5% per 100 live births
- Increase access to contraception and anti-natal policies such as the one child policy in China (1979-2016)
- Changing women’s roles and status
Total Fertility Rate - Statistics 2024
Highest - births per women
Chad - 6.03
Lowest
South Korea - 0.73
Australia - 1.64
Niger - 6
Crude Death Rate
Calculated as the number of deaths per 1000 people in a year in a population
Crude Death Rate - Context
- Uneven globally
- Higher in poor nations, lower in Middle East and Central America
Crude Death Rate - Influencing Factors
- “Green revolution” referring to the increase in global food supplies and improved food security. Niger’s daily supply of calories per person in 1961 was 1580 kcal, compared to 2022 at 2724 kcal
- Ageing population
- Effective disease control
Crude Death Rate - Statistics 2024
Highest
Central Africa - 20 per 1000 people
Lowest
UAE - 0.97 per 1000 people
Australia - 6.9 per 1000 people
Niger - 8.86 per 1000 people
Natural Increase/Decrease
Calculated by subtracting death rates from birth rates in a given period
Natural Increase/Decrease - Context
- Provides a clear indication of whether a population is growing/remaining stable or declining over a period usually 1 year
- Migration is excluded
- Europe and Russia are generally decreasing while Africa is increasing
Natural Increase/Decrease - Influencing Factors
- Medical advance. Healthcare access and quality out of 100. In Niger in 2000 - 15, in 2021 - 35. The world in 2000 - 45, in 2021 - 68
- Aging population
- Birth/death rates
Natural Increase/Decrease - Statistics 2024
Highest
Niger, Congo, Uganda - 3.3%
Lowest
Latvia - 0.65
Australia - 0.4%
Infant Mortality
the average number of deaths of persons less than 1 per 1000 live births
Child Mortality
the average number of deaths of children under the age of 5 per 1000 live births
Infant/Child Mortality - Context
- Strong association with economic development
- In Europe and East Asia infant/child mortality is low compared to Sub-Saharan Africa and Central Southern Asia but crude death rates are increasing due to aging population
Infant/Child Mortality - Influencing Factors
- Access to healthcare. In Niger in 1990 1476.2/100000 people died of pneumonia and respiratory diseases, in 2021 - 217.2/100000
- Education about prenatal healthcare
- Economic development
Infant/Child Mortality - Statistics 2024
Highest
South Sudan - 7.3% per 100 live births
Lowest
Singapore, Estonia, Finland - 0.2% per 100 live births
Australia - 0.3% per 100 live births
Niger - 6.7% per 100 live births
Maternal Mortality
refers to the death of women due to childbirth related conditions
Maternal Mortality - Context
- Improved on a global scale due to development
- Increase births in hospitals with medical experts limiting deaths
- Globally 216 deaths occur per 100,000 live births
Maternal Mortality - Influencing Factors
- Medical developments. Between 2000 and 2023 maternal mortality rates dropped 40% globally
- Access to technology and hospitals
- Socioeconomic status
Maternal Mortality - Statistics 2023
Highest
Nigeria - 993 per 100,000 live births
Lowest
Belarus, Norway - 1 per 100,000 live births
Australia - 2 per 100,000 live births
Niger - 350 per 100,000 live births
Life Expectancy
the average number of years a person can be expected to live from birth
Life Expectancy - Context
- Increasing rapidly contributing to population growth since 1950
- UN projected around 2100, most countries will improve their average life expectancy to over 80 years
Life Expectancy - Influencing Factors
- Aging population
- Decrease in death rates
- Access to safe drinking water. In 2000 in Nigeria, 12.6% of population had safe drinking water, in 2022 29% of the population
Life Expectancy - Statistics 2024
Highest
Japan - 84.8 years
Lowest
Chad - 53.68 years
Australia - 84.1 years
Niger - 61.4 years
Ageing Population
one in which the proportion of the population aged 65 and over is increasing
Ageing Population - Statistics
WHO projects that by 2050 the population ages 65+ will double. By 2042 people aged 85 years or over could make up 3% of Australia’s population, compared to only 2% in 2017.
Ageing Society
generally expressed in terms of the percentage of people over 65 years of age in a given population due to increased life expectancy and declining birth rates
Ageing Society - Implications
Strain on:
- aged care
- increase pension costs
- higher dependency ratio
- lower workers for the economy
Ageing Society - Mitigation
- How can we get more people to have children
Ageing Society - Adaption
- Increase retirement age
- Shift in policy, e.g. pensions
- migration
Ageing Society - Statistics
- In 2016 16% on Australia’s population was aged 65 years or older this has doubled since 1970 when the rate was 8%
Dependency Ratio
refers to the number of people working (15-64 years) compared to the number of young (0-14 years) and older (65+) who are not working and need to be supported
Population Movement - International Migrant
as any person who lives temporarily or permanently, in a country where he or she was not born, and has acquired some significant social ties to this country
Population Movement - International Migrant - Statistics 2024
- 303 million migrants - 3.7% of the population
- USA has 52.4 million migrants
- 439 thousand emigrants in 2024 from Niger
- 431 thousand emigrants from Australia
Population Movement - International Migrant - Low Agency
Migration as a result of factors beyond a persons control (Niger)
Population Movement - International Migrant - High Agency
Migration as a result of personal decisions
Types of Population Movements - International
Movement across international boundaries
Types of Population Movements - Internal
From one part of a country to another
Types of Population Movements - Intra-urban
From one part of a city to another
Types of Population Movements - Temporary (Time Related)
Semi-permanent migration. Plan to return home after a period of time
Types of Population Movements - Permanent or Indefinite (Time Related)
Long lasting change of residence
Types of Population Movements - Seasonal (Time Related)
Periodic movement linked to a seasonal activity
Types of Population Movements - Recurrent (Time Related)
Migration that occurs more than once, but isn’t dependent on seasons
Causes of Migration - Environmental
Natural features or processes lead to migration. E.g. Drought
Causes of Migration - Social
Elements relating to people community. E.g. Moving to join a partner or family member
Causes of Migration - Economic
Money, employment and cost of living all contribute to migration. E.g. Rural to urban migration
Causes of Migration - Political
Government laws/policies influence movement of people. E.g. Australia’s open democracy attracts overseas migrants
Rural to Urban Migration
The movement of people from countryside to an urban settlement such as a town or city
Rural to Urban Migration - Scale of Urban Migration
- Significant and rapidly increasing
- In 1900, 15% of the world’s population lived in cities
- By 1950s, 30%
- By 2010, more than 50%.
- In 2020, 56% of people lived in cities
Rural to Urban Migration - Impact at the Source
- Declining population
- Shift in demographic structure
- Economic disadvantage wit less working class
Rural to Urban Migration - Impact at the Destination
- Informal settlement - poor quality and services
- Overcrowding
- Crime
- High risk of fires and inadequate sanitation
- More demand for jobs
Rural to Urban Migration - Niger Example
- Niamey capital of Niger has a population of over 1.3 million. People looking for work, or fleeing from the famine caused by drought have internally migrated to the capital.
- The International Organisation for Migration (IOM) has experienced an increase of 35% in 2022 of migrants seeking assistance due to the dire need for food, clean water, shelter and medical attention on the outskirts of the city.
- By 2050 the IMO predicted there will be more than 5 million internal migrants in Niger
Impact of Migration - Remittances
relates to money that is sent home by migrant workers. E.g. In 2021 migrant workers sent home US$781 billion
Impact of Migration - Positive
- At origin point, remittances benefit local economy. E.g. 27% of Nepal’s GDP is made up of remittances
- At destination, migrants provide a workforce. E.g. 90% of non-government workers in the UAE are migrants
Impact of Migration - Negative
- Large numbers of migrants can contribute to issues such as unemployment, access to housing and places in schools
- Loss of skilled workers in the origin country. E.g. 30% of international students stay in Australia
Impact of Migration - Destination (UAE) - Positive
- Immigrants from India, Pakistan and Bangladesh makes up 90% of the workforce in private employment
- Influx of migrant workers has allowed the UAE to diversify its labour market by bringing in expertise and skills with approx. 50% of Gulf countries population being migrant workers
Impact of Migration - Destination (UAE) - Negative
- Treatment and working conditions can be harsh. Labour exploitation and poor living conditions have been reported. 41% of migrant workers have experienced discrimination
- Migration has created a strain on the UAE’s education and healthcare systems as the population has grown rapidly.
Impact of Migration - Destination (UAE) - Population Structure
- Migrants make up 88% of population in 2019
- Gender imbalance towards men
- Low dependency ratio
Impact of Migration - Source (India, Bangladesh) - Positive
- Many migrant workers send home remittances contributing to the economy in the local country
- Less unemployment as there is less competition for jobs
Impact of Migration - Source (India, Bangladesh) - Negative
- Fluctuating oil prices play a role in job security for migrants in the gulf states
- Gender imbalance as it is often males who move
Malthusian Theory
In 1798 Thomas Malthus, wrote “Essay on the Principle of Population” during the industrial revolution, Malthus hypothesised that while the population grew exponentially, food production would only increase arithmetically over a period of time.
Malthusian Theory - Context
- Population growth would outstrip resources
- These events or Malthusian checks would reduce population to a more sustainable level
Malthusian Theory - Limitations
- Population increased - however food production increased too (some not sustainable)
- Fertility rates have dropped far below Malthus imagined
- Underestimated the role of migration and advancements in technology
Malthusian Theory - Neo-Malthusians
- Malthus’ theories still apply because famine occurs regularly
- Environmental issues and resource depletions are consequences of population growth
- Anti-natal policies such as China’s one child policy which has been produced from famine in 1959 to 1961, initiating the policy in 1979 to protect living standards
Malthusian Theory - Nigerien Famine - Modern Day Malthusian Check
- 2005 to 2006
Demographic Causes - Niger’s population increased over five folds from 1950 to 13.5 million in 2005. The Fertility rate was the highest in the world at 7.6 children per woman
Niger Food Crisis - Severe food insecurity in Northern Niger with rainfall stopping in early 2004 damaging pasture land heightening food prices and chronic poverty
Impact - In the affected areas, 2.4 million out of 3.6 million people were highly vulnerable to food insecurity with over 800,000 people facing extreme insecurity