APES Unit 3 Test
5.0(1)
Studied by 16 people0%Unit Mastery
0%Exam Mastery
Build your Mastery score
Supplemental Materials
Card Sorting
1/49
Earn XP
Description and Tags
Last updated 3:38 AM on 2/9/23
Name | Mastery | Learn | Test | Matching | Spaced | Call with Kai |
|---|
No analytics yet
Send a link to your students to track their progress
50 Terms
1
New cards
Specialists
Smaller range of tolerance, or narrower ecological niche makes them more prone to extinction
* Specific food requirements (bamboo)
* Less ability to adapt to new conditions
* Specific food requirements (bamboo)
* Less ability to adapt to new conditions
2
New cards
Generalists
Larger range of tolerance, broader niche makes them less prone to extinction & more likely to be invasive
* Broad food requriements
* High adaptability
* Broad food requriements
* High adaptability
3
New cards
K-selected species
* Few offspring, heavy parental care to protect them
* Generally have fewer reproductive events than r-strategists
* **Ex: most mammals, birds**
* Long lifespan, long time to sexual maturity = low biotic potential = slow pop. growth rate
* More likely to be disrupted by env. change or invasives
* Generally have fewer reproductive events than r-strategists
* **Ex: most mammals, birds**
* Long lifespan, long time to sexual maturity = low biotic potential = slow pop. growth rate
* More likely to be disrupted by env. change or invasives
4
New cards
R-selected species
* Many offspring, little to no care
* May reproduce only once, but generally reproduce many times throughout lifespan
* **Ex: insects, fish, plants**
* Shorter lifespan, quick to sexual maturity = high biotic potential = high pop. growth rate
* More likely to be invasive
* Better suited for rapidly changing env. conditions
* May reproduce only once, but generally reproduce many times throughout lifespan
* **Ex: insects, fish, plants**
* Shorter lifespan, quick to sexual maturity = high biotic potential = high pop. growth rate
* More likely to be invasive
* Better suited for rapidly changing env. conditions
5
New cards
Survivorship Curve
Line that shows survival rate of a cohort (group of same-aged individuals) in a pop. from birth to death
* Faster drop in line = quicker die-off of individuals
* Slower drop in line = longer avg. lifespan
* Faster drop in line = quicker die-off of individuals
* Slower drop in line = longer avg. lifespan
6
New cards
Type I Survivorship Curve
* Mostly K-selected
* High survivorship early in life due to high parental care
* High survivorship in mid life due to large size & defensive behavior
* Rapid decrease in survivorship in late life as old age sets in
* Ex: most mammals
* High survivorship early in life due to high parental care
* High survivorship in mid life due to large size & defensive behavior
* Rapid decrease in survivorship in late life as old age sets in
* Ex: most mammals
7
New cards
Type II
* In between r and K
* Steadily decreasing survivorship throughout life
* Steadily decreasing survivorship throughout life
8
New cards
Type III
* Mostly r-selected
* High mortality (low survivorship) early in life due to little to no parental care
* Few make it to midlife; slow, steady decline in survivorship in mid life
* Even fewer make it to adulthood; slow decline in survivorship in old age
* Ex: insects, fish, plants
* High mortality (low survivorship) early in life due to little to no parental care
* Few make it to midlife; slow, steady decline in survivorship in mid life
* Even fewer make it to adulthood; slow decline in survivorship in old age
* Ex: insects, fish, plants
9
New cards
Carrying Capacity (k)
* Highest pop. size an ecosystem can support based on limiting resources:
* Food
* Water
* Habitat (nesting sites, space)
* Overshoot: when a population briefly exceeds carrying capacity
* Ex: deer breed in fall, give birth all at once in spring; sudden spike in population = overshoot
* Consequence of overshoot: resource depletion ex: overgrazing in deer
* Die-off: sharp decrease in pop. size when resource depletion (overshoot) leads to many individuals dying
* Ex: many deer starve with too many new fawns feeding in spring
10
New cards
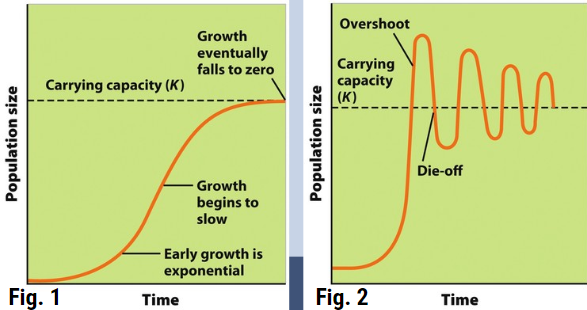
Which diagram of carrying capacity is theoretical? Which is more realistic?
Figure 1 is theoretical, and Figure 2 is more realistic
11
New cards
Describe relative population changes in a predator-prey relationship.
__Population fluctuation cycle__
1. Prey population increases due to low predator population
2. Predator population increases due to higher prey population
3. Prey population decreases due to higher predator population
4. Predator population decreases from prey die-off
1. Prey population increases due to low predator population
2. Predator population increases due to higher prey population
3. Prey population decreases due to higher predator population
4. Predator population decreases from prey die-off
12
New cards
Population size
Total number of individuals in a given area at a given time
* Larger = safer from population decline
* Larger = safer from population decline
13
New cards
Population density
Number of individuals per unit area
* High density = higher competition, possibility for disease outbreak, possibility of depleting food source
* High density = higher competition, possibility for disease outbreak, possibility of depleting food source
14
New cards
Population distribution
How individuals in pop. are spaced out compared to each other
* Random (trees)
* Uniform (territorial animals)
* Clumped (herd/group animals)
* Random (trees)
* Uniform (territorial animals)
* Clumped (herd/group animals)
15
New cards
Sex Ratio
Ratio of males to females
* Closer to 50:50, the more ideal for breeding (usually)
* Die-off or bottleneck effect can lead to skewed sex ratio (not enough females) limiting pop. growth
* Closer to 50:50, the more ideal for breeding (usually)
* Die-off or bottleneck effect can lead to skewed sex ratio (not enough females) limiting pop. growth
16
New cards
Density-Dependent Factors
Factors that influence pop. growth based on size
* Ex: food, competition for habitat, water, light, even disease
* All of these things limit pop. growth based on their size; aka - small pop. don’t experience these, large do
* Ex: food, competition for habitat, water, light, even disease
* All of these things limit pop. growth based on their size; aka - small pop. don’t experience these, large do
17
New cards
Density-Independent Factors
Factors that influence pop. growth independent of their size
* Ex: natural disasters (flood, hurricane, tornado, fire)
* It doesn’t matter how big or small a pop. is, natural disasters limit them both
* Ex: natural disasters (flood, hurricane, tornado, fire)
* It doesn’t matter how big or small a pop. is, natural disasters limit them both
18
New cards
Biotic potential
Max. potential growth rate, with no limiting resources
* May occur initially, but limiting resources (competition, food, disease, predators) slow growth, & eventually limit pop. to logistic growth, or carrying capacity (k)
* Exponential growth
* May occur initially, but limiting resources (competition, food, disease, predators) slow growth, & eventually limit pop. to logistic growth, or carrying capacity (k)
* Exponential growth
19
New cards
Calculating population change
(Immigrations + Births) - (Emigrations + Deaths)

20
New cards
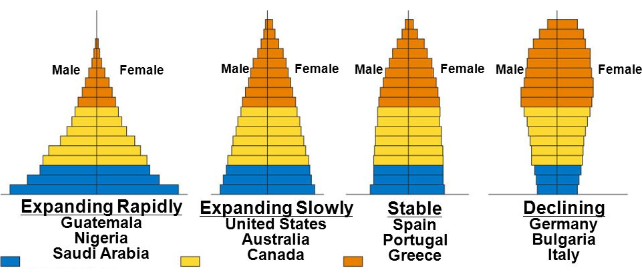
Age Cohorts
Groups of similarly aged individuals
* 0-14 = prereproductive; 15 - 44 = reproductive age; 45 + = post reproductive
* Size difference between 0-14 & 15-44 indicates growth rate
* Larger 0-14 cohort = current & future growth
* Roughly equal 0-14 & 15-44 = slight growth/stable
* Larger 15-44 = pop. decline
* 0-14 = prereproductive; 15 - 44 = reproductive age; 45 + = post reproductive
* Size difference between 0-14 & 15-44 indicates growth rate
* Larger 0-14 cohort = current & future growth
* Roughly equal 0-14 & 15-44 = slight growth/stable
* Larger 15-44 = pop. decline
21
New cards
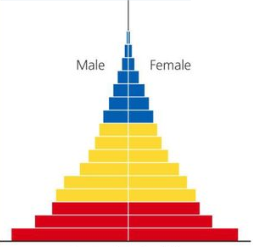
Population growth of an extreme pyramid (age structure diagram)?
Rapid growth
22
New cards

Population growth of a moderate pyramid (age structure diagram)?
Slow, stable growth
23
New cards

Population growth of a house-shaped age structure diagram?
Stable, little to no growth
24
New cards
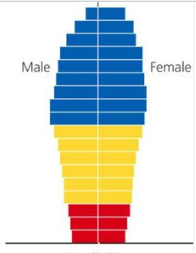
Population growth of an age structure digram that’s narrowest at its base?
Declining population
25
New cards
Total Fertility Rate (TFR)
Average number of children a woman in a population will bear throughout her lifetime
* Higher TFR = higher birth rate, higher pop. growth rate (generally)
* Higher TFR = higher birth rate, higher pop. growth rate (generally)
26
New cards
Replacement Level Fertility
The TFR required to offset deaths in a pop. and keep pop. size stable
* About 2.1 in developed countries (replace mom & dad)
* Higher in less developed countries due to higher infant mortality
* About 2.1 in developed countries (replace mom & dad)
* Higher in less developed countries due to higher infant mortality
27
New cards
Infant Mortality Rate (IMR)
Number of deaths of children under 1 year per 1,000 people in a population
* Higher in less developed countries due to lack of access to: health care, clean water, enough food
* Higher IMR = higher TFR, due to families having replacement children
* Higher in less developed countries due to lack of access to: health care, clean water, enough food
* Higher IMR = higher TFR, due to families having replacement children
28
New cards
Factors in IMR Decline
* Access to clean water
* Access to healthcare (hospitals, vaccines, vitamins & supplements for moms & babies)
* More reliable food supply
* Access to healthcare (hospitals, vaccines, vitamins & supplements for moms & babies)
* More reliable food supply
29
New cards
Factors that affect TFR
* Development (Affluence): more developed, or wealthy nations have a lower TFR than less developed nations
* More educational access for women
* More econ. opportunity for women
* Higher access to family planning education & contraceptives
* Later age of first pregnancy
* Less need for children to provide income through agricultural labor
* Gov. Policy: can play a huge role in fertility by coercive (forceful) or noncoercive (encouraging) policies
* Forced or vol. sterilization
* China’s 1 (now 2) child policy
* Tax incentives to have fewer children
* Microcredits or loans to women without children to start businesses
30
New cards
Affluence and TFR
* More access to contraceptives & family planning
* Ed./econ. opportunities require time, leaving less for raising children
* Lower IMR = lower TFR
* Ed./econ. opportunities require time, leaving less for raising children
* Lower IMR = lower TFR
31
New cards
Female Education and TFR
* More education = fewer unplanned pregnancies
* More education = more job. opportunities for women
* Alternative to marrying young
* More education = more job. opportunities for women
* Alternative to marrying young
32
New cards
Malthusian theory
* Earth has a human carrying capacity, probably based on food production
* Human population growth is happening faster than growth of food production
* Humans will reach a carrying capacity limited by food
* Human population growth is happening faster than growth of food production
* Humans will reach a carrying capacity limited by food
33
New cards
Technological Advancement
* Humans can alter earth’s carrying capacity with tech. Innovation
* Ex: synthetic fixation of Nitrogen in 1918 leads to synthetic fertilizer, dramatically increasing food supply
* Ex: synthetic fixation of Nitrogen in 1918 leads to synthetic fertilizer, dramatically increasing food supply
34
New cards
Growth Rate (r)
% increase in a population (usually per year)
35
New cards
Crude Birth Rate & Crude Death Rate (CBR & CDR)
Births & deaths per 1,000 people in a population
36
New cards
Calculating Growth Rate
(CBR - CDR)/10; should always be expressed as a percentage
37
New cards
Rule of 70
The time it takes (in years) for a population to double is equal to 70 divided by the growth rate
38
New cards
Factors that increase human population growth
* Higher TFR → higher birth rate
* High infant mortality rate can drive up TFR (replacement children)
* High immigration level
* Increased access to clean water & healthcare (decrease death rate)
* High infant mortality rate can drive up TFR (replacement children)
* High immigration level
* Increased access to clean water & healthcare (decrease death rate)
39
New cards
Factors that decrease human population growth
* High death rate
* High infant mortality rate
* Increased development (education & affluence)
* Increased education for women
* Delayed age of first child
* Postponement of marriage age
* High infant mortality rate
* Increased development (education & affluence)
* Increased education for women
* Delayed age of first child
* Postponement of marriage age
40
New cards
Standard of Living
What the quality of life is like for people of a country
41
New cards
Gross Domestic Product (GDP)
Key economic indicator of standard of living
* Total value of the goods & services produced
* Per capita GDP is total GDP/total population
* Total value of the goods & services produced
* Per capita GDP is total GDP/total population
42
New cards
Life expectancy
Key health indicator of standard of living
* Average age a person will live to in a given country
* Increases with access to clean water, health care, stable food sources
* Average age a person will live to in a given country
* Increases with access to clean water, health care, stable food sources
43
New cards
Industrialization
The process of economic and social transition from an agrarian (farming) economy to an industrial one (manufacturing based)
44
New cards
Pre-industrialized/Less developed
* A country that has not yet made the agrarian to industrial transition
* Typically very poor (low GDP)
* Typically high death rate & high infant mortality
* High TFR for replacement children & agricultural labor
* Typically very poor (low GDP)
* Typically high death rate & high infant mortality
* High TFR for replacement children & agricultural labor
45
New cards
Industrializing/developing
* part way through this transition
* Decreasing death rate & IMR
* Rising GDP
* Decreasing death rate & IMR
* Rising GDP
46
New cards
Industrialized/developed
* completed the transition
* Very low DR & IMR
* Very High GDP
* Low TFR
* Very low DR & IMR
* Very High GDP
* Low TFR
47
New cards
Stage 1 - Preindustrial
* High IMR & high death rate due to lack of access to clean water, stable food supply, and healthcare
* High TFR due to lack of access to:
* Ed. for women
* Contraceptives/family planning
* Need for child agricultural labor
* Little to no growth due to high CBR & CDR balancing each other out
* High TFR due to lack of access to:
* Ed. for women
* Contraceptives/family planning
* Need for child agricultural labor
* Little to no growth due to high CBR & CDR balancing each other out
48
New cards
Stage 2 - Industrializing/Developing
* Modernizations brings access to clean water, healthcare, stable food supply
* IMR & CDR decline
* TFR remains high due to
* Lack of ed. for women & contraceptives/family planning
* Need for child agricultural labor
* Generational lag ( takes time for ed. & societal change to spread
* Rapid growth, due to high CBR and declining CDR
* Econ./societal Indicators
* Low per capita GDP
* Shorter life-expectancy
* High infant mortality
* High TFR
* Low literacy rate & school life expectancy for girls
49
New cards
Stage 3 - Developed/Industrialized
* Modernized economy and society increase family income, so TFR declines significantly due to
* More ed. opportunities for women
* Delayed age of marriage & first child to focus on ed./career
* Access to family planning & contraceptives
* Slowing growth rate as CBR drops closer to CDR
* Econ./societal Indicators
* High per capita GDP
* Long life-expectancy
* Low infant mortality
* TFR, near replacement level (2.1)
* High literacy rate & school life expectancy for all
50
New cards
Stage 4 - Post-Industrialized/Highly Developed
* Highly modernized countries that are very affluent
* TFR declines even further as families become more wealthy and spend even more time on educational & career pursuits
* Increased wealth & education brings even more prevalent use of family planning & contraception
* CBR drops lower that CDR & growth becomes negative(pop. decline)
* Econ./Societal Indicators
* Very high per capita GDP
* Longest life-expectancy
* TFR, below replacement level (2.1)
* Highest contraceptive use rates