2. measuring culture growth
1/7
There's no tags or description
Looks like no tags are added yet.
Name | Mastery | Learn | Test | Matching | Spaced | Call with Kai |
|---|
No analytics yet
Send a link to your students to track their progress
8 Terms
METHODS
cell counts (haemocytometer)
optical methods (turbidity)
dilution plating
area of fungi
fungal dry mass
CELL COUNTS
bacteria and single celled fungi cultured in nutrient broth can be counted directly using a haemocytometer
haemocytometer- thick specialised microscope slide w/ a rectangular chamber that holds a standard volume of liquid (0.1mm3)
chamber is engraved with grids
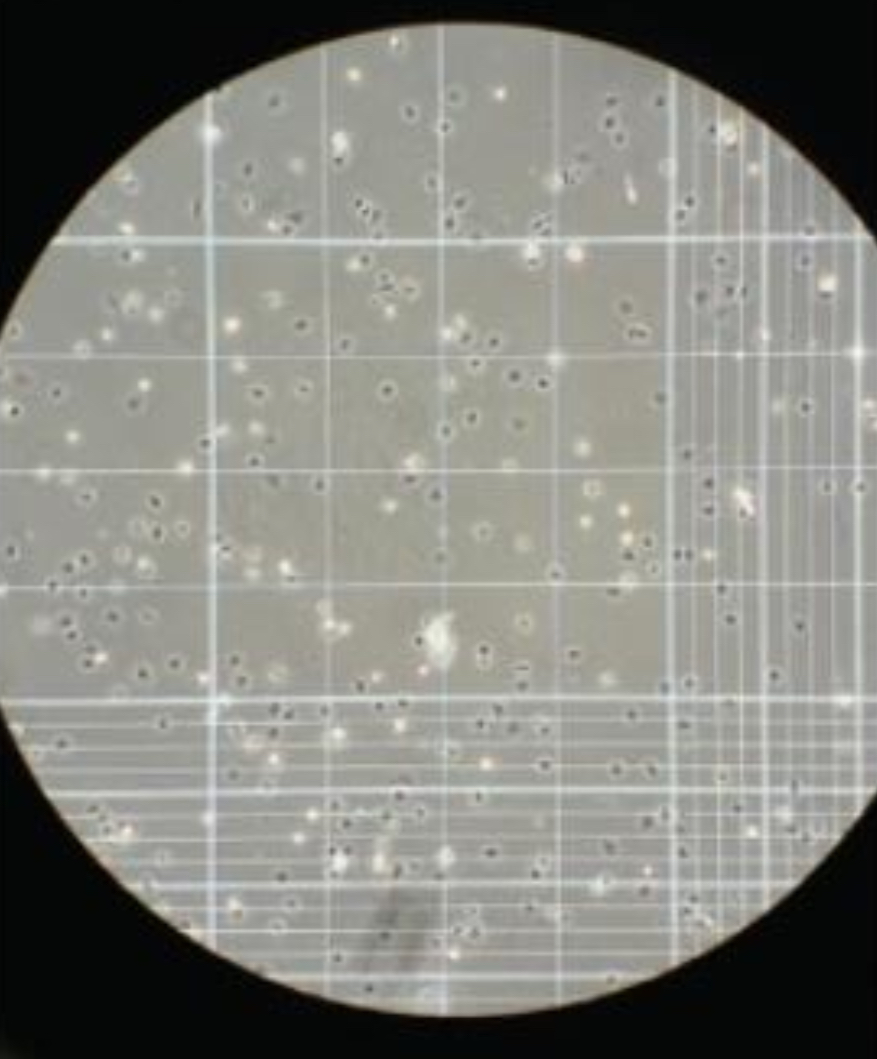
CELL COUNTS- STEPS
sample of broth is diluted by half with an equal vol of trypan blue- stains dead cells blue so only living cells counted
each corner of haemocytometer grid has a square divided into 16 smaller squares
no. of cells on one corner is counted and mean calculated
haemocytometer is calibrated so that no. of cells in one corner equates to no. of cells x 10^4 per cm3 of broth
counts can be repeated at regular intervals to show how no. of bacteria changes over time
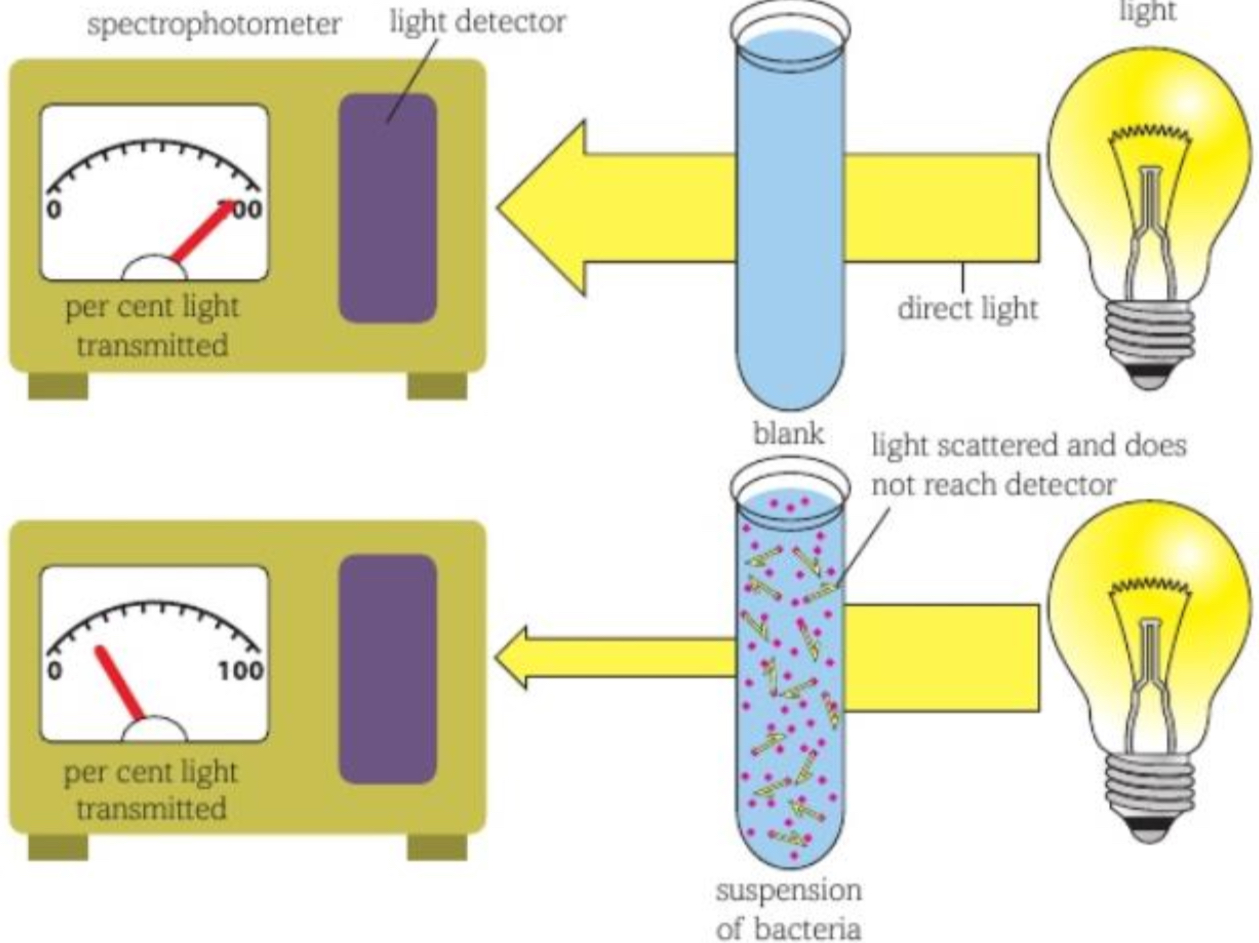
OPTICAL METHODS (TURBIDITY)
turbidimetry is a specialised form of colorimetry
as no. of bacterial cells in a culture increase it becomes increasingly cloudy looking or turbid
as solution gets more turbid it absorbs more light, so less light passes through it
a colorimeter measures this
both dead and living cells will affect turbidity
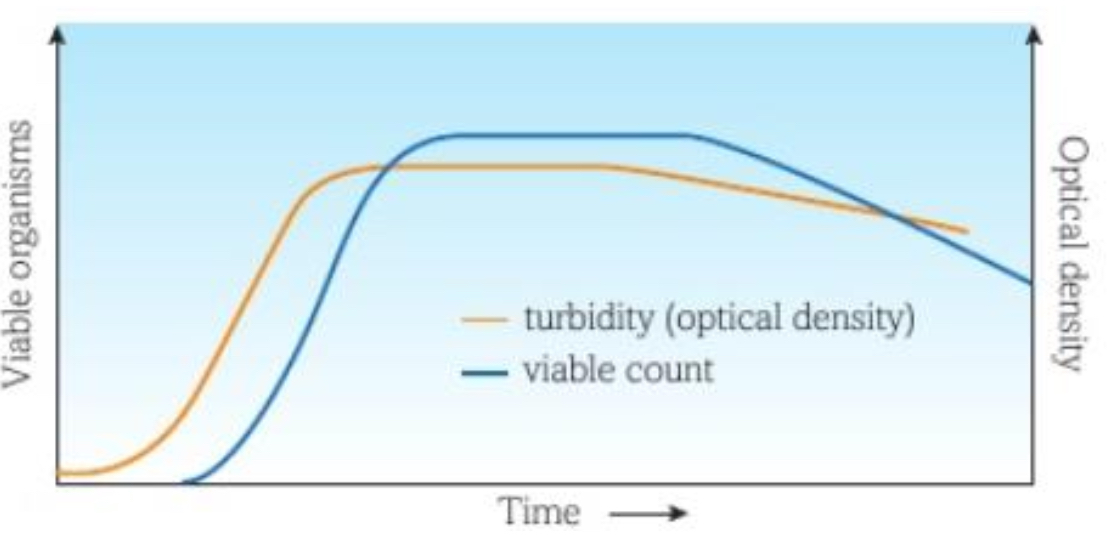
OPTICAL METHODS (TURBIDITY)- GRAPH
calibration curve produced by growing a control culture and taking samples at regular time intervals
turbidity measured and cell count done using a haemocytometer
shows relationship between no. of cells and turbidity
using this curve we can then measure turbidity of a sample and look up no. of cells present in it
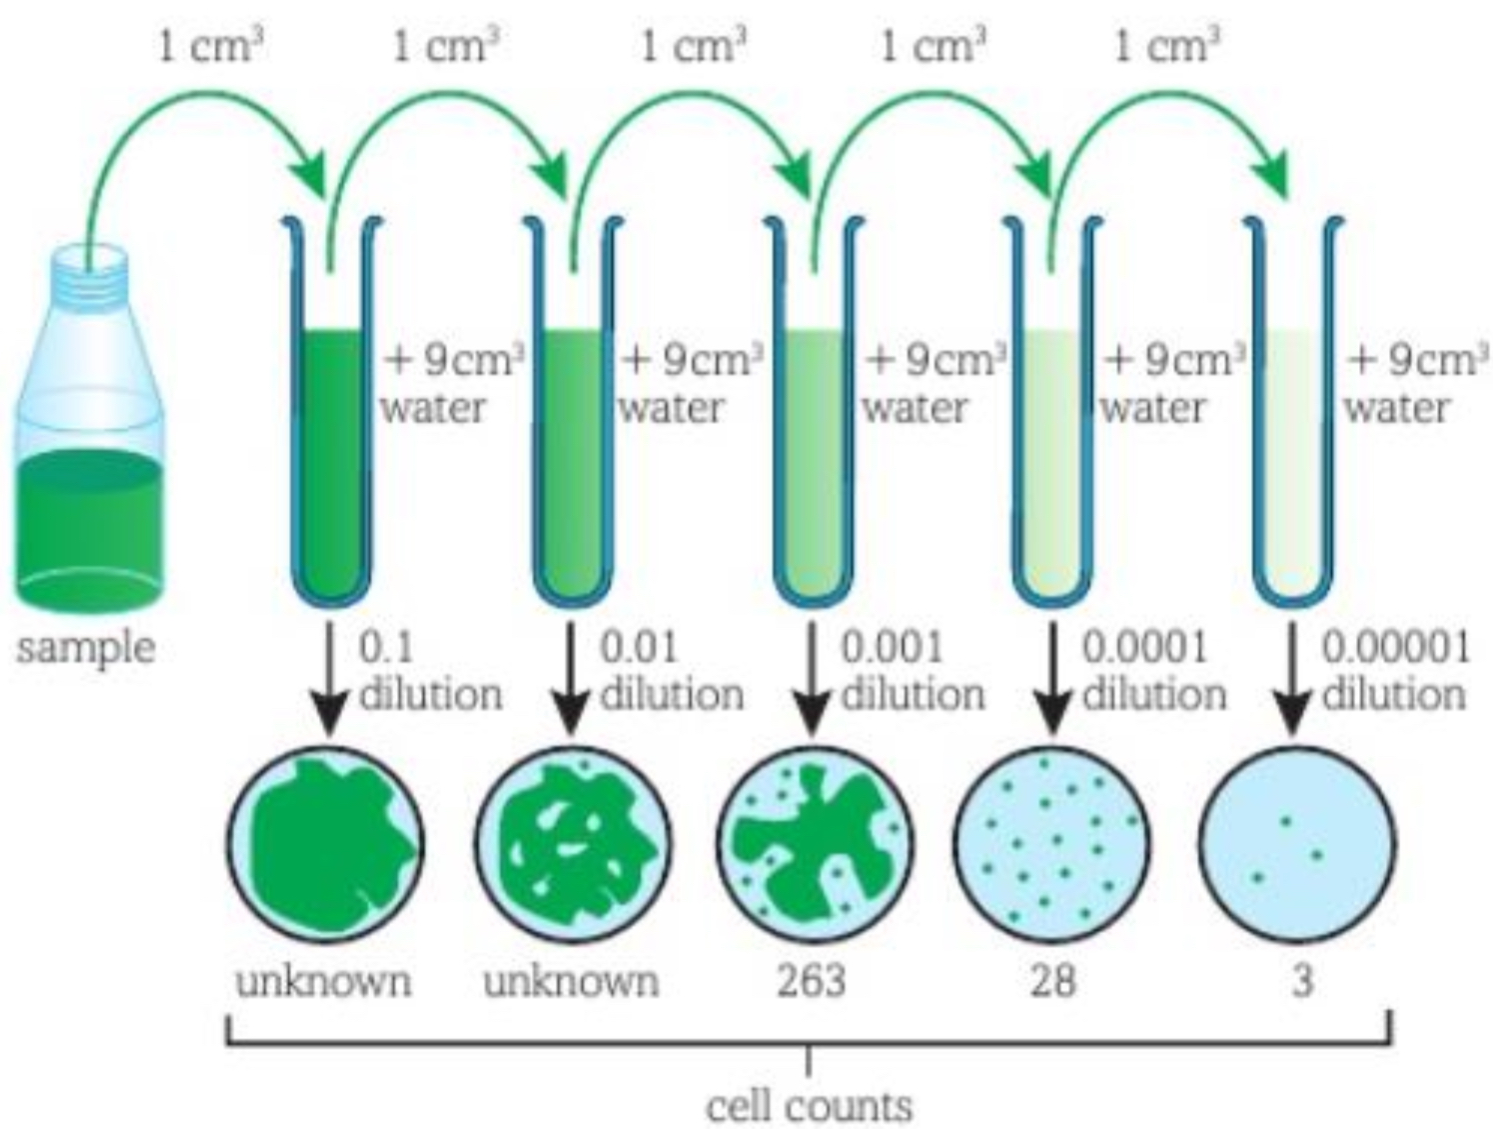
DILUTION PLATING
used to find total viable (living) cell count
based on idea that each colony on an agar plate has grown from a single, viable microbe
issue is often a solid mass is present after culturing so individual colonies can’t be counted
solved by diluting original culture in stages until individual colonies can be seen and counted
can then multiply no. of colonies by dilution factor to work out a total viable cell count
accuracy can be checked using a haemocytometer on a sample of original culture
AREA OF FUNGI
simple way to assess growth of fungi is to measure diameter of patches of mycelium
can be used to monitor growth rate in diff conditions
could be cultured at diff temps and after a period of time, diameters of each final colony measured
mean colony diameter could be calculated and temp which results in the largest one is he optimum growth temp
technique could be used on bacteria but bc small, colonies can be difficult to measure
FUNGAL DRY MASS
another way to find optimum conditions
best done using liquid growth medium
samples of broth removed at regular intervals and fungi separated from liquid by centrifugation or filtering
material then dried to the point that no more loss of mass is recorded e.g. in an oven overnight at around 100C
gives a measure of dry mass in a certain volume of culture
increase or decrease in this mass indicates an increase or decrease in mass of mycelia