Normal Distribution and Z-Scores
1/44
Earn XP
Description and Tags
These flashcards cover essential concepts related to Normal Distribution, Z-scores, and probabilities, aiding in the understanding and application of these statistical principles for exam preparation.
Name | Mastery | Learn | Test | Matching | Spaced | Call with Kai |
|---|
No analytics yet
Send a link to your students to track their progress
45 Terms
Mean
The average of all the data points in the sample.

What is X Bar?
Sample Mean
What is Population Mean symbol?

Variance
The average of the squared deviations from the mean.
S2 Is the symbol for what?
Sample Varriance

What dose this symbol mean?
Population varriance
Standard Deviation
The average deviation of each score from the mean.
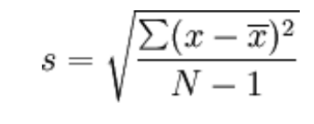
What is this equation for?
Standard Deviation
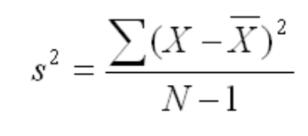
What is this equation used for?
Varriance
Normal Distribution
Symmetric, unimodal distribution usually called bell-shaped with limits of +/- infinity.
Probability
The likelihood of a particular event occurring, expressed as percentages or proportions.
Central Limit Theorem
States that if you have a big enough sample (n>30), the distribution of the sample will be approximately normal.
Standard Normal Distribution
A normal distribution where the population mean is 0 and the population standard deviation is 1.
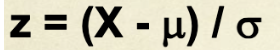
Z-Scores
Scores that indicate how many standard deviations a score is from the mean, used to find probabilities.
Z-Score Formula
Area under the curve in a normal distribution
Represents the probability that a particular score will fall within that area.
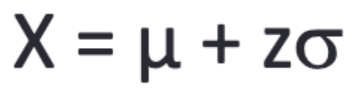
Calculating Raw Scores
Formula:
How to Calculate the Probability BETWEEN 2 scores?
1) Find Z-score of both scores 2) Use table to find the probability of getting scores LESS than the actual score. 3) Subtract larger probability from smaller
Population
The entire group of individuals, objects, or data points being studied.
Sample
A subset drawn from a population, used to make inferences about the entire population.
Parameter vs. Statistic
A parameter describes a characteristic of an entire population (\mu, \sigma), while a statistic describes a characteristic of a sample (\bar{x}, s).
Empirical Rule (68-95-99.7 Rule)
For data with a normal distribution, approximately 68% of data falls within (\pm 1\sigma), 95% within (\pm 2\sigma), and 99.7% within (\pm 3\sigma) of the mean.
Skewness
A measure of the asymmetry of a probability distribution. A normal distribution has zero skewness.
Positive Skew (Right Skew)
A distribution with a longer tail on the right side, meaning the mean is typically greater than the median.
Negative Skew (Left Skew)
A distribution with most data points on the left
SD of sampling population is also known as?
Standard Error
If P < than the alpha you
Reject Null Hypothesis (P)
If z > than Critical Z Score you…
Reject Null Hypothesis (Z)
If T > Critical T score you…
Reject Null Hypothesis (T)
What is the formula for the T-test?
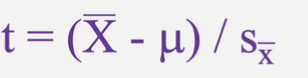
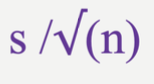
What is The symbol for SD of Sampling Distribution?

How to Find SD of Sampling Distribution?
Degrees of Freedom
The sample size - 1
2-tailed Test
A test that rejects the exreme outcomes in both directions of the distribution. Simply saying there IS a difference
1- tailed test
A test that rejects the outcomes in only one direction. Predicts a direction of difference.
What is Alpha?
The Significance Level (P-value)
Usually set at 0.05
Critical Value for 1-tailed Test with Alpha = 0.05
1.65
Critical Value for 1-tailed Test with Alpha = 0.01
2.33
Critical Value for 2-tailed Test with Alpha = 0.05
(±)1.96
Critical Value for 2-tailed Test with Alpha = 0.01
( +/-)2.58
Type I Error
The error made when rejecting a true null hypothesis, also known as a false positive. This occurs when the test indicates a significant effect when there is none.
Type II error
Occurs when you fail to reject the null hypothesis when it is false.