Module 2 Prelims & Final Quiz
1/34
Earn XP
Description and Tags
2A, 2B, 2C & Module 2 Quiz
Name | Mastery | Learn | Test | Matching | Spaced | Call with Kai |
|---|
No analytics yet
Send a link to your students to track their progress
35 Terms
Match the characteristics to their corresponding measures of center
___Is the most affected by outliers or extreme data values
___requires the addition of all of the data
___provides the value or response that occurs most often
___requires that the data be put in order and is a good measure when the data is very skewed
1.Mean
2.Median
3.Mode
1,1,3,2
At an airport, the number of flights that were more than 1 hour late were recorded for 10 randomly selected days. The data follows:
8, 6, 11, 39, 6, 21, 7, 10, 18, 31
Find the median number of flights per day that were more than one hour late.
Enter only the answer in the box. Do not round your answer.
10.5
At an airport, the number of individuals waiting to check in for their flights at a ticket counter were recorded at ten randomly selected times throughout a week. The data follows:
10, 8, 17, 22, 8, 33, 8, 18, 18, 26
Find the mean number of individuals waiting to check in for their flights at a ticket counter.
Enter only the answer in the box. Do not round your answer.
16.8
For each shape provided, determine if the mean will be greater than the median, less than the median or about equal to the median.
___symmetric and bell shaped distribution
___skewed right distribution
___skewed left distribution
___uniform distribution
1.mean is less than the median
2.mean is greater than the median
3.mean is about equal to the median
3,2,1,3
Roy has taken three exams and obtained scores of 55, 50, and 58. What grade does he need on the fourth exam to have a mean score of 59?
Enter only your answer in the box. Do not round your answer.
FYI: future attempts at this question may include a slightly different set of data
73
One set of data consists of 10 values and has a mean of 84. A second set of data consists of 6 values and has a mean of 85. If all 16 values are combined into one set of data, what would the mean be?
Round your answer to four decial places if needed.
Hint: find the sum of the values for each set of data, then add the sums
84.3750
Eighteen employees working at a government office were asked how many vacation days they took in the last 12 months. Their responses were
7, 10, 14, 15, 7, 4 , 11, 12, 9, 14, 12, 11, 8, 7, 4, 7, 17, 6
What are the values of the mean, median and mode for this sample of data?
___Mean
___Median
__Mode
1. 9
2. 7
3. 10.30
4. 9.72
5. 9.5
6. 10
4,5,2
Match the correct measure of variability with the listed properties.
Answers may be used more than once.
___only uses two data values to calculate
___is the difference between the first and third quartiles
___has squared units making real world applications difficult
___most commonly used measure of variability
___is resistant to the effects of outliers
1.variance
2.standard deviation
3.IQR
4.range
4,3,1,2,3
Match the correct symbols to their corresponding names
___sample variance
___population variance
___population standard deviation
___sample standard deviation
1.S
2.σ
3.σ2
4.S2
4,3,2,1
The number of hours that elapsed between a person ordering an item online from Amazon using Prime and receiving their items was recorded for eight orders. Find the standard deviation of this sample of times.
31, 39, 55, 42, 36, 52, 41, 51
Round your answer to two decimal places (e.g. 5.392058 would round to 5.39)
8.47
Remember to use your graphing calculator's special "1-variable statistics" function for problems like this. You will never be tested on using the formula to find the standard deviation. This is more of a "Do you know how to use your technology?" kind of question. If you do not use your calculator's special functions, you will use up most of your time on the graded quiz trying to find an answer to a question similar to this one.
While being able to find the standard deviation is important, even more so is knowing what it is tell us about the data.
The number of hours that elapsed between a person ordering an item online from Amazon without using Prime and receiving their items was recorded for twelve orders. Find the interquartile range for of this sample of times.
39, 47, 50, 63, 66, 67, 88, 90, 93, 105, 141, 250
Round your answer to one decimal place (e.g. 5.3920 would round to 5.4)
42.5
This sample of data below has a mean of 60 and a standard deviation of 2.52. What percent of the data falls within one standard deviation of the mean?
56, 57, 58, 58, 59, 59, 59, 61, 61, 62, 63, 63, 64
Round your answer to one decimal place. Do not include the percent sign. For example, if your answer was 34.38274% you would enter 34.4
61.5
Within one standard deviation from the mean indicates you have to subtract the standard deviation from the mean to get the lower value of the interval and add a standard deviation to the mean to get the upper value of the interval
A set of 44 data values has a mean of 408, a range of 34, a standard devaition of 9.0 and a median of 400. What is the variance for this set of data?
Round your answer to two decimal places if needed.
81.00
DIRECTIONS: enter the correct phrase, without the quotes, in each blank. Enter either "are" or "are not" in the first blank. Enter either "increase" or "decrease" in the second blank, and enter either "greater" or "less" in the third blank.
A set of 15 data values has a mean equal to 80 and a standard deviation equal to 6. Two more values of 60 and 100 are added to the data set so there are now 17 data values. These two values
______(33.3 %) extreme values. This causes the spread of the data to
______(33.3 %) therefore the standard deviation of all 17 values will be
______(33.4 %) than six.
are, increase, greater
Three sets of data exist.
Set #1: consists of 40 data values, has a mean of 165 and a standard deviation of 17.
Set #2: consists of 50 data values, has a mean of 105 and a standard deviation of 22.
Set #3: consists of 65 data values, has a mean of 125 and a standard deviation of 29.
Match the data sets to their descriptions.
___has the smallest values on average
___has the largest values on average
___has the values that have the least amount of spread (are closest together)
___has the values that are most spread out
1.Set #1
2.Set #2
3.Set #3
2,1,1,3
Suppose an entire population consists of the following six values.
Find the value of the population standard deviation for this population of data.
12, 15, 11, 14, 17, 13
Round your answer to two decimal places. (e.g 5.6381 would round to 5.64)
1.97
Answer the following questions.
Not all percentages will be used. Some percentages may be used more than once.
___What percent of the data should be less than the first quartile?
___What percent of the data should be between the second quartile and the third quartile?
___What percent of the data should be between the first quartile and the second quartile?
___What percent of the data should be greater than the third quartile?
1.25%
2.50%
3.75%
1,1,1,1
A five number summary of a set of data consists of the values 88, 93, 100, 109, 113
Match the correct percentages with the descriptions. Not all percentages listed have to be used. Some percentages may be used more than once.
___the percent of data greater than or equal to 93
___the percent of data in the interval 109 to 113
___the percent of data in the interval 93 to 109
___The percent of data greater than or equal to 100
1.25%
2.68%
3.0%
4.50%
5.75%
6.95%
5,1,4,4

A sample of forty values was selected from a population and then used to create the given modified boxplot. Select all statements that are true regarding this boxplot.
A. The value of the third quartile is 68
B. we should expect at least 25% of the data to be greater than 63.
C. The value of the median is about 55
D. The value of the first quartile is about 48.
B. we should expect at least 25% of the data to be greater than 63.
C. The value of the median is about 55
D. The value of the first quartile is about 48.
25% of the data should be greater that the third quartile which is about 65, therefore at least 25% of the data should be greater than 63
The median is represented by the middle vertical line that splits the box into two parts.
The vertical line on the left side of the boxes represents the first quartile
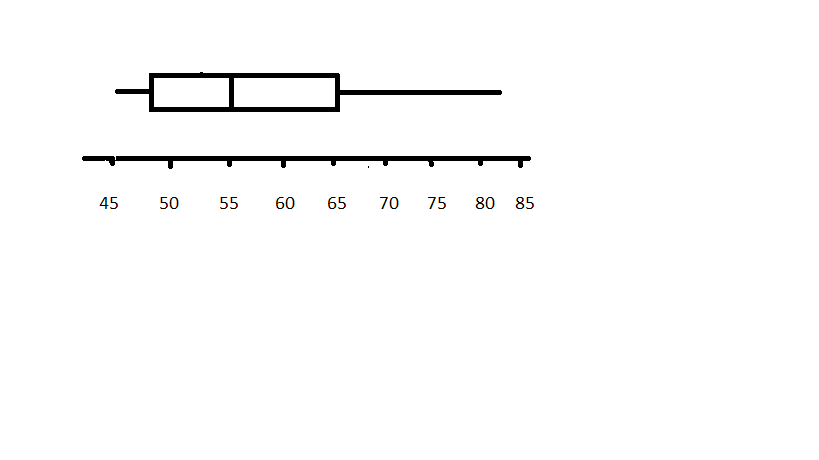
A sample of forty values was selected from a population and then used to create the given modified boxplot. Select all statements that are true regarding this boxplot.
A. The range of this set of data is around 37
B. This boxplot has a long whisker (single line) on the right and a short whisker (single line) the left. This implies there are more data values in the right whisker than in the left whisker.
C. There are extreme values on the right hand side (extreme large values) of this boxplot.
D. There are two boxes in the middle of a boxplot, the one of the right and the one on the left. For this boxplot, the box on the right should represents 10 data values and the one on the left should represent 10 data values.
A. The range of this set of data is around 37
D. There are two boxes in the middle of a boxplot, the one of the right and the one on the left. For this boxplot, the box on the right should represents 10 data values and the one on the left should represent 10 data values.
Range is maximum - minimum which in this case is about 83 - 46
There are forty values altogether in this boxplot. Each part of the boxplot represents 25% of the data.
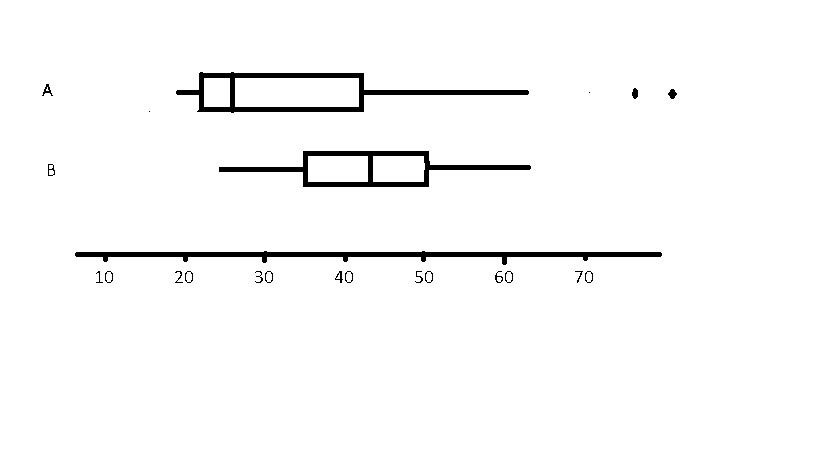
Samples of data from distribution A (on top) and distribution B (on bottom) are represented in the boxplots above. The two outliers in A are represented by single dots on the right. They are both use the number line provided. Select all statements that are true regarding these boxplots.
A. Distribution A is skewed to the left
B. Distribution B has a larger IQR
C. The median of distribution A is less than the median of distribution B
D. More than 75% of distribution A is less than the median of distribution B
E. The maximum value from distribution A sample is greater than the maximum value from distribution B sample.
C. The median of distribution A is less than the median of distribution B
D. More than 75% of distribution A is less than the median of distribution B
E. The maximum value from distribution A sample is greater than the maximum value from distribution B sample.

Samples of data from distribution A (on top) and distribution B (on bottom) are represented in the boxplots above. The two outliers in A are represented by single dots. They are both use the number line provided. Select all statements that are true regarding these boxplots.
A.the range of distribution A is larger than the range of distribution B
B.Distribution B is approximately bell shaped.
C.100% of the data in distribution B is greater than the median of distribution A
D.The third quartiles of both distributions are approximatly equal to each other.
E. more than 25% of the data in distribution A is less than the minimum value of distribution B
A.the range of distribution A is larger than the range of distribution B
B.Distribution B is approximately bell shaped.
E. more than 25% of the data in distribution A is less than the minimum value of distribution B
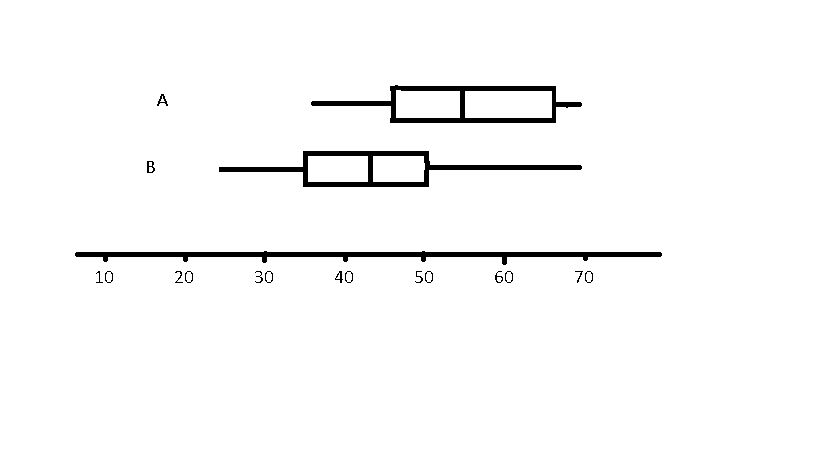
Use the box plots labeled A and B below to determine which statements are true. Check all true statements.
A.The median of boxplot B is greater than the first quartile of boxplpot A
B.Both data sets have approximately equal maximum values
C.More than 25% of the data in boxplot A is greater than 60
D. Boxplot A has the larger IQR
B.Both data sets have approximately equal maximum values
C.More than 25% of the data in boxplot A is greater than 60
D. Boxplot A has the larger IQR
A set of data consists of the following values:
1, 6, 7, 7, 8, 8, 9, 10, 10, 11, 12, 15, 18
According to the modified box plot method of detecting potential outliers, are there any potential outliers in this set of data?
A. Yes, there are potential outliers on the left but not on the right
B. Yes, there are potential outliers on the right but not on the left
C. No, there are no potential outliers
D. Yes, there are potential outliers on the right and the left.
C. No, there are no potential outliers
A large set of data has the five number summary of minimum = 60, Q1 = 65, Q2 = 66, Q3 = 68, and max. = 75. If a modified box plot was created, would there be any potential outliers in this set of data? (hint: use the modified box plot method of detecting potential outliers to determine if the maximum or minimum values are potential outliers)
A. Yes, both the minimum and maximum values are potential outliers, along with possible other values
B. Yes, the minimum value, and possibley other small values, are potential outliers
C. Yes, the maximum value, and possibly other large values, are potential outliers
D. No, there are no outliers
A. Yes, both the minimum and maximum values are potential outliers, along with possible other values
Although we are not provided with the entire set of data, we are provided with the five number summary which is all we need to find possible outliers on a modified boxplot. If the minimum value is within the fences then all lower values are within the fences. (same arguement for the maximum)
The ages of eight randomly selected customers at an eye-glasses shop were recorded. Find the median age for this sample.
75, 40, 56, 64, 49, 39, 37, 56
Do not round your answer.
52.5
A random sample of ten residents at a senior citizens home were recorded. What is the mean age of this sample?
88, 78, 81 83, 75, 79, 75, 74, 90, 82
Do not round your answer. (e.g. if your answer is 45.8728, you would enter 45.8728)
80.5

Determine the shape and the assocaition of the mean and median of this historgram.
A. Skewed left so the median will be greater than the mean
B. Skewed right so the mean will be greater than the median
C. Skewed left so the mean will be greater than the median
D. Skewed right so the median will be greater than the mean
A. Skewed left so the median will be greater than the mean
A sample of 6 different soils were tested to determine their pH levels. Find the standard deviation of pH levels for this sample.
2.9, 8.1, 3.5, 7.1, 4.7, 5.4
Round your answer to two decimal places. (for example, if your answer was 12.88747, you should enter 12.89)
2.02
The five number summary for a large sample of data was found to be 5.3, 6.3, 7.1, 7.7, 10.0. What percent of the data is expected to be greater than 6.3?
A. 95%
B. 25%
C. 50%
D. 68%
E. 75%
F. 60%
E. 75%

Use the box plots labeled A and B below to determine which statements are true. Check all true statements.
A. Less than 25% of the data in boxplot B is less than the first quartile of boxplpotA
B. More than 75% of the data in boxplot A is greater than the median of boxplotB
C. The maximum value of Boxplot A is approximately equal to the maximum value of BoxplotB
D. The value of the third quartile of boxplot A is about 55
B. More than 75% of the data in boxplot A is greater than the median of boxplotB
C. The maximum value of Boxplot A is approximately equal to the maximum value of BoxplotB
Three sets of data were collected. None of the data sets had any outliers.
Data set #1 has a mean equal to 88 and a standard deviation equal to 8
Data set #2 has a mean equal to 99 and a standard deviation equal to 12
Data set #3 has a mean equal to 79 and a standard deviation equal to 15
___Has the least spread of data (most compact)
___On average, has the smallest values
1.Data Set #1
2.Data Set #2
3.Data Set #3
1,3
Kori was taking an introductory statistics course. She was given a set of data and asked to find the percent of the data that was within 1 standard deviation of the mean. She was unsure how to figure this out so she tired four different ways to find an answer. Her four answers are listed below. One of her attempts produced the right answer. Which of the following is the right answer?
A. 70
B. 43
C. 99
D. 12
A. 70

A sample of 80 observations was collected from a population and this boxplot was created from the data. Select ALL statements that are true regarding this boxplot.
A. The middle 50% of the data is between 55 and 65
B. the long right whisker (line) represents about 30 of the 80 data values
C. The data appears to be skewed to the right
D. At least 20 observations are less than 50.
C. The data appears to be skewed to the right
D. At least 20 observations are less than 50.
A set of data consists of the following values:
1, 3, 7, 8, 8, 9, 9, 10, 10, 10, 11, 12, 15, 18, 20
According to the modified box plot method of detecting potential outliers, are there any potential outliers in this set of data?
A. Yes, there are potential outliers on the right and the left.
B. Yes, there are potential outliers on the right but not on the left
C. No, there are no potential outliers
D. Yes, there are potential outliers on the left but not on the right
A. Yes, there are potential outliers on the right and the left.