LESSON 4: THE SHAPE OF THE DISTRIBUTION
 Call Kai
 Learn
Learn Practice Test
 Spaced Repetition
 Match
Match Flashcards
 Knowt Play
1/27

There's no tags or description
Looks like no tags are added yet.
Name | Mastery | Learn | Test | Matching | Spaced | Call with Kai | Chat |
|---|
No analytics yet
Send a link to your students to track their progress
28 Terms
SHAPE OF A DISTRIBUTION
- Guides the choice of analysis.
- The overall pattern of data when plotted (e.g., histogram).
Why it matters in psychology:
- Guides choice of statistical measures.
- Helps detect unusual patterns (e.g., extreme anxiety scores).
- Influences the validity of statistical tests.
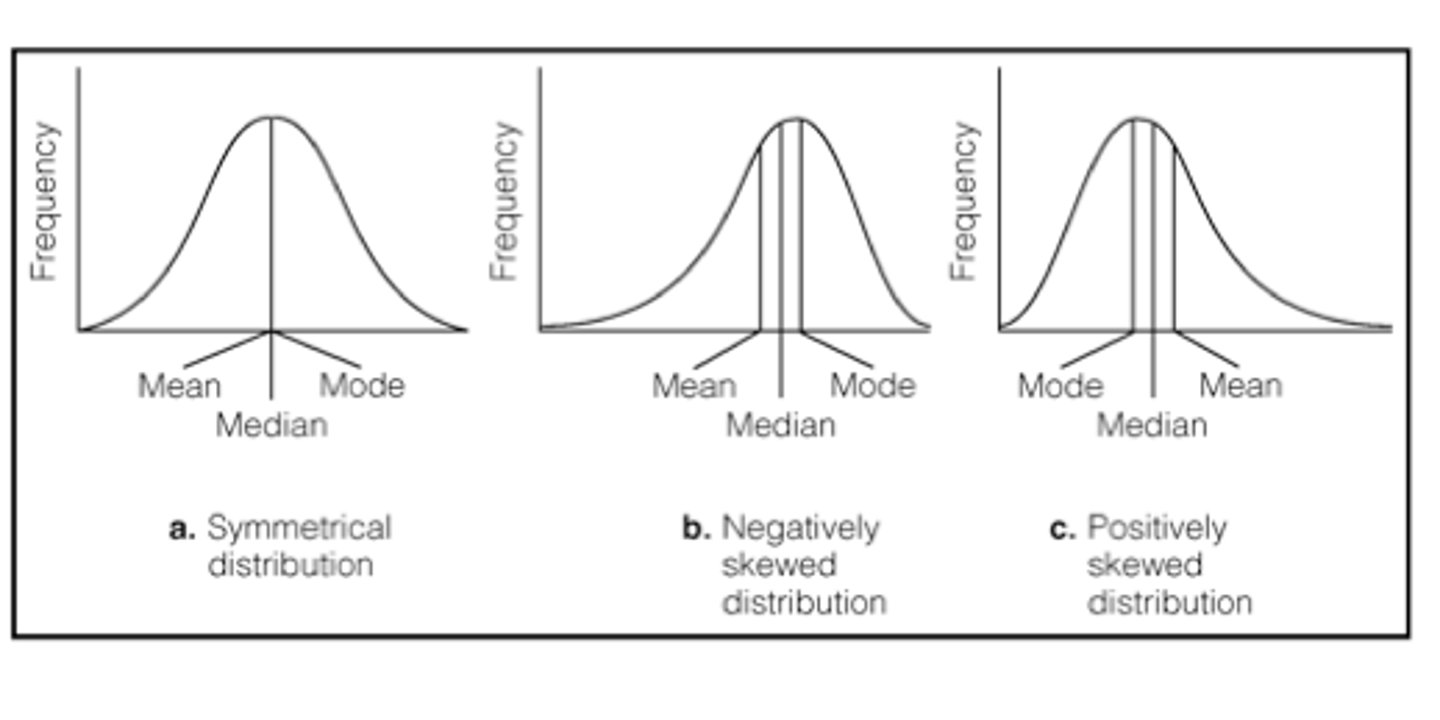
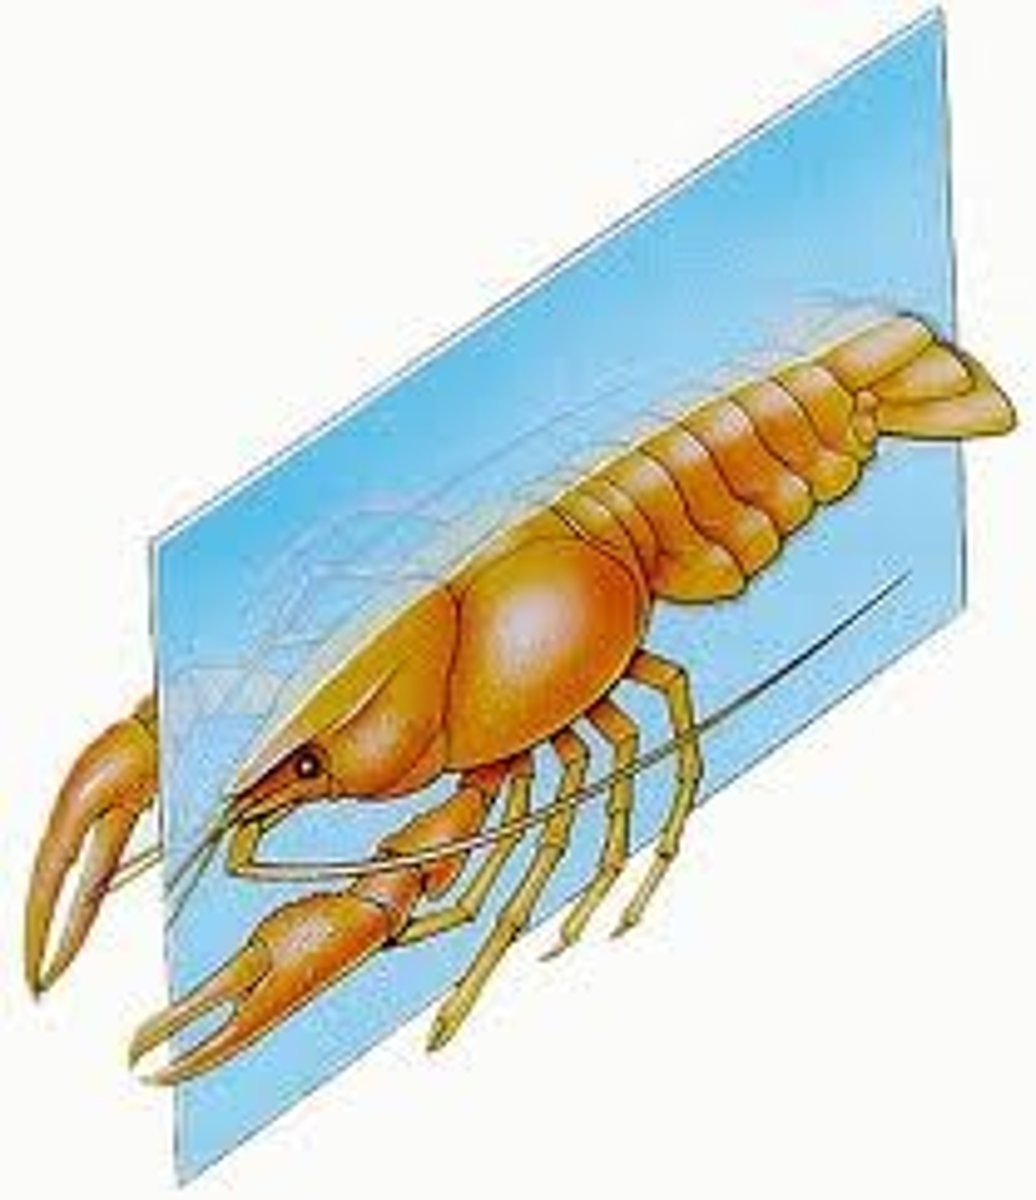
Symmetry
- Are both sides mirror images?
- Skewness = 0
Skewness
- Is one tail longer than the other?
- The degree of asymmetry in a distribution.
- It affects the placement of the mean, median, and mode.
- reveal data characteristics.
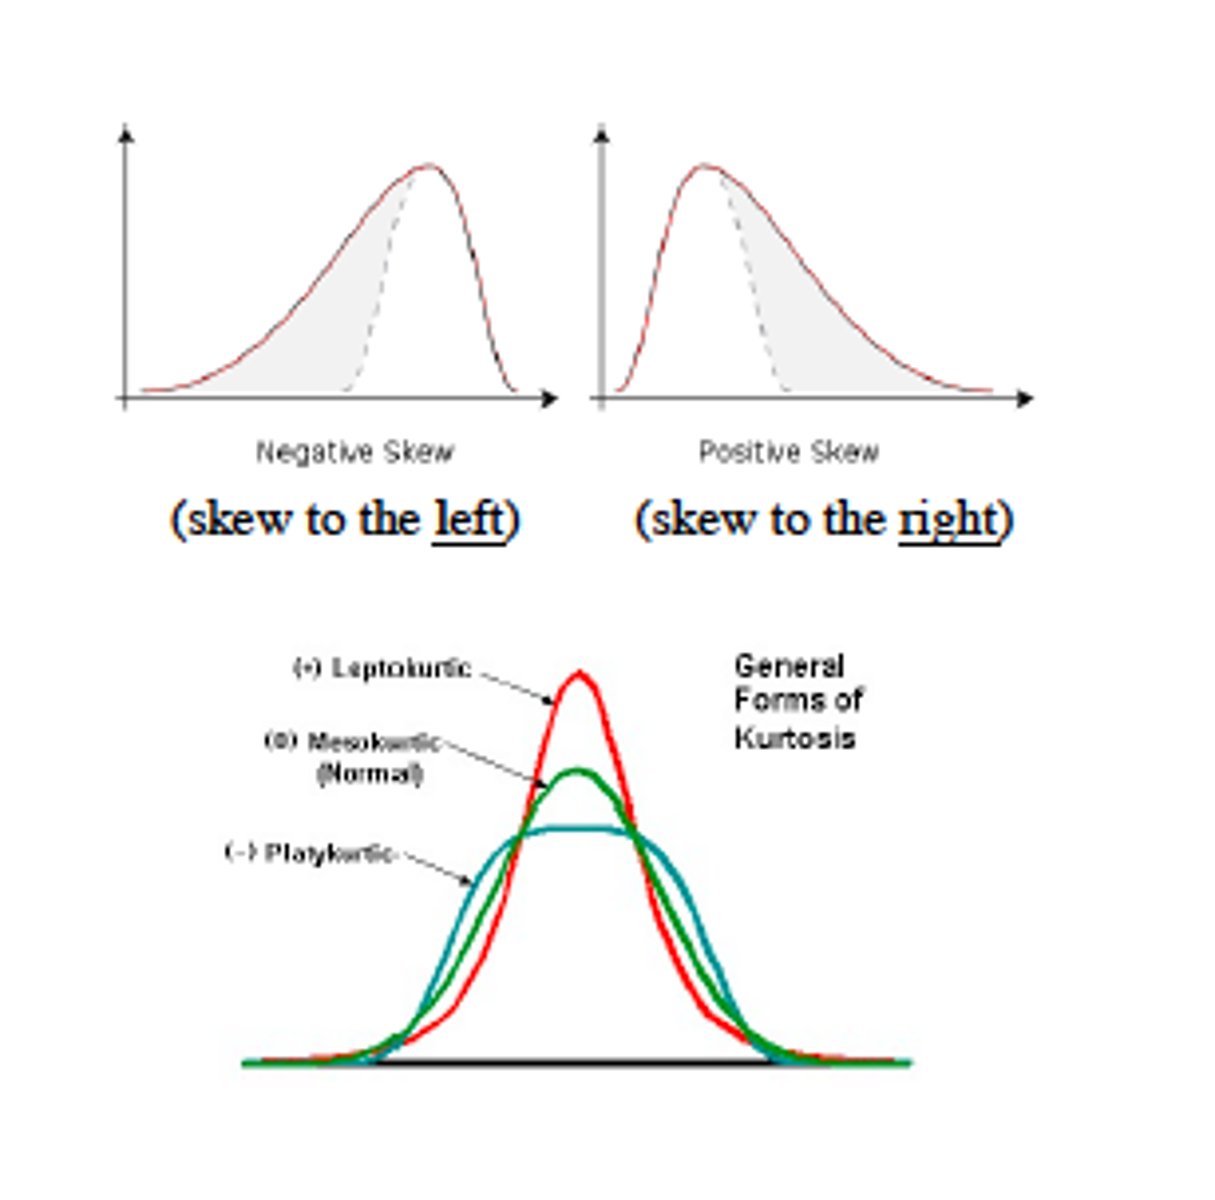
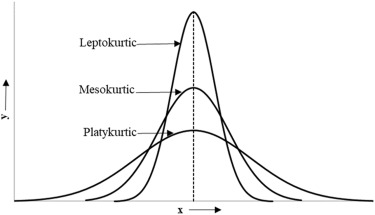
Kurtosis
- How peaked or flat is the curve?
- reveal data characteristics.
- Describes "peakedness" and "tailedness" of a distribution.
SYMMETRICAL DISTRIBUTIONS
- A distribution where left and right halves are mirror images.
- Rare in real-world psychological data but many are approximately symmetrical.
Psychology Example:
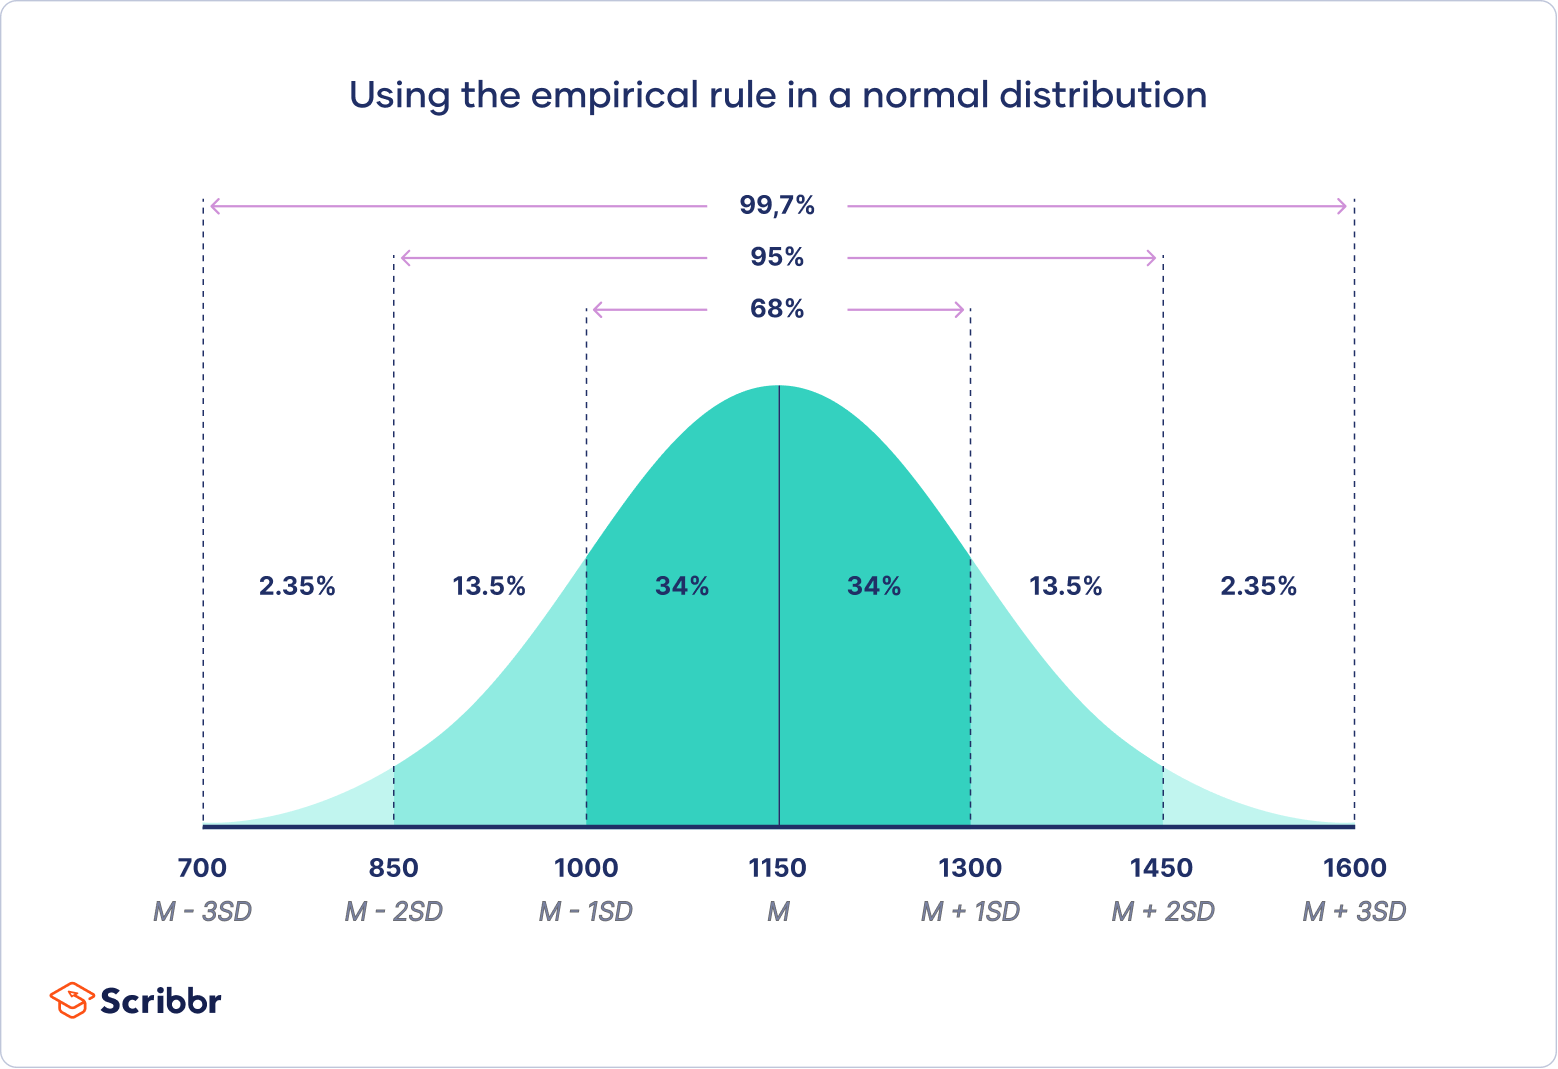
IQ scores in the general population are approximately symmetrical, making the mean, median, and mode nearly equal.
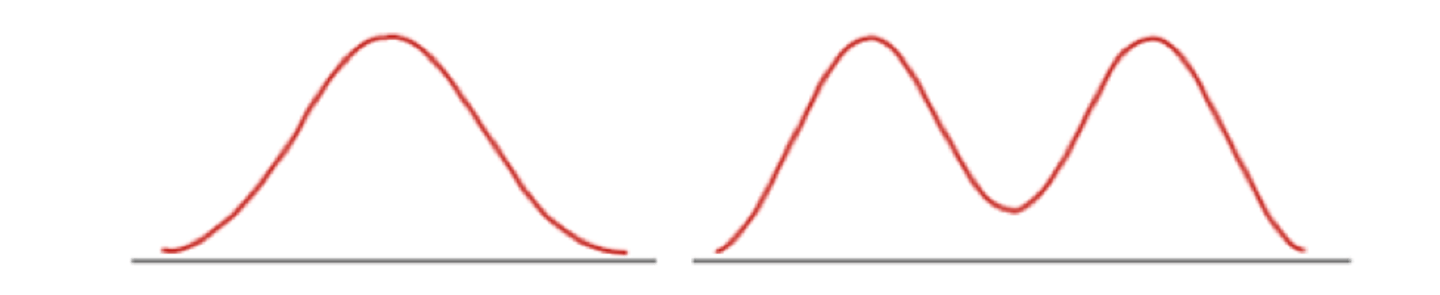
Normal distribution
is the classic example.
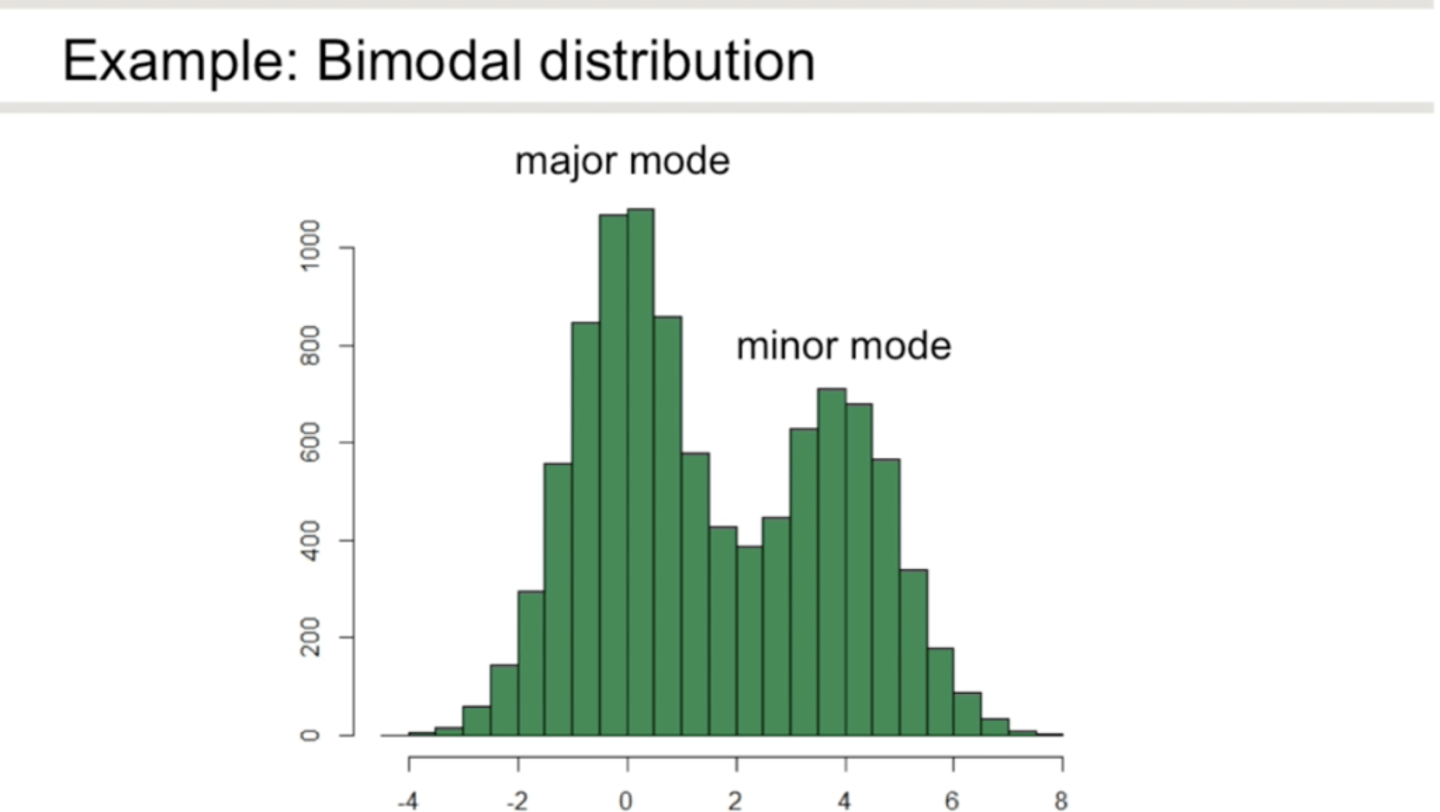
BIMODAL DISTRIBUTIONS
- A distribution with two distinct peaks.
Why it matters:
- Indicates the presence of two subgroups or underlying processes.
- Average (mean) may not represent either group well.
- Potential for overlooking important insights.
- Requires a much more sophisticated measure.
Psychology Example:
Stress levels among hospital staff may show one peak for nurses and another for doctors.
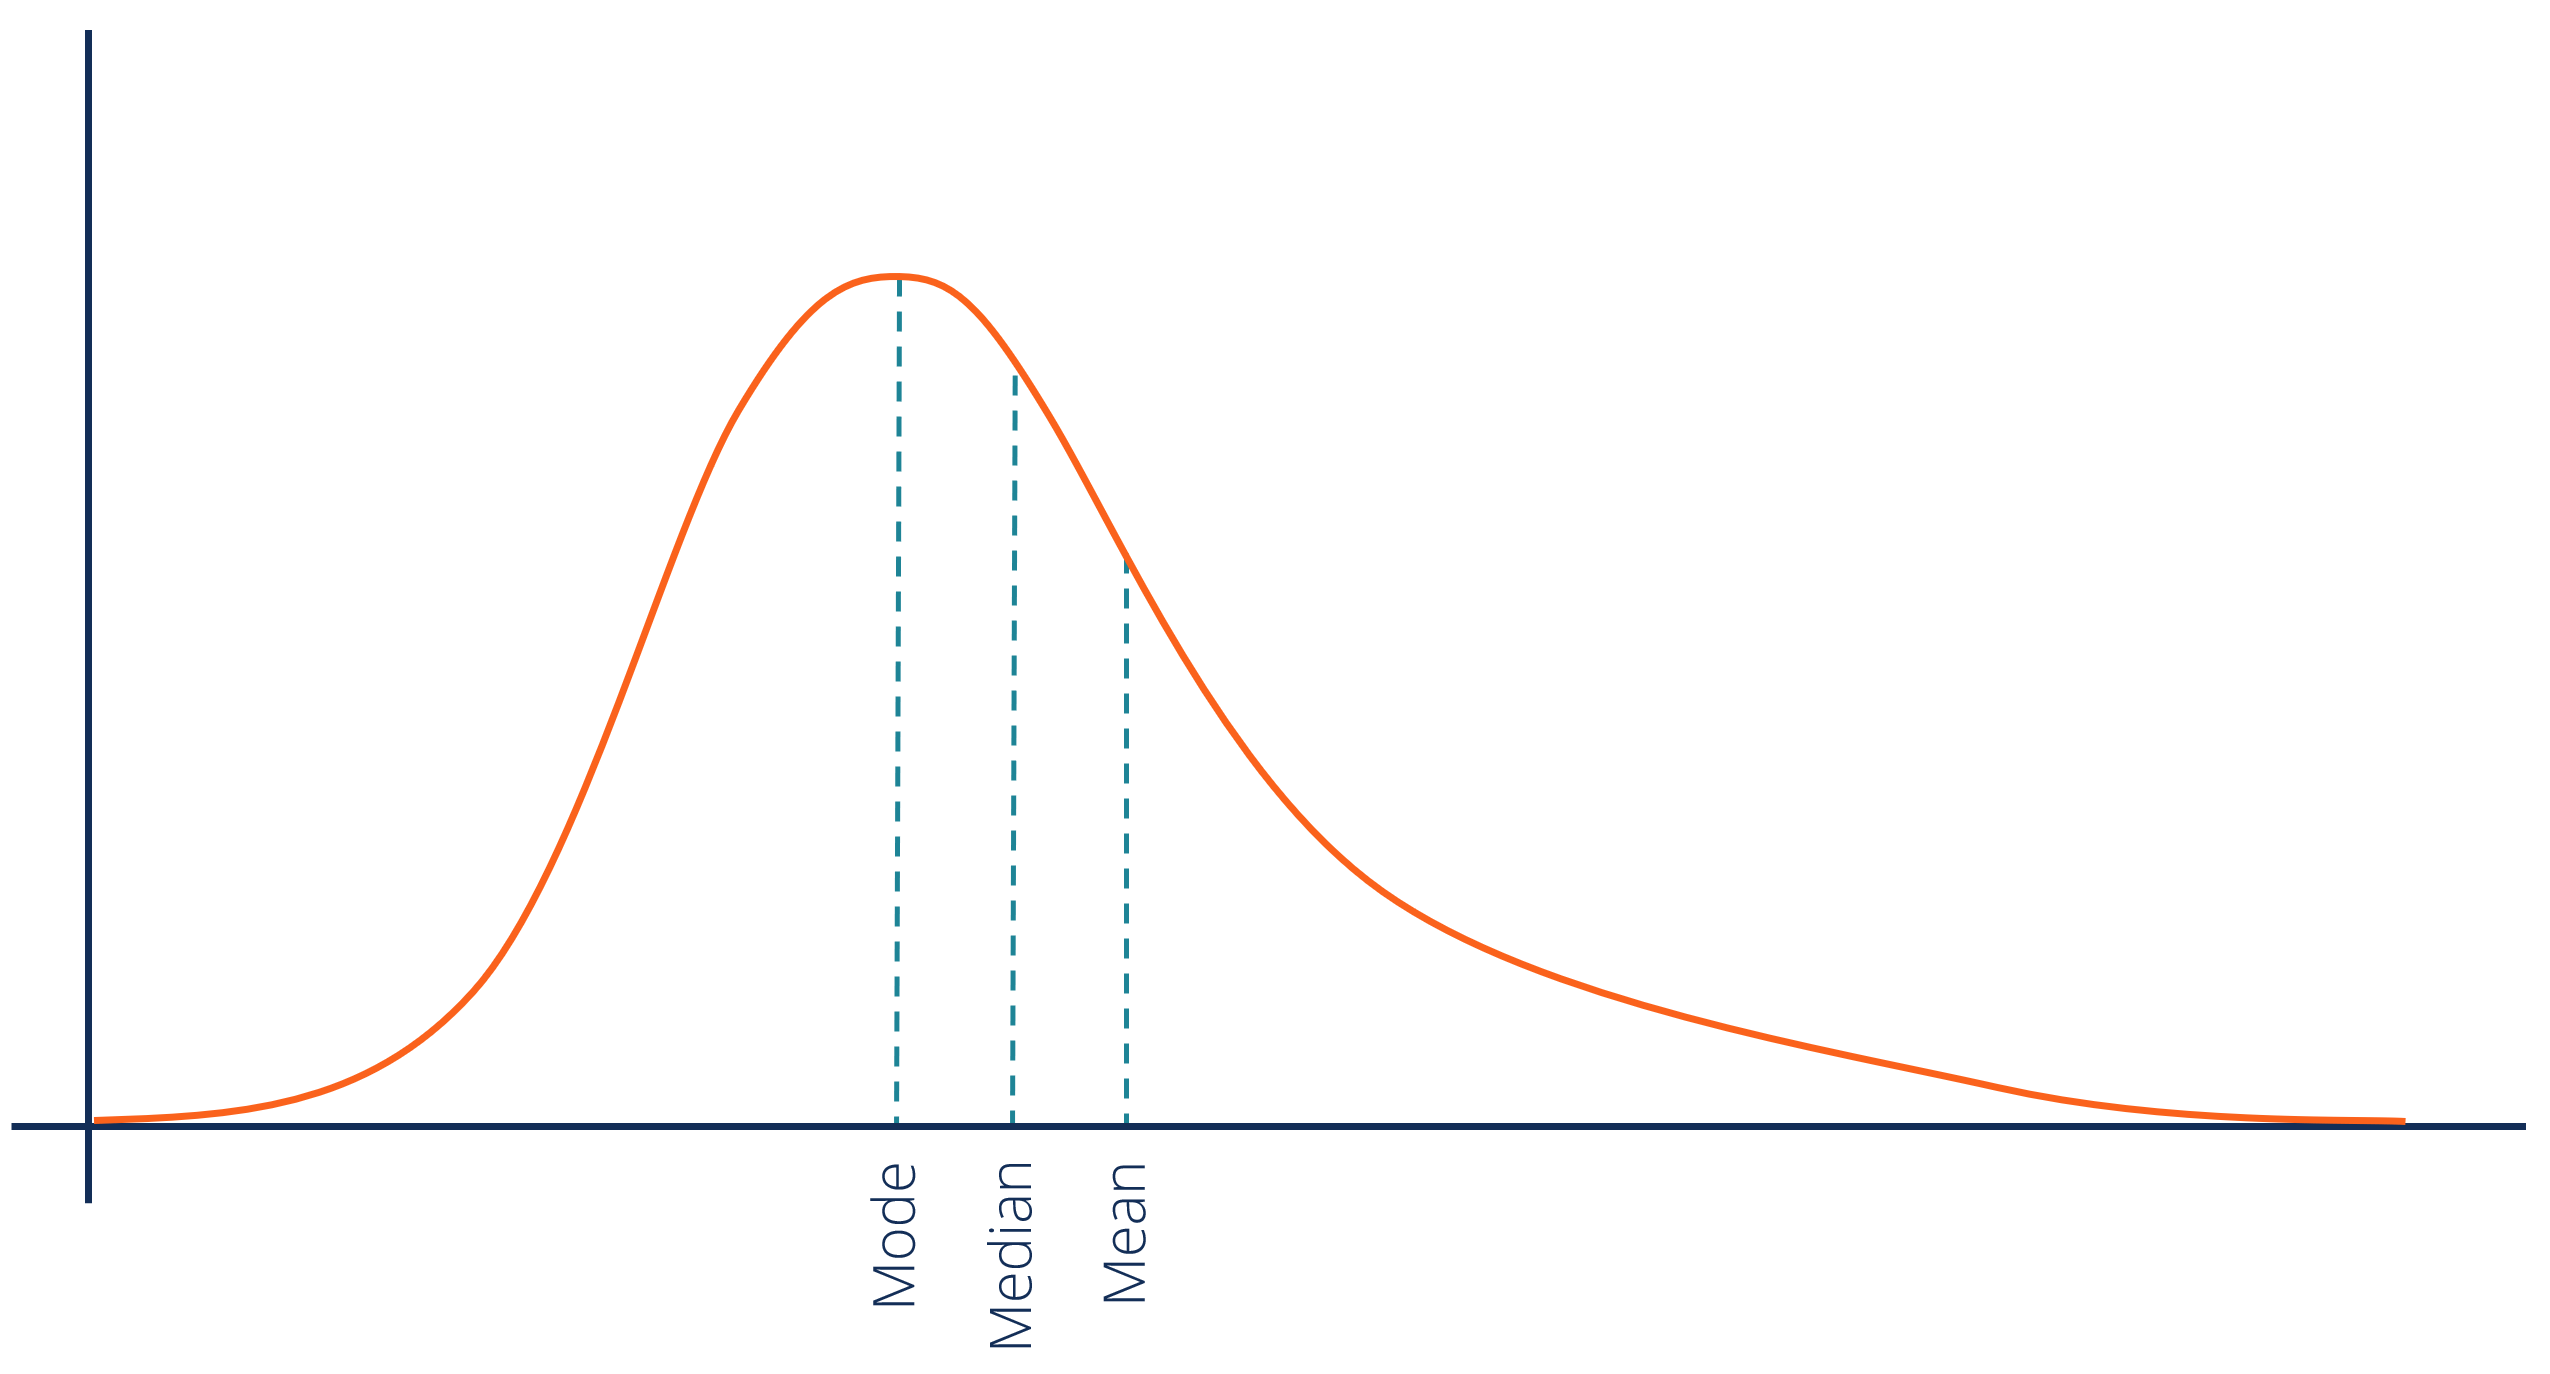
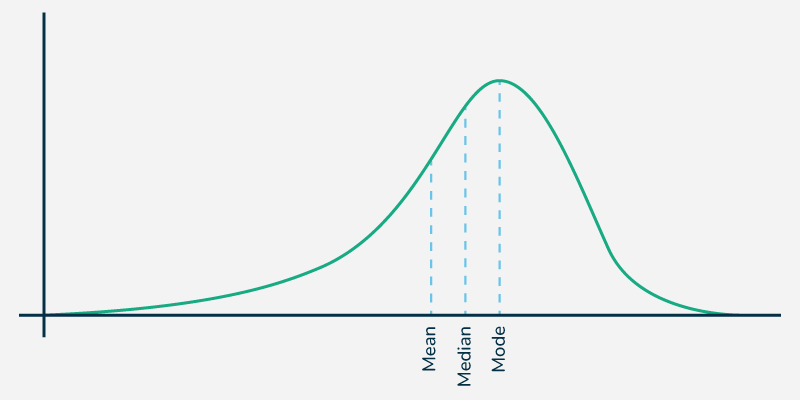
Positive skew
→ tail to the right.
- Tail on the right is longer.
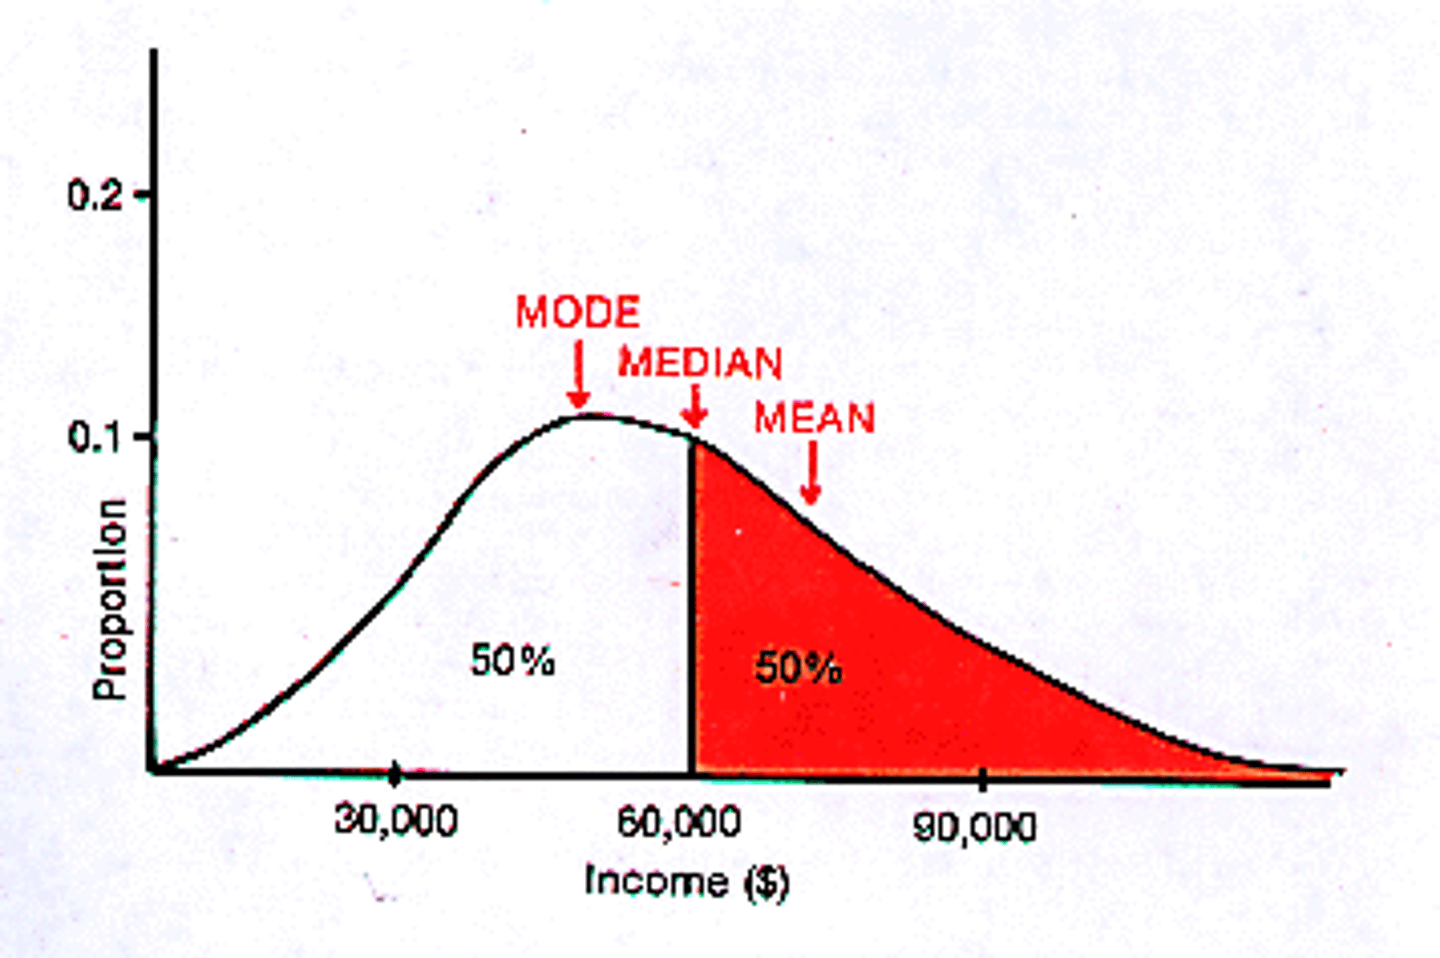
- Mean > Median > Mode.
- Often caused by extreme high values.
- Skewness > +0.4
Psychology Example:
Therapy wait times — most clients start quickly, but a few wait months.
Negative skew
→ tail to the left.
- Tail on the left is longer.
- Mean < Median < Mode.
- Often caused by extreme low values.
- Skewness < -0.4
Psychology Example:
Memory recall scores in older adults — most score high, but a few with impairments pull the tail left.
Approximately Symmetrical
−0.4 ≤ Skewness ≤ 0.4
Excess kurtosis
(common in software)
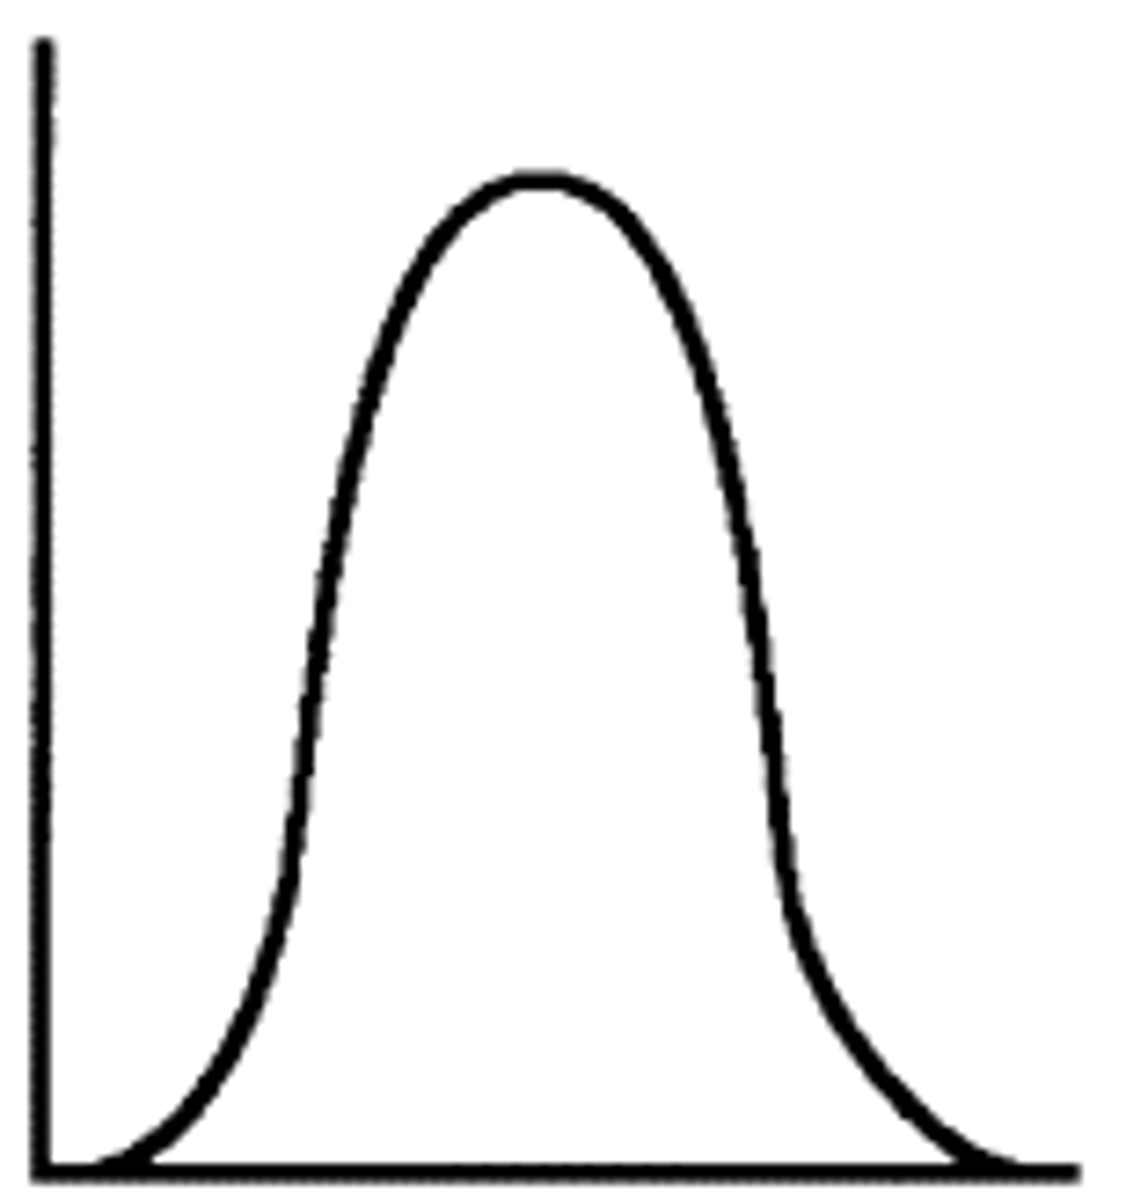
Leptokurtic
- (steep curve)
- Tall peak, heavy tails (more outliers).
- Higher risk of extreme values.
- Kurtosis > 0
Example:
Test anxiety scores in a highly competitive school — most cluster tightly, but some extreme cases exist.
Mesokurtic
- (normal curve)
- Moderate peak, moderate tails.
-Shape similar to normal distribution.
- Kurtosis = 0
Example:
Height distribution of adult males.
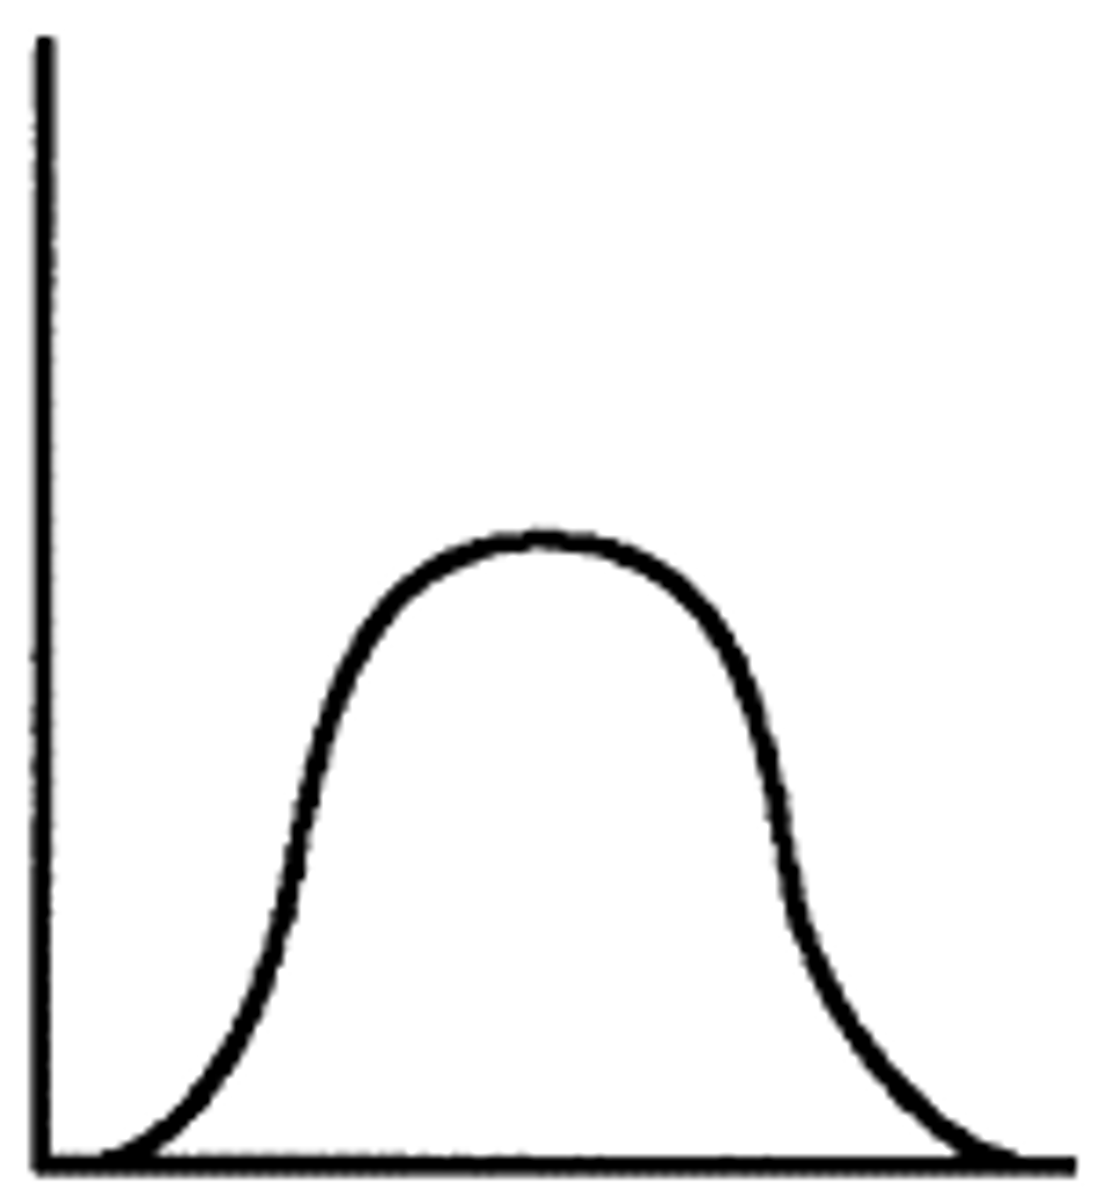
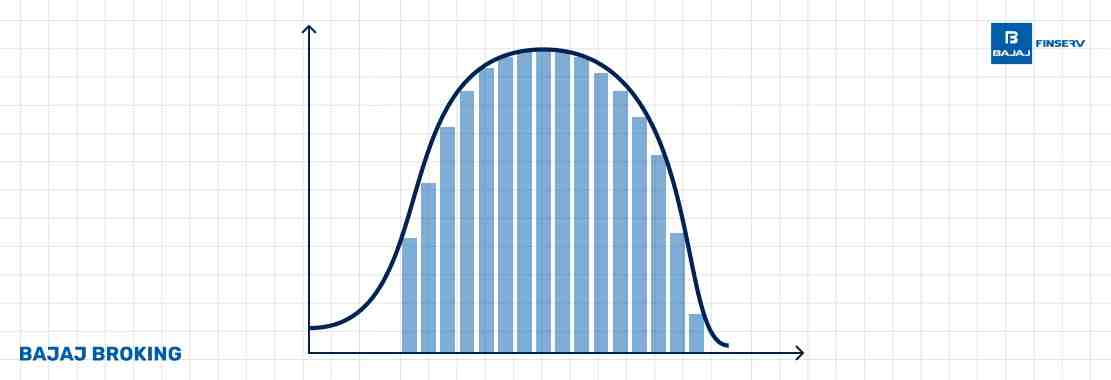
Platykurtic
- (flat curve)
- Flat peak, light tails.
- Fewer extreme values.
- Kurtosis < 0
Example:
Satisfaction survey where responses are more evenly spread.
CENTRAL TENDENCY
- refers to the statistical measures that identify the central point or typical value of a dataset.
- It summarizes data by identifying a representative score around which other values cluster.
Mean
- pulled toward tail in skewed data.
- Is the average of a dataset.
- Sum of all of the scores in the distribution divided by the number of scores
Median
- more stable in skewed data.
- The middle score of a set if the scores are organized from the smallest to the largest.
- When there is an odd number of scores, it is still simply the middle number.
- When even numbers, it is still the mean of the two middle scores.
- When there are numbers with the same values, each appearance of that value gets counted.
Mode
- The most frequently occurring value in the dataset
- stays at the peak.
- Only measure that we can use on qualitative or categorical data as well as numerical score data
- A dataset can have one mode, more than one mode, or no mode at all.
Bimodal or multimodal distribution
- several modes
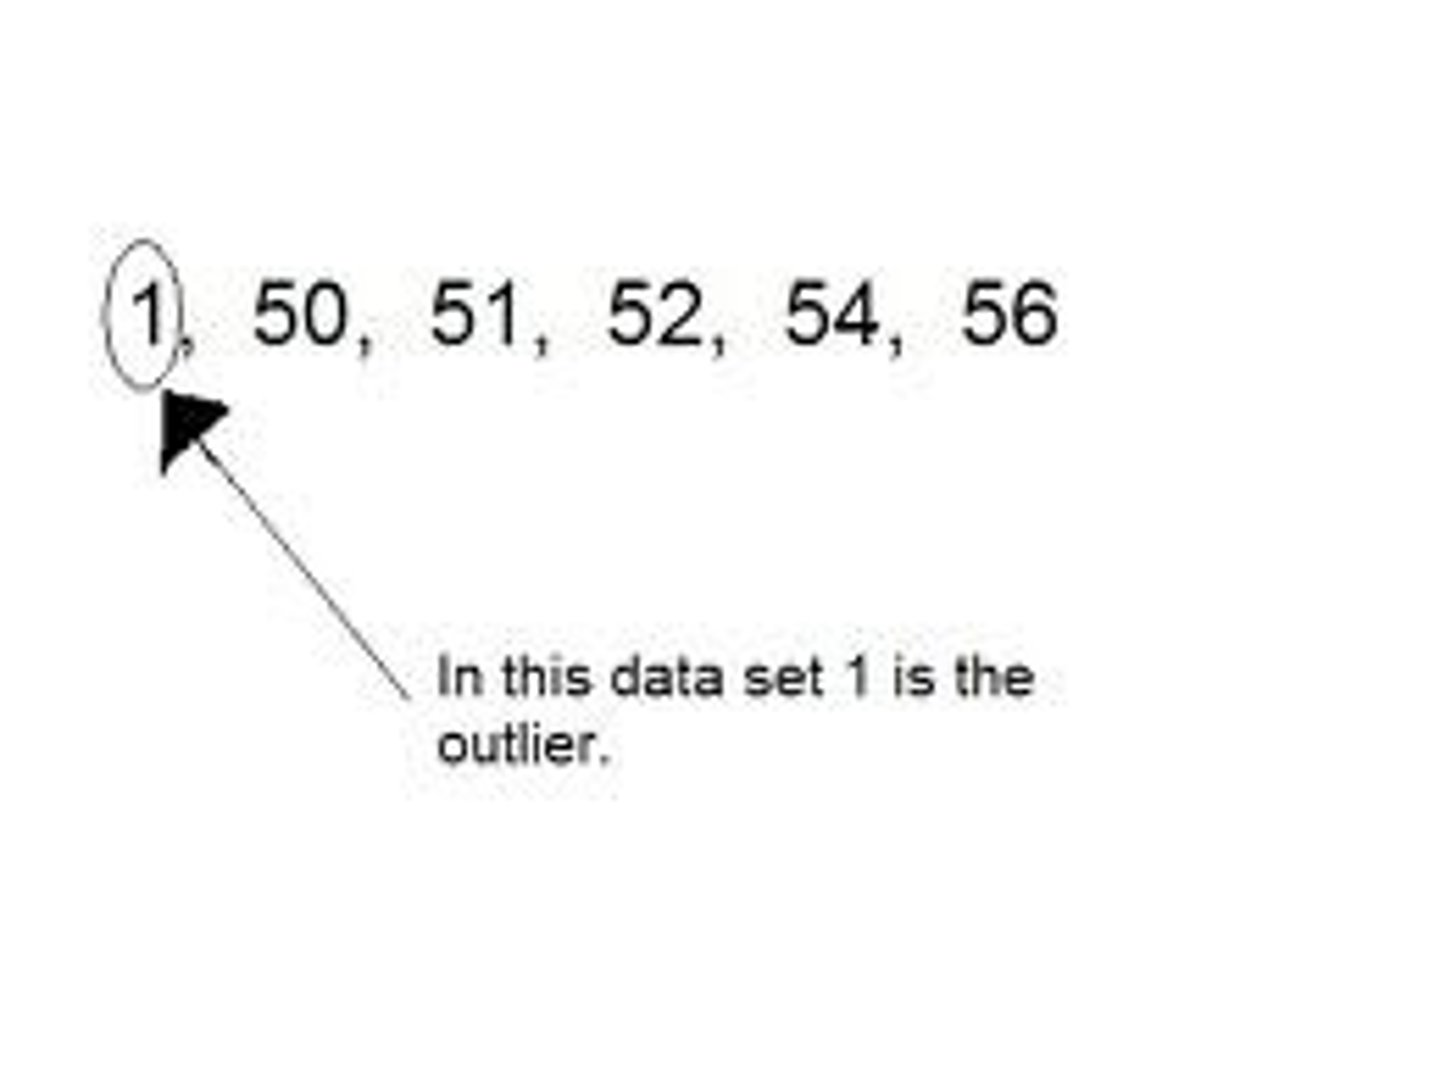
Outliers
- can represent rare but significant cases or errors.
- must be handled carefully in psychology.
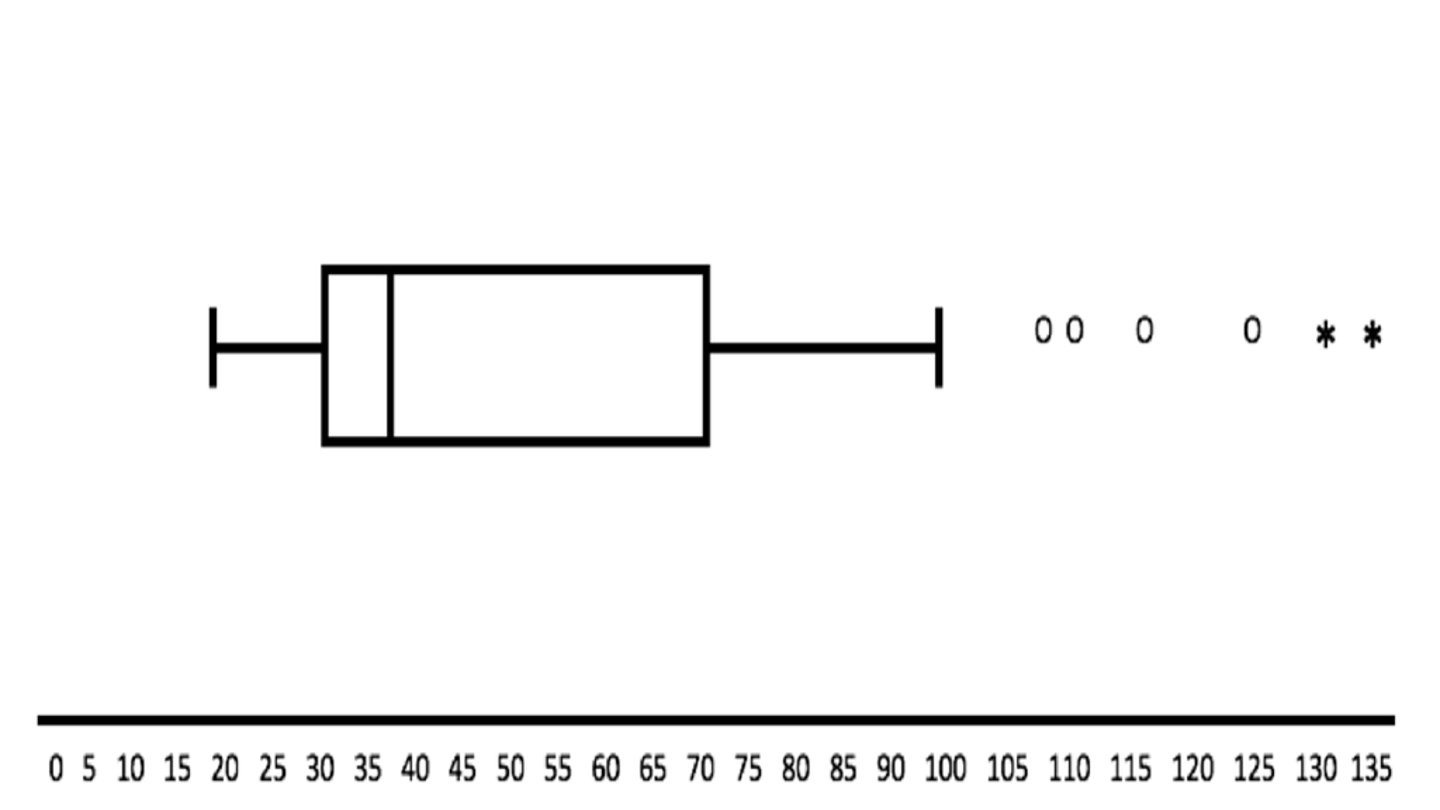
Extreme outliers
are identified in much the same way but the interquartile range is multiplied by 3 (rather than 1.5)
SPREAD/VARIABILITY/DISPERSION
- How "spread out" or clustered a group of scores is?
- are developed which include the extent to which each of the scores in the set differs from the mean score of the set.
measures of variability
describe how scores in a given dataset differ from one another
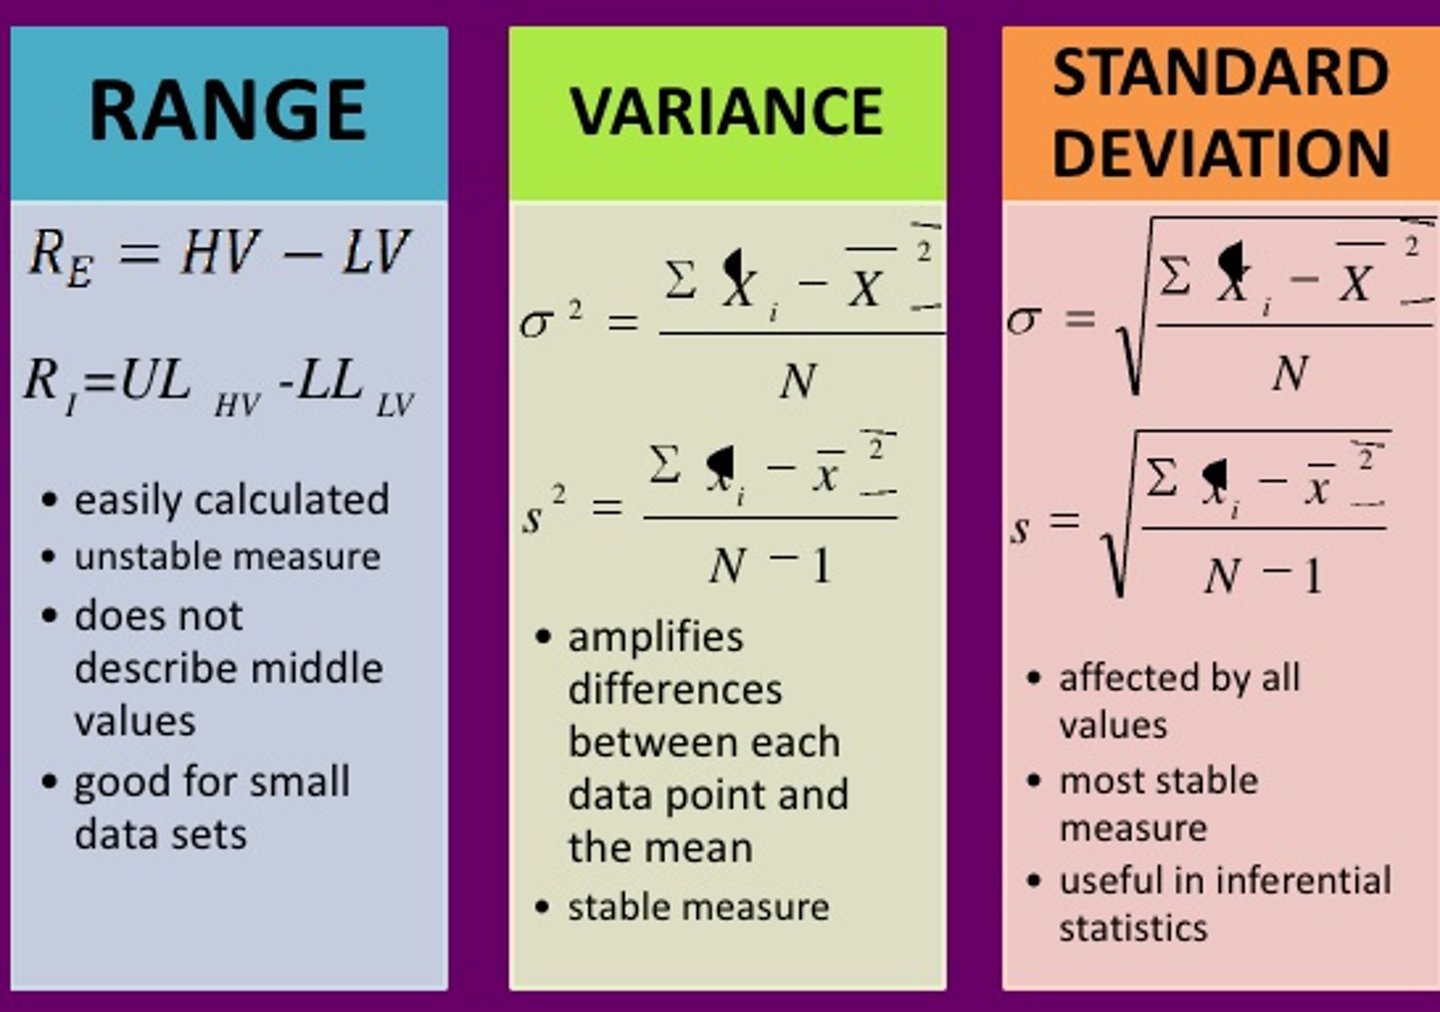
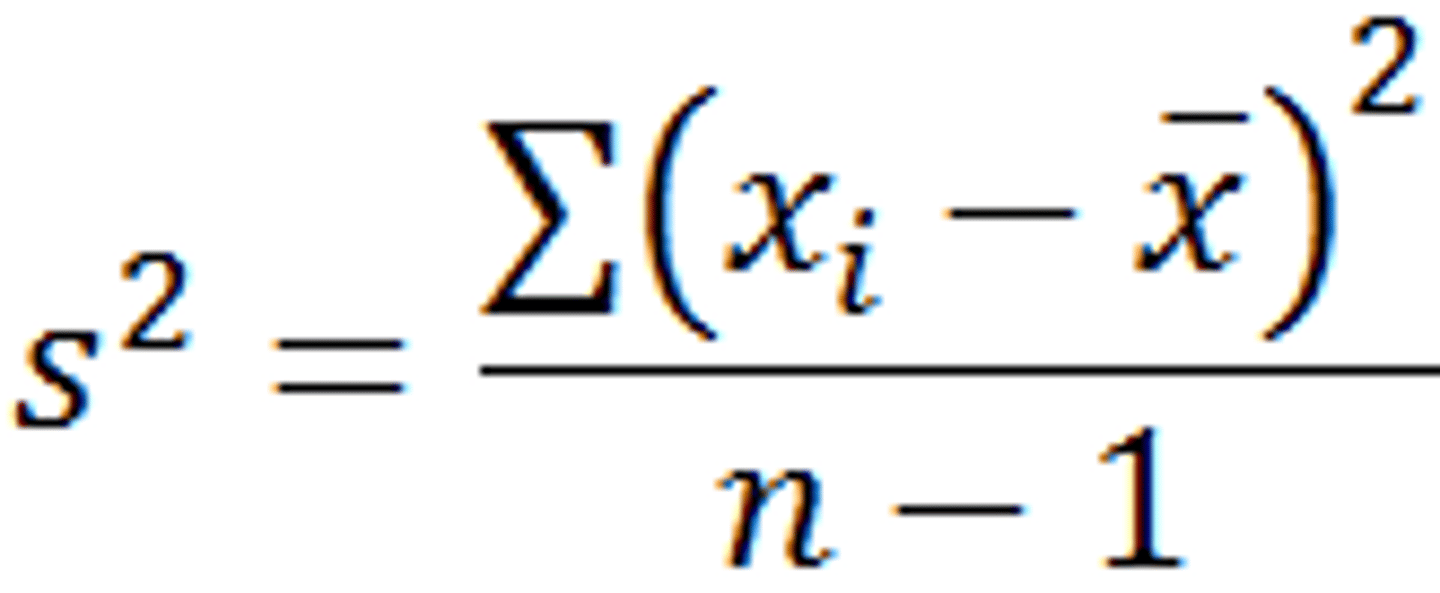
VARIANCE
Calculated like the mean deviation, but we square each deviation from the mean before summing the total of these squared
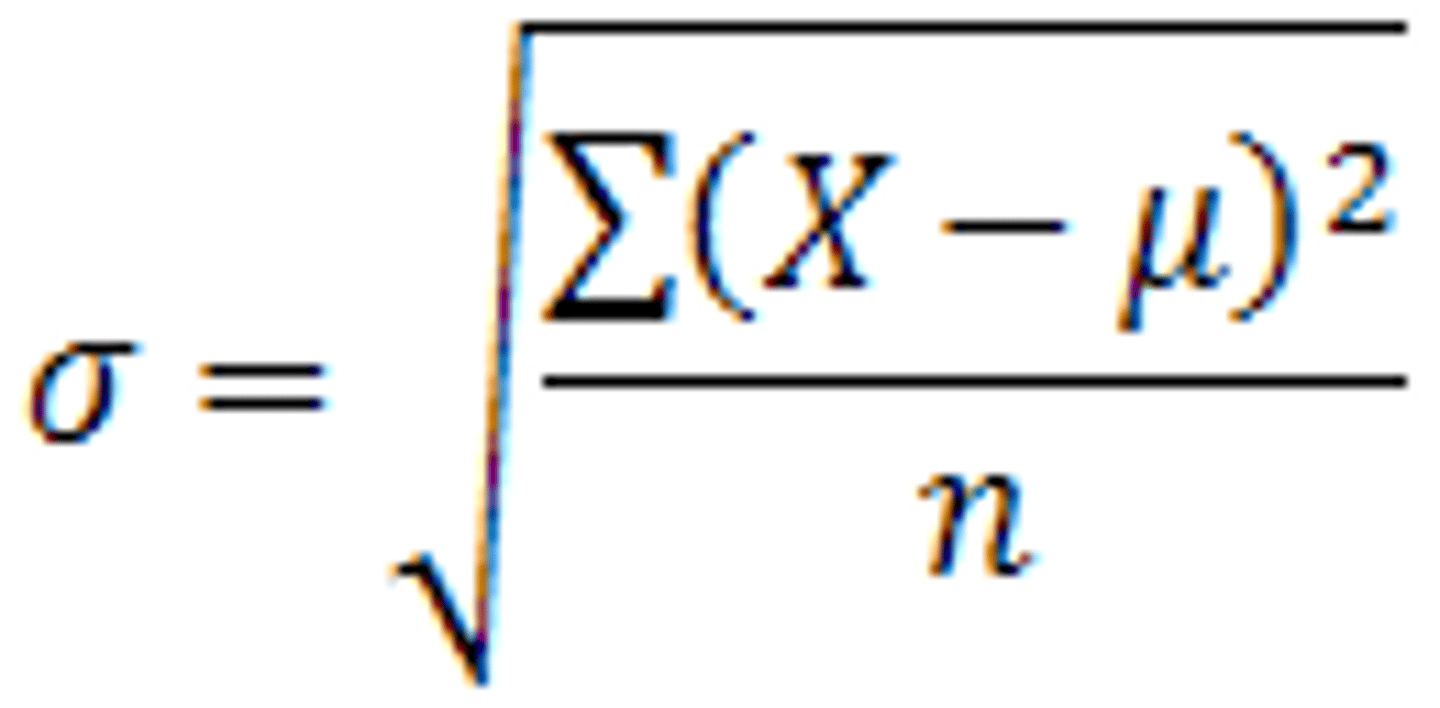
STANDARD DEVIATION
To get back to the original units (e.g., seconds, scores), you take the square root
Low variance
→ most participants have very similar reaction times.
High variance
→ some are very fast, some are very slow
→ might indicate different strategies, attention issues, or outliers.
Estimated variance
is your best guess of the variance of the population if you only have the data from a small set of scores.