EDA CHAP3
 Call Kai
 Learn
Learn Practice Test
 Spaced Repetition
 Match
Match Flashcards
 Knowt Play
1/22

There's no tags or description
Looks like no tags are added yet.
Name | Mastery | Learn | Test | Matching | Spaced | Call with Kai | Chat |
|---|
No analytics yet
Send a link to your students to track their progress
23 Terms
discrete distribution
describes the probability of occurrence of each value of a discrete random variable
discrete random variable
is a random variable that has countable values, such as a list of non-negative integers.
discrete probability distribution
each possible value of the discrete random variable can be associated with a non-zero probability. Thus, it is often presented in tabular form.
random variable
is a variable whose value is subject to variations due to chance (i.e. randomness, in a mathematical sense). As opposed to other mathematical variables, a ——- conceptually does not have a single, fixed value (even if unknown); rather, it can take on a set of possible different values, each with an associated probability
Probability Histogram:
This histogram displays the probabilities of each of the three discrete random variables. The formula, table, and probability histogram satisfy the following necessary conditions of discrete probability distributions:
Probability Mass Function
This shows the graph of a probability mass function. All the values of this function must be non-negative and sum up to 1.
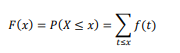
Cumulative Distribution Functions
discrete
random variable is one whose set of possible values is finite.
continous
random variable is one that can assume values on a continuous scale.
PROABILITY DISTRIBUTION OF DISCRETE RANDOM VARAIBLES
A probability distribution is a formula or a table listing of all possible values that a random variable can take on. This is the theoretical counterpart of frequency distribution.
COMULATIVE DISTRIBUTION FUNCTION (CDF)
Total probility of all values up to and including a given number.
Cumulative probabilities
, P(X <= x) where X still represents the random variable and x now represents an upper ilmit, are found by adding individual probabilities.
EXPECTED VALUES OF RANDOM VARIABLES
X, denoted by E(X), is equal to the weighted average of the elements x in the support S, where each element is weighted by its respective probability. Use the following formula:
binomial experiment
is a statistical experiment that has the following properties:
binomial random variable
the number of successes x in n repeated trials of a binomial experiment
binomial distribution
The probability distribution of a binomial random variable is called a ——-
binomial probability
refers to the probability that a binomial experiment results in exactly x successes
Cumulative Binomial Probability
refers to the probability that the binomial random variable falls within a specified range (e.g., is greater than or equal to a stated lower limit and less than or equal to a stated upper limit).
Poisson distribution
is the probability distribution that results from a Poisson experiment.
Poisson experiment
is a statistical experiment that has the following properties:
The experiment results in outcomes that can be classified as successes or failures.
The average number of successes (μ) that occurs in a specified region is known.
The probability that a success will occur is proportional to the size of the region.
The probability that a success will occur in an extremely small region is virtually zero
Poisson random variable
is the number of successes that result from a Poisson experiment.
Poisson distribution
The probability distribution of a Poisson random variable is called a ——
cumulative Poisson probability
refers to the probability that the Poisson random variable is greater than some specified lower limit and less than some specified upper limit.