med neuro figures 1
 Call Kai
 Learn
Learn Practice Test
 Spaced Repetition
 Match
Match Flashcards
 Knowt Play
1/27

There's no tags or description
Looks like no tags are added yet.
Name | Mastery | Learn | Test | Matching | Spaced | Call with Kai | Chat |
|---|
No analytics yet
Send a link to your students to track their progress
28 Terms

Immunohistochemistry reveals key neuroanatomical features. Shown here is a section through a mouse retina, processed with fluorescent antibodies. Cone photoreceptors are stained with an antibody against cone arrestin (purple). Amacrine, horizontal, and retinal ganglion cells are stained with anti-calbindin (orange/red). Bipolar cells fluoresce in green because the bipolar cells in this particular transgenic mouse strain express green fluorescent protein.
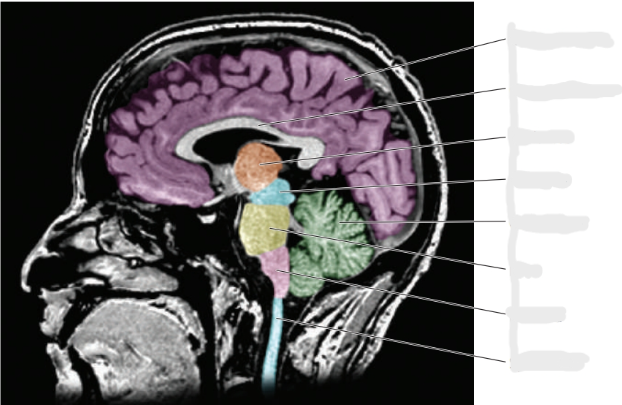
Answers:
Corpus callosum
Cerebellum
Pons
Cerebral cortex
Thalamus
Spinal cord
Medulla
Midbrain


The benefits of cortical folding. Shown here is what would happen to a human brain if you inflated it and, thus, smoothed the neocortical folds (gyri are green, sulci are red). As you can see, the inflated brain would take up more volume and, therefore, be more difficult to fit into a skull. The white labels indicate major sulci and the insula, a cortical region that is normally hidden from view by the temporal lobe.

Answers:
Frontal lobe
Occipital lobe
Temporal lobe
Parietal lobe


Cell body
Postsynaptic cell
Myelin sheath
Axon collateral
Axon
Dendrite
Synapse


Primary dendrite
Cell body
Secondary dendrite
Terminal arborizations
Axon
Axon collateral
Axon hillock


Intracellular recording. Shown at the top is the cell body of a neuron being probed with an intracellular recording electrode. The graph depicts an intracellular recording that reveals a neuron’s membrane potential at rest and during two action potentials

The sodium–potassium pump. The drawing shows how an Na/K-ATPase (red circle) pumps sodium ions out of the axons and potassium ions in. The process consumes metabolic energy provided by ATP.

The role of potassium in setting the membrane potential. Hodgkin and Horowicz systematically varied the [K+] outside of a frog muscle fiber and found that the fiber’s membrane potential became less negative as extracellular [K+] increased. The data match what one would predict on the basis of the Nernst equation for K+ (blue line) except at very low concentrations of K+, when the membrane’s permeability to Na+ comes into play.

Patch clamp recording. When a glass pipette connected to an amplifier is placed directly onto a cell membrane, a small patch of membrane can be electrically isolated. The electrical seal may be on the order of megaohms (A) or, after mild suction, multiple gigaohms (B). After formation of a gigaohm seal (a gigaseal), the noise of the recording is dramatically reduced (C), allowing the experimenters to record with greater clarity the currents associated with the opening of single ion channels (D vs. E). The brief downward deflections (blips) in the recording traces represent depolarizing currents flowing through an open ion channel, which in this case is an activated acetylcholine receptor on a frog muscle fiber.

Phases of the action potential. The neuronal membrane at rest is relatively impermeable to Na+, but some K+ flows out; this keeps the membrane near its resting potential of -65 mV. During the rising phase of the action potential the membrane becomes highly permeable to Na+ and much more permeable to K+. This causes K+ to rush out of , which rushes down its concentration gradient into the axon and thus depolarizes it to approximately +40 mV. Next comes the falling phase, during which the membrane becomes less permeable to Na+ the cell, repolarizing it to a level near the equilibrium potential for K+ (approximately -80 mV). Soon thereafter, K+ permeability returns to its resting level. When the membrane potential is more negative than its resting value, it is said to be hyperpolarized; this period is called the action potential undershoot.

Action potential propagation. Action potentials travel along axons because the massive influx of Na+ ions at one location of the axonal membrane tends to trigger Na+ influx at adjacent locations, as long as those sites are not in the action potential’s wake (refractory). The top, middle, and bottom panels in this figure illustrate successive time points. The plus and minus signs represent ionic charges that have accumulated on either side of the axonal membrane (a plus on the inside indicates depolarization). The red arrows indicate ion flow. The graphs on the right show how membrane voltage varies along the length of the illustrated axons

Factors that influence conduction velocity. The speed at which action potentials travel down an axon increases with axon diameter. This rule holds for both myelinated and unmyelinated axons, but the rate at which conduction velocity increases with axon diameter is significantly faster for myelinated axons than for unmyelinated ones.
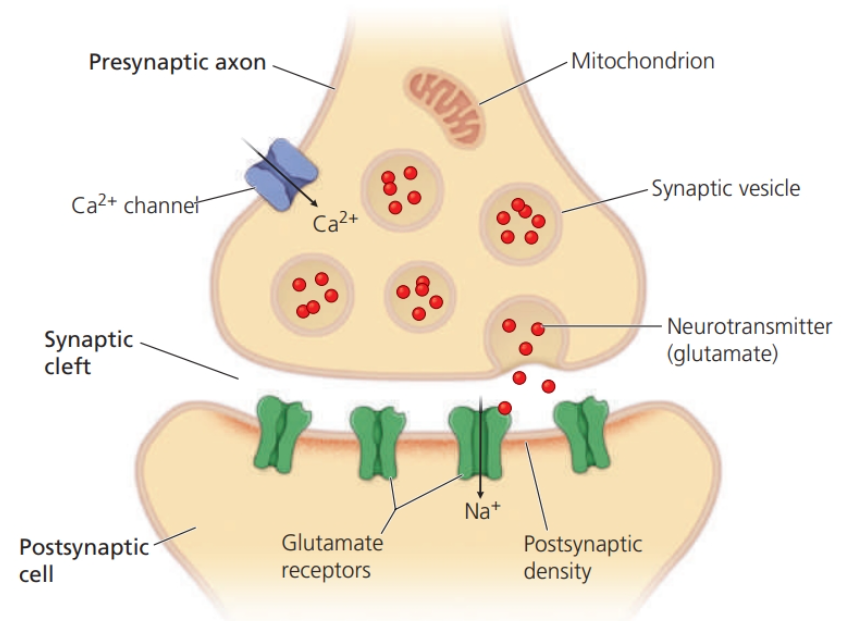
A synapse using glutamate. When an action potential comes down an axon, Ca2+ ions flow into the presynaptic terminal. This causes synaptic vesicles in the terminal to move toward the synaptic cleft and release glutamate. When glutamate binds to a postsynaptic glutamate receptor (of the AMPA type), the receptor allows Na+ ions to flow through its central pore into the postsynaptic cell.

Integrate-and-fire devices. According to the integrate-and-fire model (A), neurons sum their inputs and then “fire” action potentials only if this sum exceeds a threshold. Because EPSPs typically last for many milliseconds (are broad), they overlap and sum even if they are not precisely coincident (B). Some neurons exhibit relatively brief (narrow) EPSPs (C), allowing them to function as precise coincidence detectors.

Ionotropic versus metabotropic receptors. Ionotropic receptors (top) let ions flow through their central pore when a transmitter is bound to them. In contrast, metabotropic receptors (bottom) do not contain an ion-passing pore. When metabotropic receptors are activated by a neurotransmitter, they activate enzymes that generate second messenger molecules which in turn can open or close nearby ion channels.

A neuronal response profile. Panel (A) shows extracellular recordings from a single neuron as it responds to an 8-ms long stimulus on 5 consecutive trials. Shown in (B) is a peri-stimulus time histogram (PSTH) of the spikes recorded during those trials. You can see that the spike rate increases during the stimulus. Panel (C) depicts four separate PSTHs that summarize the responses of a single neuron to 4 different stimuli. The neurons responds most strongly to stimulus #2 and is inhibited by stimulus #3. These variations in response strength are summarized in (D) as a “response profile,” which is simply a histogram of the neuron’s response to each of the presented stimuli

Blocking long-term sensitization. Repeatedly puffing serotonin onto the synapses between Aplysia sensory and motor neurons (a) increases EPSP amplitude 24 hours later. When the same experiment is performed after injecting CRE oligonucleotides into the cell body of the sensory neuron (B), long-term sensitization is blocked, presumably because the oligonucleotides bind to the CREB proteins and prevent them from binding to the DNA.
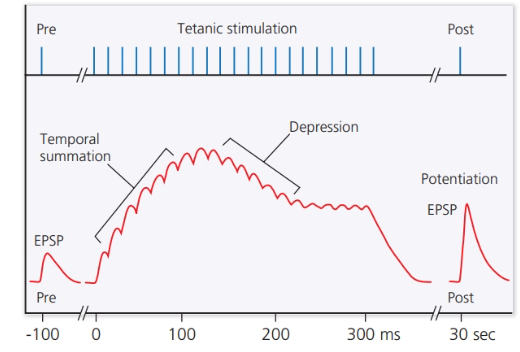
Effects of tetanic stimulation. In this idealized experiment, a series of electrical stimuli (blue vertical lines) is applied to an axon that synapses onto a neuron, whose responses are recorded intracellularly (red traces). During repetitive high-frequency (tetanic) stimulation the membrane potential increases because of temporal summation and then decreases as the presynaptic cell runs low on releasable transmitter. However, 30 seconds after the end of the tetanic stimulus, EPSP amplitude is larger than it had been before the tetanic stimulation, revealing post-tetanic potentiation.

Long-term potentiation (LTP). Bliss and Lømo (1973) recorded synaptic responses in the dentate gyrus of a rabbit’s hippocampus while applying four high-frequency (tetanic) trains of electrical stimuli to the perforant path. Already after the first tetanic stimulus, EPSP amplitude increased almost 100%.

The NMDA receptor as a molecular trigger for LTP. If the post-synaptic membrane is near its resting potential (A), then NMDA receptors are blocked by magnesium (Mg2+) ions. These ions are dislodged when the post-synaptic cell is strongly depolarized (B). Once the magnesium block is gone, Na+ and Ca2+ ions can flow through the NMDA receptor when glutamate is bound. An increase in postsynaptic calcium then triggers an intracellular signaling cascade that ultimately leads to the insertion of additional AMPA receptors into the post-synaptic membrane, which strengthens the synapse.

Long-term depression (LTD) in the cerebellum. Panel (A) depicts the climbing and parallel fiber inputs to a cerebellar Purkinje cell. Graph (B) shows that repetitive coincident stimulation of the parallel and climbing fiber (PF and CF, respectively) inputs leads to a persistent decrease in the strength of the stimulated parallel fiber-Purkinje cell synapses. This synaptic weakening is called long-term depression.

Spike timing-dependent plasticity. Scientists discovered that whether the synapses between two cultured hippocampal neurons are strengthened (potentiation) or weakened (depression) depends on the relative timing of presynaptic stimulation and postsynaptic depolarization.

Synaptic scaling. Excitatory postsynaptic currents (EPSCs) were recorded from voltage-clamped cortical neurons maintained in cell culture (downward deflections indicate depolarizing current). After 48 hours of exposure to tetrodotoxin (TTX), which eliminates all action potentials, average EPSC amplitude was increased dramatically. In contrast, after blocking GABA receptors for 48 hours, EPSC amplitudes decreased. Thus, the neurons scale their responses to glutamate release up or down, depending on how much they have been firing.

Learning-related plasticity in the auditory cortex. Thirsty rats were trained to press a bar for water whenever they heard a 6 khz tone. The experimenters then compared the stimulus preferences of neurons in the primary auditory cortex of naïve (untrained) and trained rats (a). They found that the cortical territory containing neurons tuned to frequencies near 6 khz (green zones) had expanded in the trained rats, relative to naïve rats, whereas the territory dedicated to higher frequencies (yellow to red shading) had shrunk. A quantitative summary is shown in (B).

Environmental enrichment effects. Total brain and cerebral cortex mass are increased in rats that grew up in an enriched environment with access to various “toys,” interactions with other rats, and daily maze training (A). Rats in the “deprived” comparison group are housed individually in standard rat cages (no toys). Panel (B) demonstrates that environmental enrichment decreases cortical neuron density without changing synapse density. Therefore, the number of synapses per neuron is increased. Rats housed with other rats but without toys or daily training (the “social” condition) exhibit only weak enrichment effects.

Brain
Dura mater
Periosteum
Arachnoid
Pia mater
Scalp
Sub-arachnoid space
Skull
