Psych Assessment
1/88
There's no tags or description
Looks like no tags are added yet.
Name | Mastery | Learn | Test | Matching | Spaced | Call with Kai | Chat |
|---|
No analytics yet
Send a link to your students to track their progress
89 Terms
Reliability
extent to which a method yields the same results under similar conditions
Reliability
Dependability or consistency
Reliability Coefficient
statistic that quantifies reliability, ranging from 0 to 1
Reliability
refers to the proportion of total variance attributed to true variance
Reliability
Precedes validity; without this, a test cannot be valid
1.0
Perfect Reliability
1.0
This reliability range may indicate redundancy/homogeneity
≥ 0.9
Excellent Reliability
≥ 0.9
Minimum reliability range for clinical setting
≥ 0.8 < 0.9
Good Reliability
≥ 0.7 < 0.8
Acceptable Reliability
≥ 0.7 < 0.8
minimum reliability range for psychometric tests
≥ 0.6 < 0.7
Questionable Reliability
≥ 0.6 < 0.7
Acceptable reliability range for research
≥ 0.5 < 0.6
Poor Reliability
< 0.5
Unacceptable Reliability
0.0
No Reliability
True Score
Measurement of a quantity if there were no measurement error at al
True Score
Its approximate can be identified by averaging measurements
True score
Can never be observed directly
Carryover Effects
Measurement process that alter what is measured
Practice Effects
test itself provides an opportunity to learn and practice the ability being measured (increase of score due to test taker)
Test Sophistication
increase of score due to the test
Fatigue Effects
repeated testing reduces overall mental energy or motivation to perform on a test
Construct Score
person’s standing on a theoretical variable independent of any particular measurement
Variance
useful in describing sources of test score variability; the standard deviation squared
True Variance
variance from true differences
Error Variance
variance from irrelevant, random sources; may increase or decrease a test score by varying amounts
Bias
degree to which a measure predictably overestimates or underestimates a quantity
Measurement Error
inherent uncertainty associated with any measurement, even after care has been taken to minimize preventable mistakes
Error
refers to the component of the observed test score that does not have to do with the test taker's ability
Random Error
source of error in measuring a targeted variable caused by unpredictable fluctuations and inconsistencies of other variables in the measurement process
Random Error
Affects precision; Temporary and irregular; Do not affect the average score in the long run, but increase variability in scores
noise
This is what random error is also called as
Systematic Error
source of error in measuring a variable that is typically constant or proportionate to what is presumed to be the true value of the variable being measured
Systematic Error
Affects accuracy, this is consistent and predictable and a threat to validity more than to reliability
Systematic Error
This could result to a Type I Error or Type II Error
Increasing the Sample Size
How can we minimize the likelihood of random and systematic error to occur
Test-retest Reliability
Purpose is to evaluate the stability of a measure
2
Number of testing session for test-retest reliability
Test-retest Reliability
Typical uses is when assessing the stability of various personality traits
Administration
Sources of error variance of test-retest relaibility
Pearson r or Spearman rho
The statistical procedures used for test-retest reliability
Time Sampling
Source of error for test-retest reliability
2-4 Weeks
Ideal time in between administration for test-retest reliability
Parallel/Alternate Forms Reliability
evaluates the correlation between 2 different forms of a test
Low Correlation/Reliability
When there is a high interval between tests
Coefficient of Stability
estimate of test-retest reliability when the interval between testing is > 6 months
Coefficient of Equivalence
estimate of alternate-forms or parallel-forms reliability
Parallel Forms Reliability
for each form of the test, the means and the variances of observed test scores are equal; Means of scores obtained on this correlate equally with the true score
Alternate Forms Reliability
different versions of a test that have been constructed so as to be parallel
Alternate Forms Reliability
Typically designed to be equivalent with respect to variables such as content and level of difficulty
Alternate Forms Reliability
Can be time-consuming and expensive
Immediate Form
administered at the same time
Delayed Form
interval between both administrations
Balanced Difficulty and High Internal Consistency
This is what both Parallel Forms Reliability and Alternate Forms Reliability must have
Test construction or Administration
Sources of error variance for Parallel/Alternate Forms Reliability
1 or 2
Number testing sessions for Parallel/Alternate Forms Reliability
Pearson r or Spearman rho
Statistical procedures used for Parallel/Alternate Forms Reliability
Parallel/Alternate Forms Reliability
Typical uses is when there is a need for different forms of a test
Split-Half Reliability
method of internal consistency that correlates 2 pairs of scores obtained from equivalent halves of a single test administered once
Split-Half Reliability
Appropriate when evaluating psychological variables that are more state-like than trait-like
Divide the test into equivalent halves
First step of Split-Half Reliability
Top-Bottom & Odd-Even
2 kinds of division of test for Split-Half Reliability
Top-Bottom
Least reliable division for Split-Half Reliability
Calculate a Pearson r between scores on the two halves of the test
2nd step of Split-Half Reliability
Adjust the half-test reliability using the Spearman–Brown formula
3rd step of Split-Half Reliability
Odd-Even Reliability
assigning odd-numbered items to one half of the test and even-numbered items to the other half
Spearman–Brown Formula
used to estimate internal consistency reliability from a correlation between two halves of a test
Spearman–Brown Formula
Can also be used to estimate the effect of shortening the test on the test’s reliability
High Reliability
In spearman-brown formula, if the length is high this means
Spearman–Brown Formula
could also be used to determine the number of items needed to attain a desired level of reliability
Coefficient Alpha
Also called cronbach’s alpha
Coefficient Alpha
Measure non-dichotomous items
0 to 1 only
The possible range in value for Coefficient Alpha
Coefficient Alpha
Helps answer questions about how similar sets of data are
Coefficient Alpha
Accurately measures internal consistency when multiple loadings are equal
KR-20
Kuder-Richardson Formula measures dichotomous items with varying levels of difficulty
KR-21
Kuder-Richardson Formula measures dichotomous items with uniform level of difficulty (assumes all items are equally difficult)
Average Proportional Distance
measure used to evaluate internal consistency of a test that focuses on the degree of differences that exists between item scores
Average Proportional Distance
Focuses on the degree of difference that exists between item scores
Not connected to the number of items on a measure
Excellent Internal Consistency
APD ≤ 0.2
Average Internal Consistency
0.25 > APD ≥ 0.2
Problems with the Internal Consistency
0.25 (ADP)
Spearman-Brown Formula (half test)
Which measurement tool is this
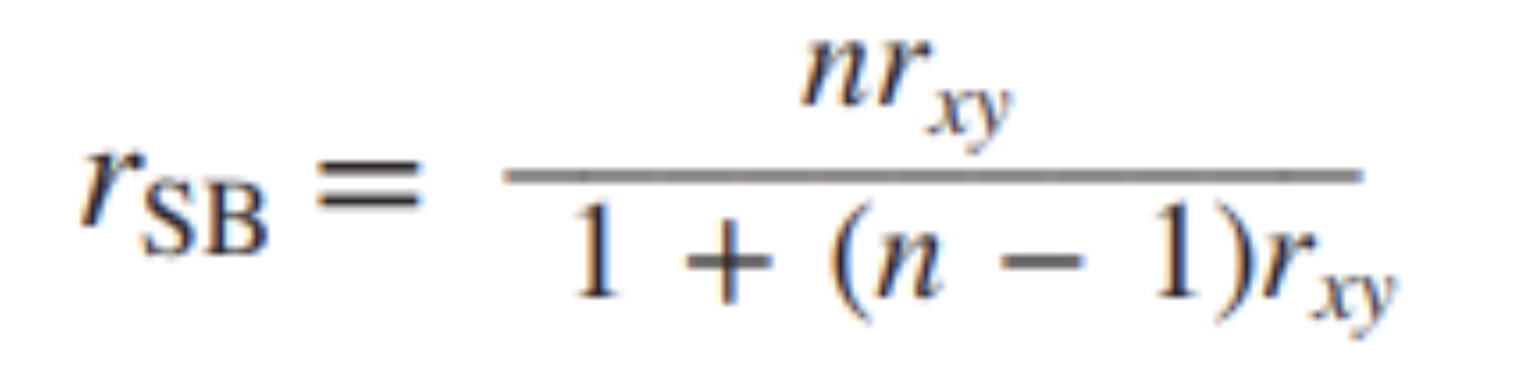
rxy
In this Spearman-Brown Formula (half test), which symbolizes Pearson r in the original-length test

n
In this Spearman-Brown Formula (half test), which symbolizes number of items in the revised version divided by the number of items in the original version

Spearman-Brown Formula (whole test)
measurement tool

rhh
In this Soearman- Brown Formula (whole test) what defines as Pearson r of scores in the two half tests n becomes 2 in this equation
