STATS1- testing for differences between 2 sample means
1/16
There's no tags or description
Looks like no tags are added yet.
Name | Mastery | Learn | Test | Matching | Spaced |
|---|
No study sessions yet.
17 Terms
tests of difference + between subject design
parametric = independent t-test
non-parametric = mann-whitney
tests of difference + within subject design
parametric = paired t-test
non-parametric = wilcoxon
tests of relationship/association + continuous variables
parametric = pearson’s r
non-parametric = spearman’s rho
test of relationship/association + categorical variables
chi-squared
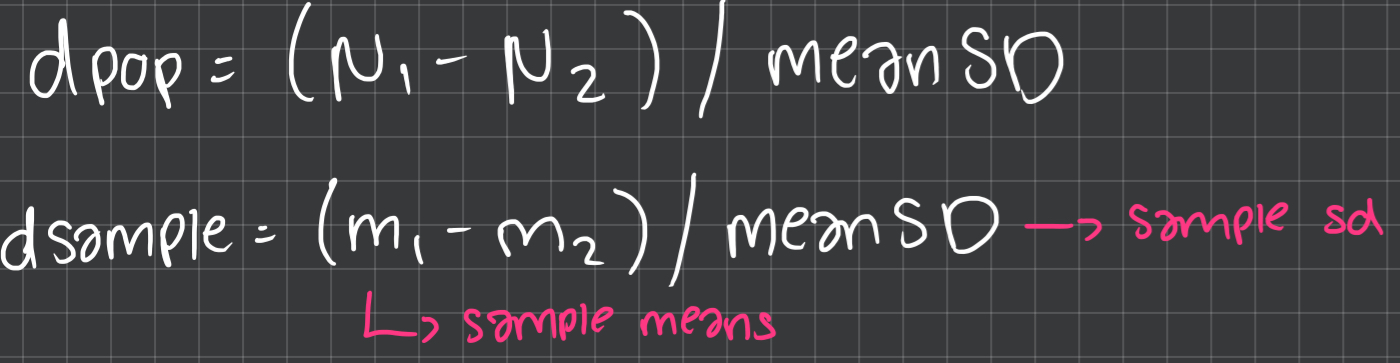
cohen’s d formula (population & sample)
small, medium, large cohen d values
small= 0.2
medium= 0.5
large= 0.8
what does a small cohen’s d value suggest
most chance of overlap so small effect size
what does the null hypothesis suggest for testing differences between 2 means
mean A & mean B are equal
what does the research hypothesis suggest for testing differences between 2 means
mean A > mean B
mean A < mean B
mean A & mean B aren’t equal
what does mean A < mean B mean
difference in sample means is less than 0 (mean A - mean B < 0)
what does mean A > mean B mean
difference in sample means is more than 0 (mean A - mean B > 0)
6 steps for paired t-test
hypothesis
data collection
calculate difference in paired scores between conditions (post-pre)
mean change = mean post - mean pre
reformulate hypothesis (mean change =/< 0)
calculate t-score & convert to critical value
reject or fail to reject null hypothesis
what does it mean is t-score > critical value
p < 0.05
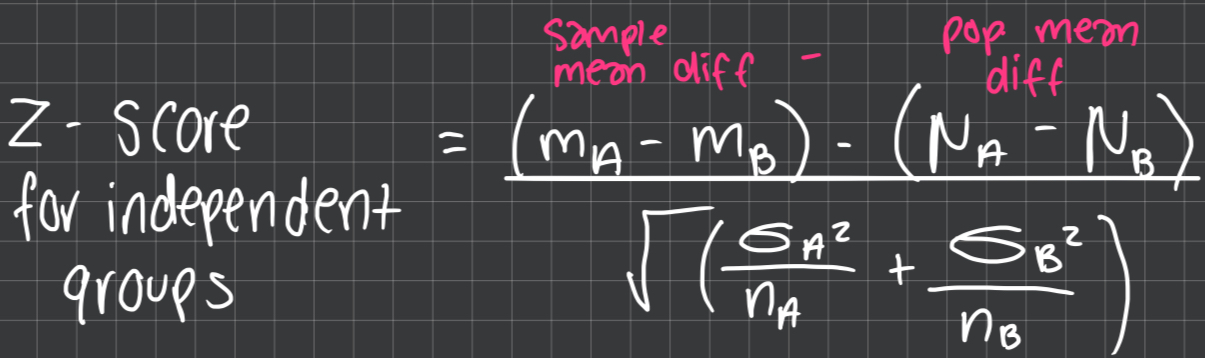
z-score for independent t-test
t-score for independent t-test
bottom = eseA² + eseB²
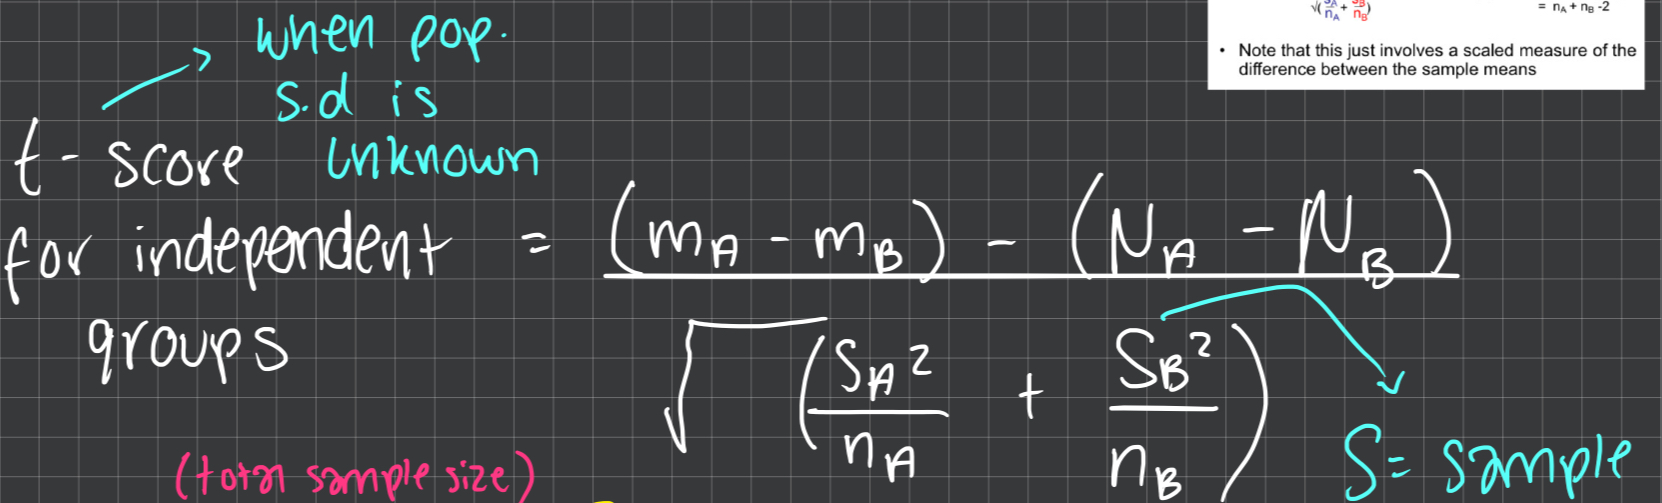
how to work out V for independent t-test
total sample size - 2
4 steps for independent t-test
hypothesis
collect data: mean, sd, ese, n
calculate t-score and assume null hypothesis is true (pop mean diff = 0)
convert t-score to a critical value
reject or fail to reject null hypothesis