Week 2 + Week 3 - Research Design & Analysis + Hypothesis testing
1/38
There's no tags or description
Looks like no tags are added yet.
Name | Mastery | Learn | Test | Matching | Spaced | Call with Kai |
|---|
No analytics yet
Send a link to your students to track their progress
39 Terms
What are the three types of empirical research methods?
Empirical research methods: gather new information in the form of data.
Quantitative methods: numeric data, analysed statistically. e.g., experiments, surveys.
Qualitative methods: descriptive data. e.g., interviews, focus groups, open-ended survey responses.
Mixed methods: combination of both approaches.
What are the 5 steps in conducting empirical research?
Step 1: Observation & Literature Review
Step 2: Aim, Research Question, & Hypotheses
Step 3: Study Design & Operationalisation
Step 4: Ethical Approval & Data Collection
Step 5: Data Analysis & Conclusion
What is a null hypothesis?
Type of statistical hypothesis
H₀ - a statement of nothing - e.g there is no difference
What is an alternative hypothesis?
Type of statistical hypothesis
H₁ - a statement that something has happened, usually the same as the research question e.g there is a difference
How can we describe distributions of data sets?
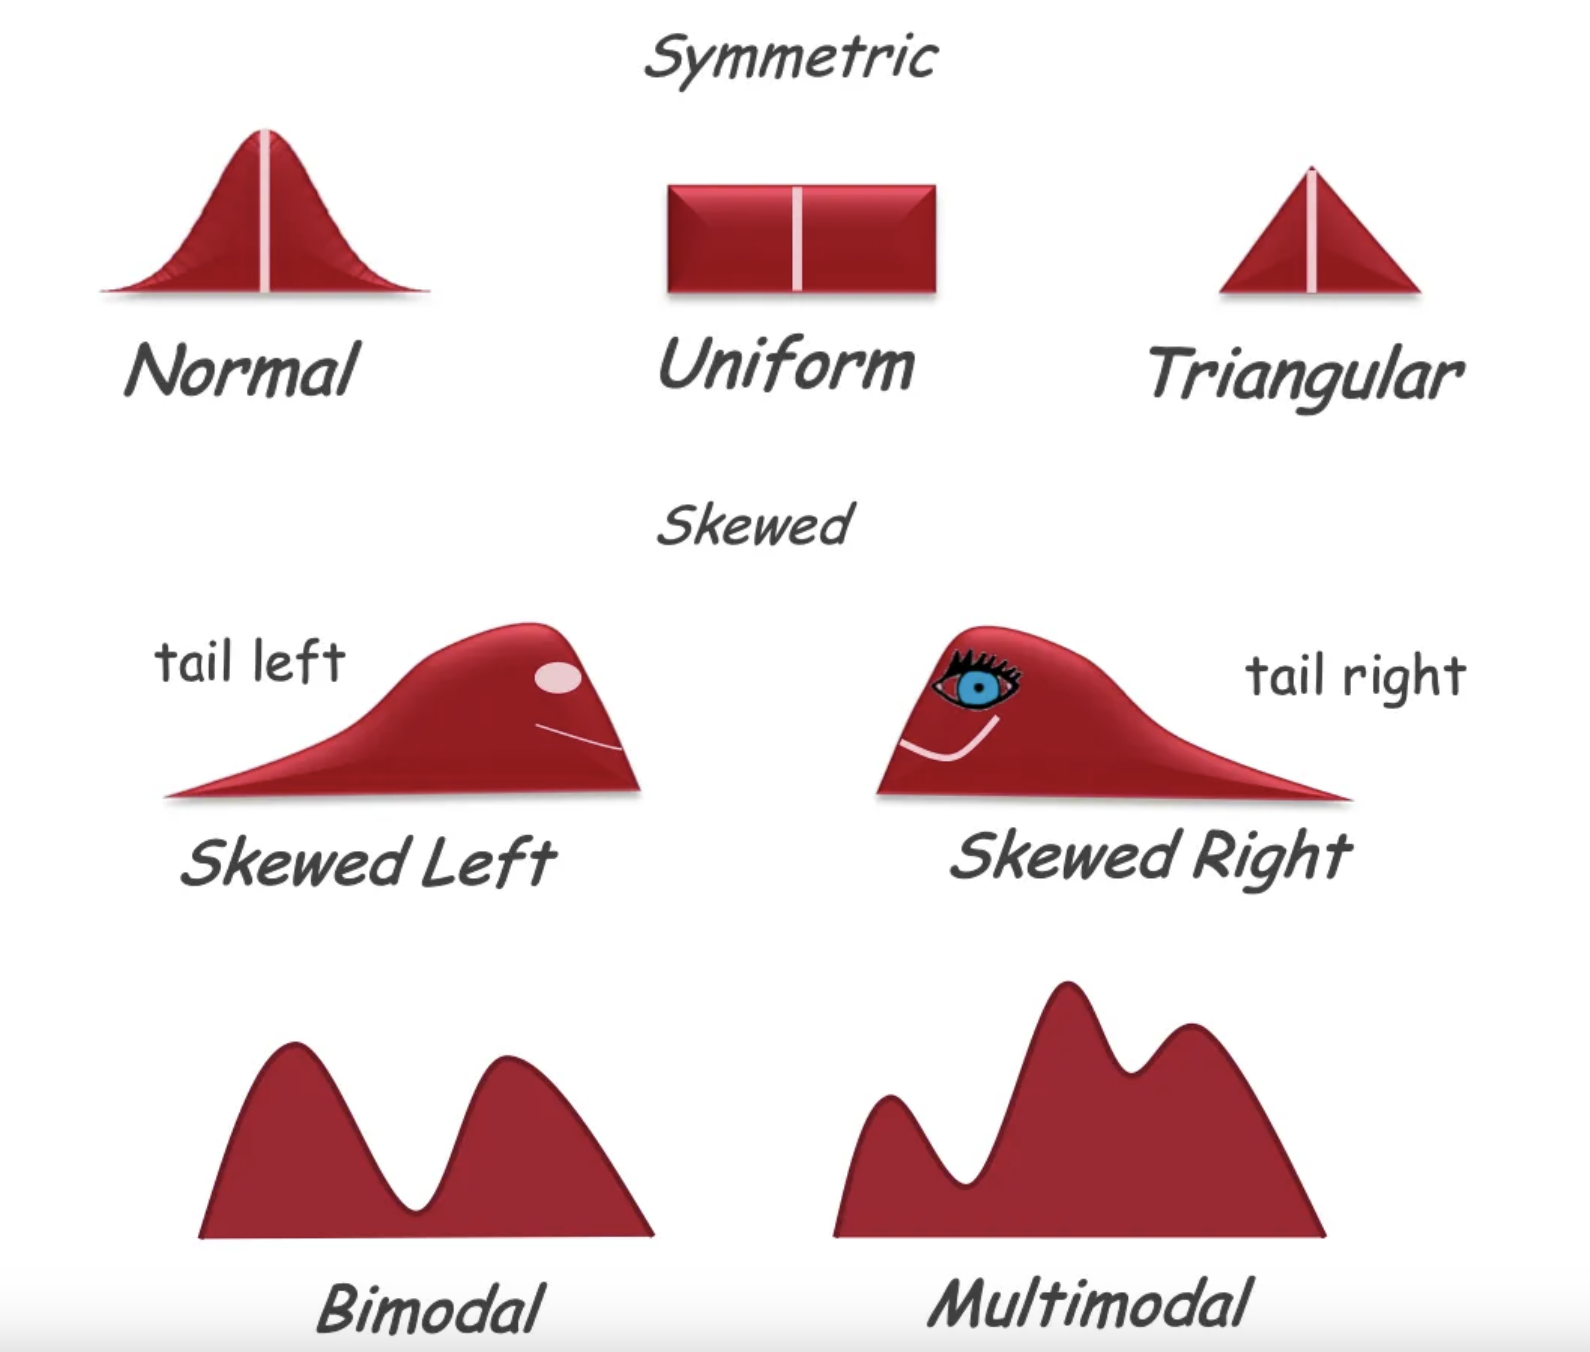
To describe shape, focus on the presence or absence of symmetry, modes and gaps or outliers.
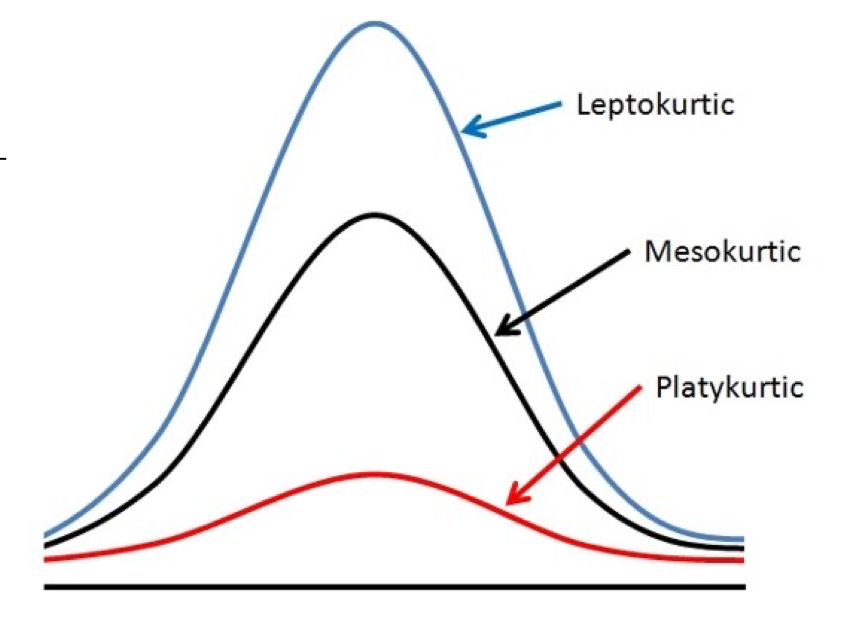
What is Kurtosis in terms of describing distributions of data sets?
Kurtosis describes how “peaky” or flat a distribution is.

What is the mean and how is it calculated?
Average - The sum of the scores divided by the number of scores.
What is the median?
The value in the middle of the sequence. If there are two, you need to average (find the mean) it. They are less affected by outliers than the mean is.
What is the range and how is it calculated?
The difference (or discrepancy) between the largest score and smallest score. Largest score - smallest score = range
The range is influenced (very badly) by outliers
What is the interquartile range?
Incorporates the middle 50% of the data. Here we need to find the lower (first) and upper (third) quartile (the bottom 25% and top 25% of data), so split the sorted data up into 4 equal groups:
145 150 165 170 170 180 195
Interquartile range = 180 – 150 = 30
i.e. there is a 30cm interquartile range in heights among these students (example)
The interquartile range is not influenced by outliers.
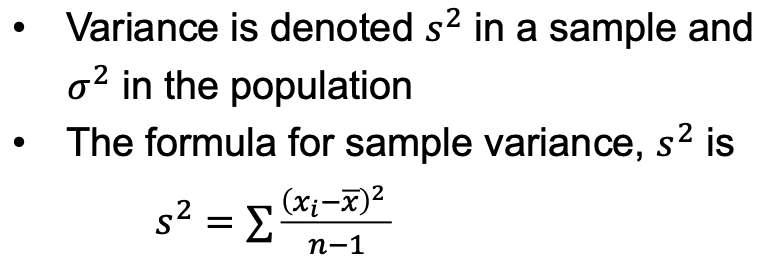
What is variance and how is it calculated?
The average squared deviation (distance or discrepancy) of scores from their mean.
What is standard deviation and how is it measured for sample sizes?
The average distance between the scores and the mean.
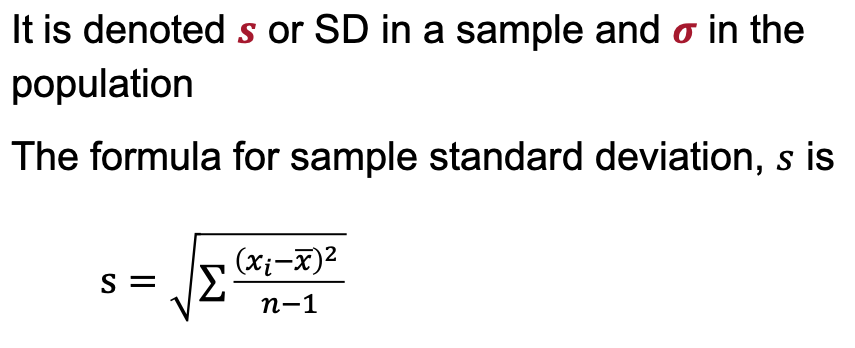
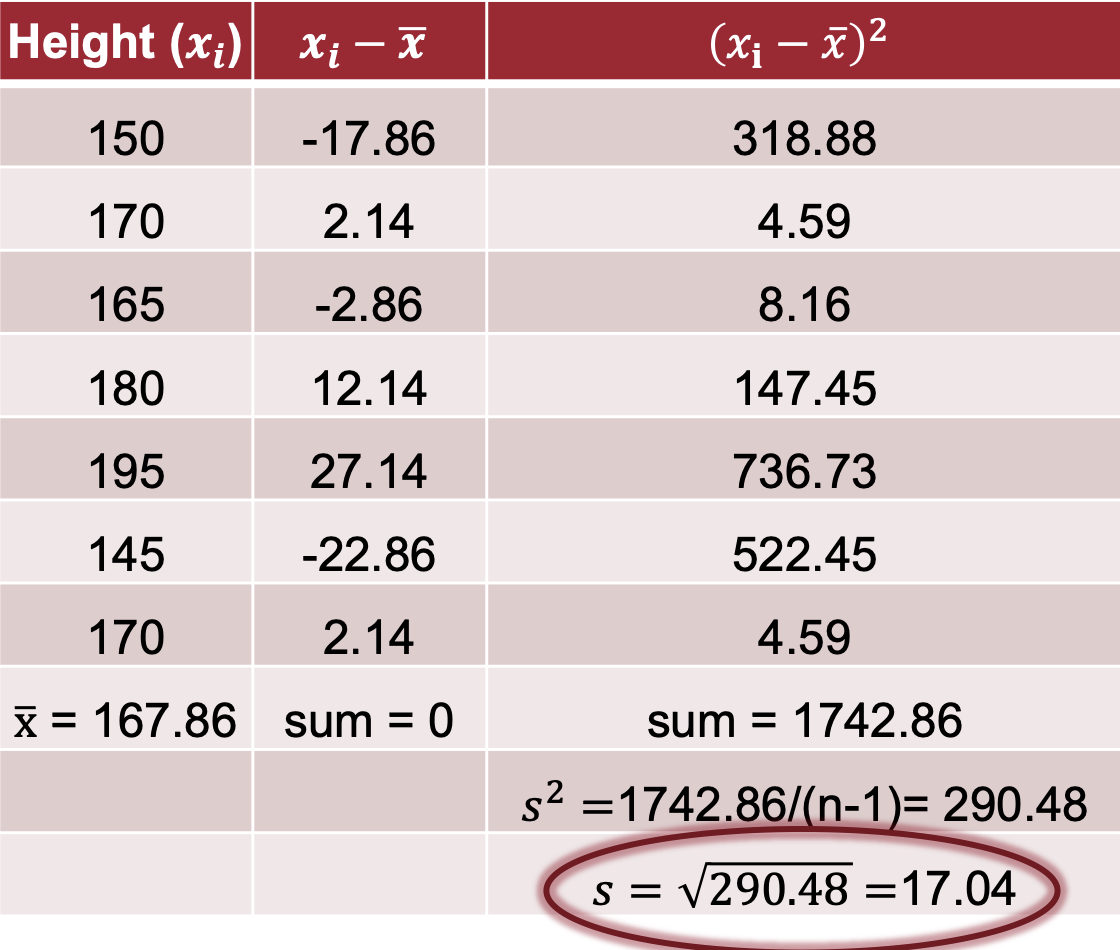
xi = the value
x with the line on top = the mean
n = the sample size
What is the mode and when is it relevant?
The most frequent score; the only measure of central tendency applicable to categorical variables.
What is a frequency table?
A table showing the values of the variable and the frequency of each score:
helps identify the range of scores,
the most and least common scores,
and any extreme scores, usually listing values from highest to lowest and only those present.
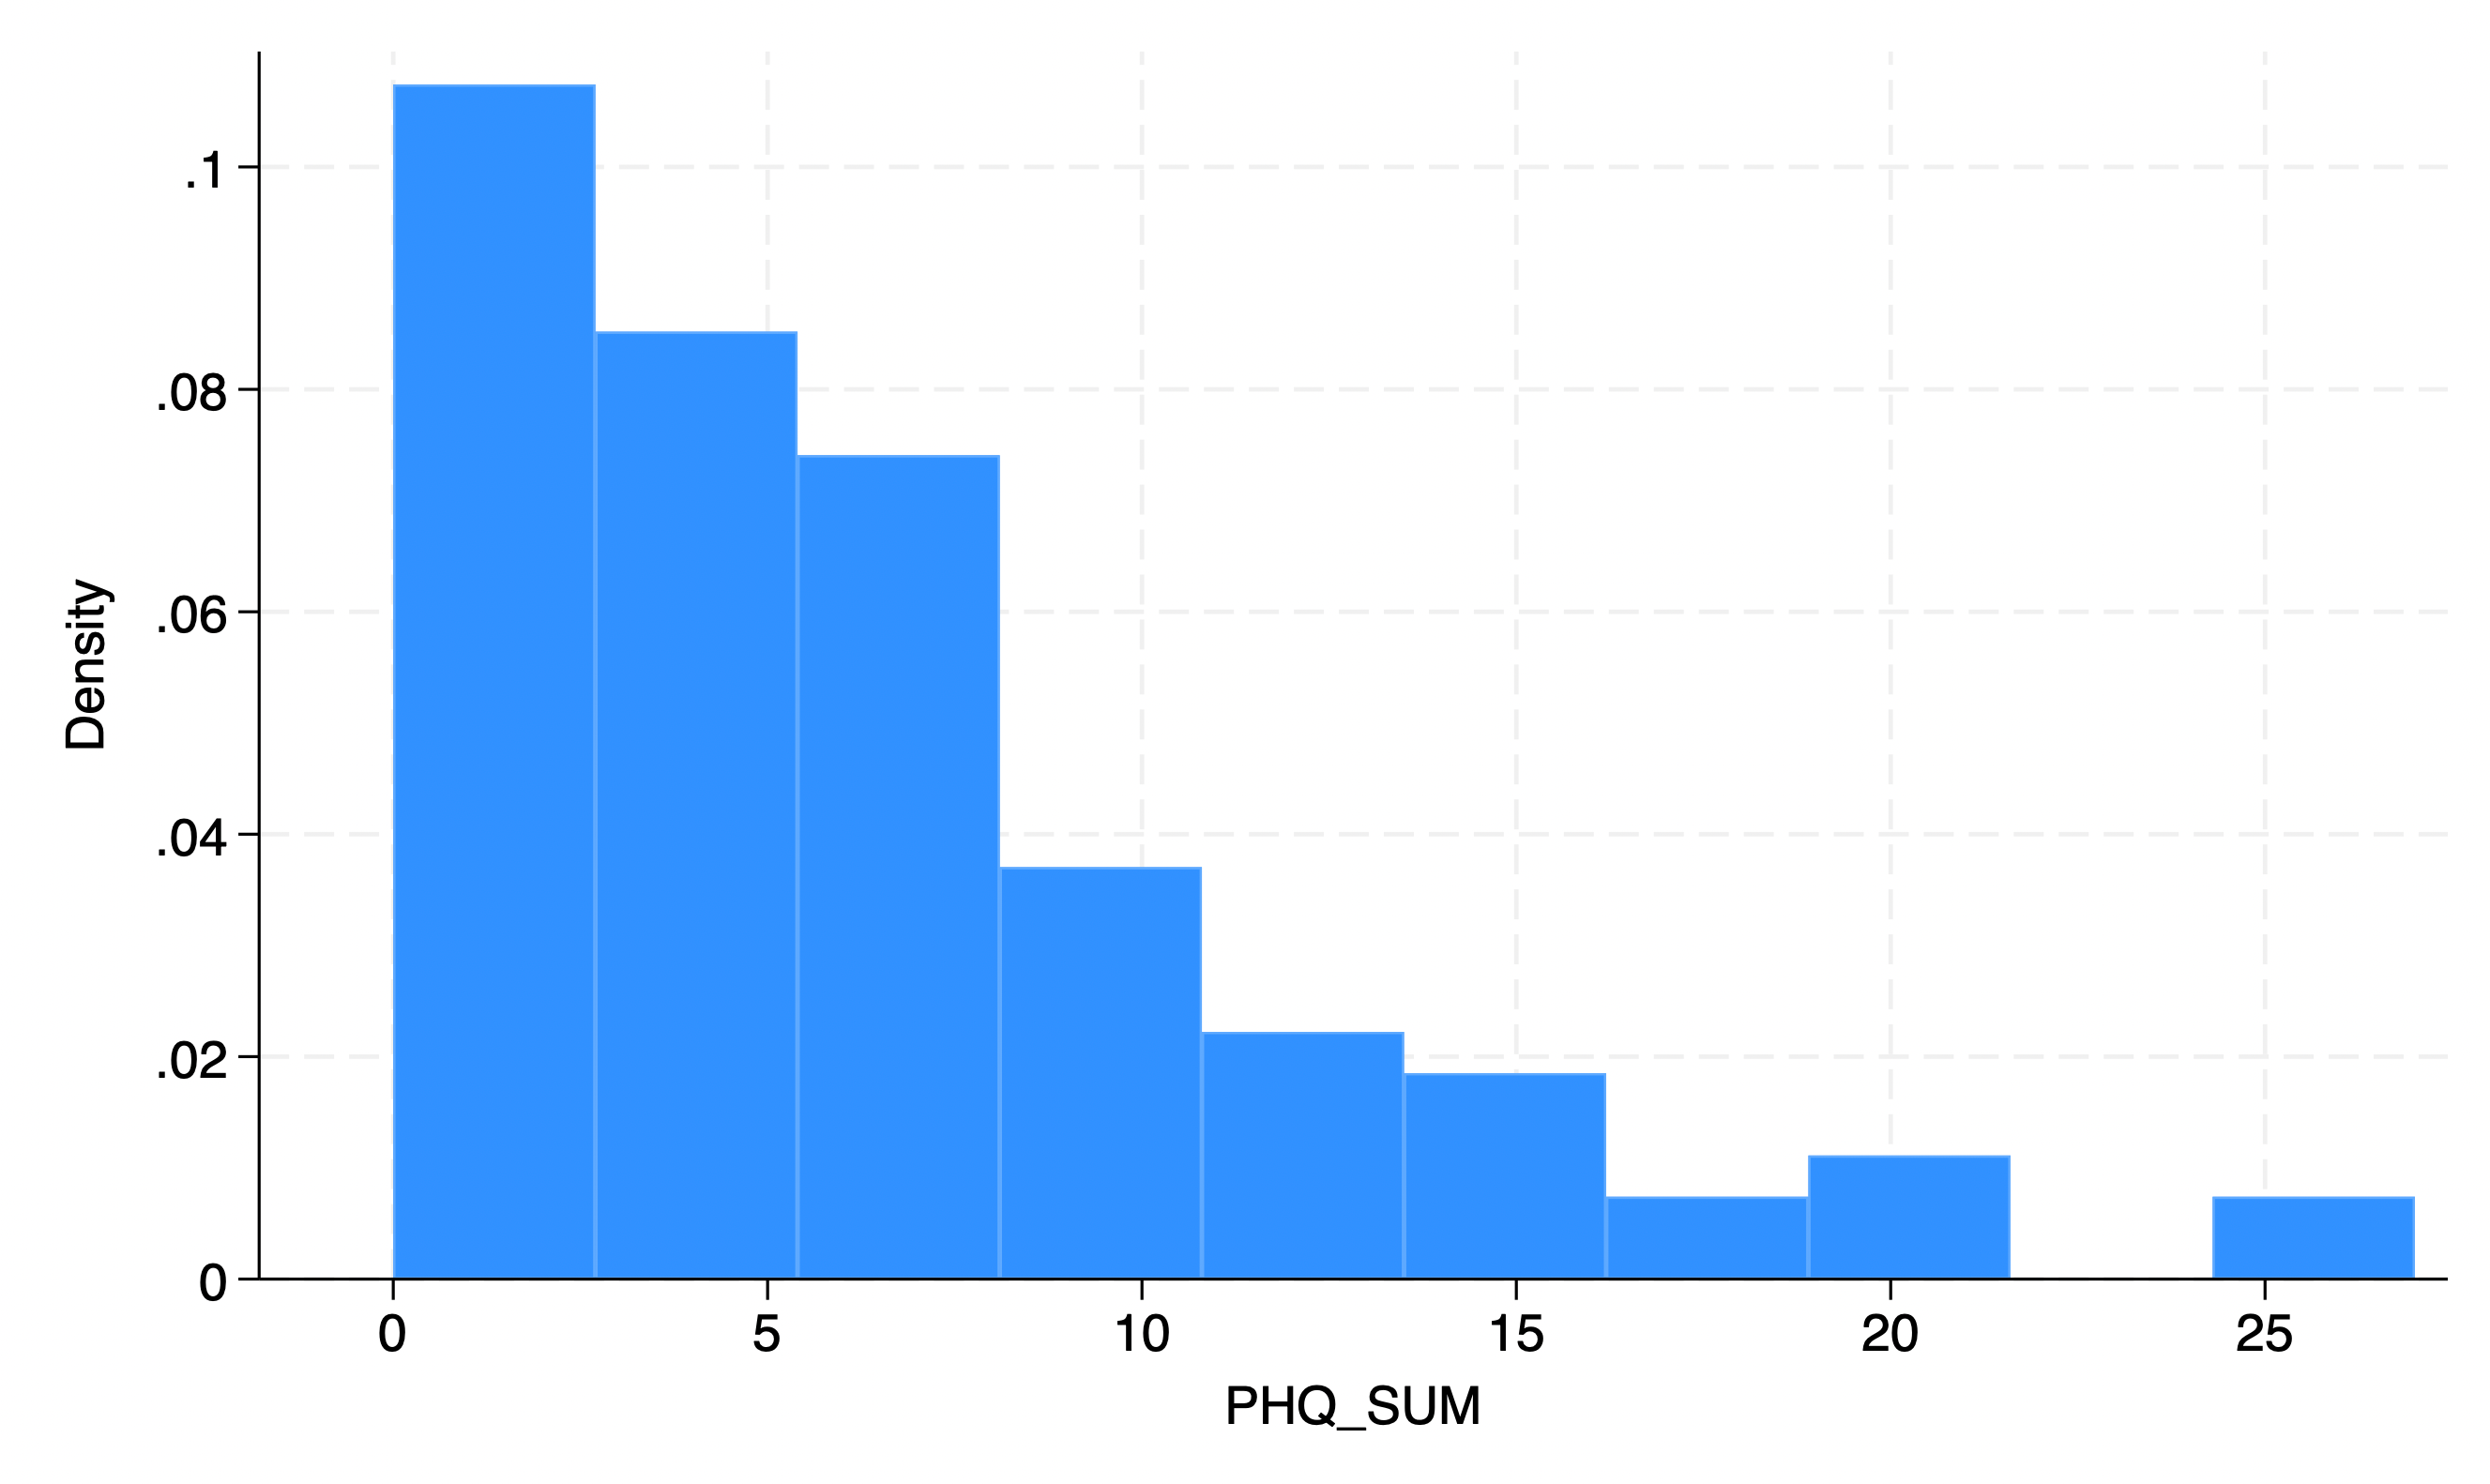
What is a histogram?
A graphical display of a distribution where the x-axis is the variable, the y-axis is frequency, and vertical bars show counts.
for quantitative variables there is usually no gap between bars.
What is an outlier?
An extreme score much higher or lower than the rest.
may be genuine
an error
due to equipment/method issues
What is the relationship between mean, median, and mode in unimodal symmetrical distributions?
They are very close to each other.
What happens to mean, median, and mode in skewed distributions?
They can differ; in skewed distributions the mean is pulled toward the longer tail.
What is the N vs. N-1 issue in variability estimates?
N is for population; N−1 is used when estimating population variability from a sample to reduce bias; most calculators/software use N−1.
What is percentile rank?
The percentage of scores in the distribution that are lower than a given score.
What is a z-score and its formula?
The number of standard deviations a score/value is above or below the mean: z = (X − M) / SD.
Indicates how far above or below the mean a raw score is, expressed in terms of the standard deviation.
What is an outlier and its relationship to z-scores?
An extreme score that is much higher or lower than the rest of the scores in the distribution. Outliers can sometimes be defined as scores with z scores less than -3.00 or greater than +3.00 (more than three standard deviations from the mean).
What are the two different types of timing in terms of the types of research designs?
Longitudinal – Data over time
Cross-sectional – Snapshot at one point
What are the two different types of control & manipulation in terms of the types of research designs?
Experimental – IV is manipulated, control group used
Non-experimental – Observation or correlation only
What are the two different types of data sources in terms of the types of research designs?
Survey/self-report (e.g. rating aggression)
Behavioural/observational (e.g. giving hot sauce to measure aggression)
What is the criteria for causality?
Covariance – Variables must be related
Temporal Precedence – Cause comes before effect
Internal Validity – Rule out other causes
Can both experimental and non-experimental designs meet the criteria for causality?
No, only experimental designs can.
Non-experimental research designs:
can establish #1
(if timing correct) can establish #2
but cannot establish #3
What is the difference between sample and population, and which one are research conclusions made about?
Population – Group you’re interested in
Sample – Subset you collect data from
Research conclusions are made about the population, not just the sample
What are the 4 types of data?
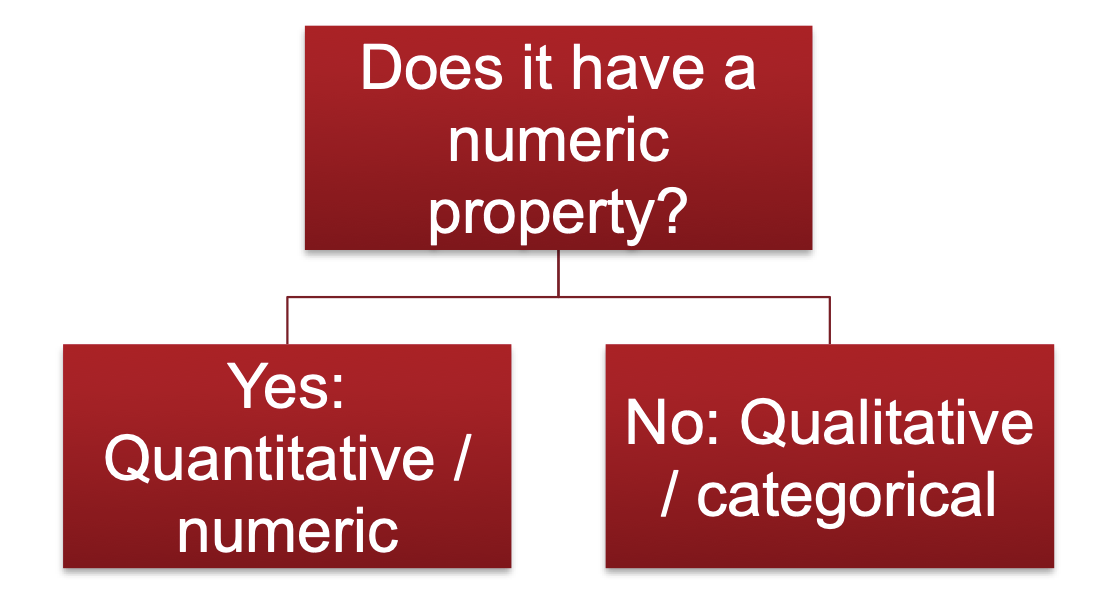
Quantitative - numeric
Qualitative - categorical
Discrete - e.g rank order,1st, 2nd…
Continuous - e.g weight, temperature
How can you tell if data is quantitative or qualitative?
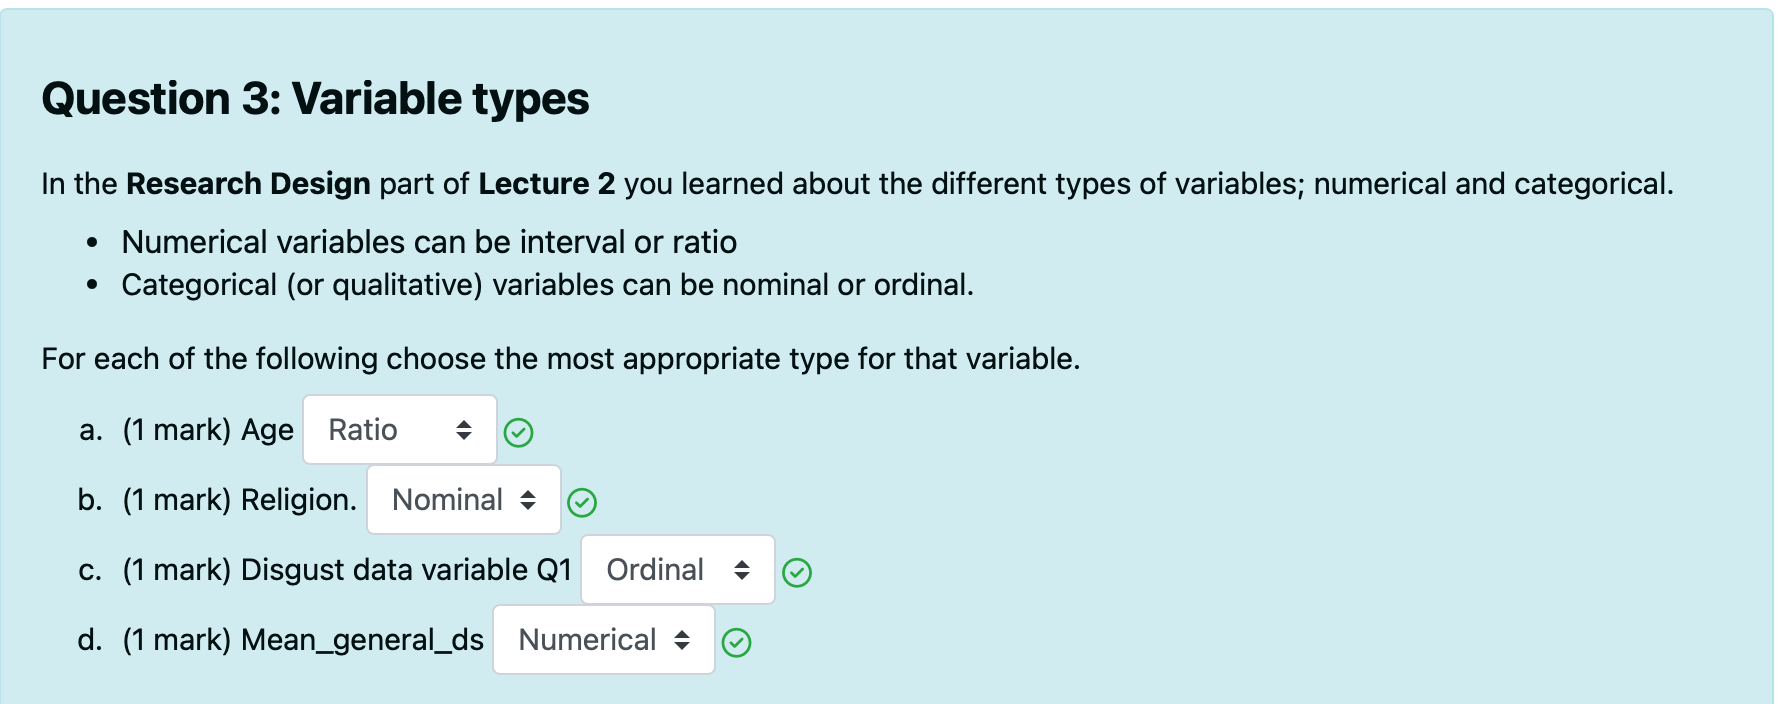
What are the 4 levels of measurement?
Nominal: unordered, categorical e.g gender
Ordinal: ordered, categorical e.g education level
Interval: numeric scale with consistent differences between points
Ratio: numeric scale with consistent differences between points AND absolute zero
What is the difference between absolute zero in ratios and an arbitrary zero in interval data?
Absolute zero in ratio data represents a complete absence of the measured quantity.
Arbitrary zero in interval data is just a point on the scale without representing any true absence.
E.G 0 degrees Celsius does not mean an absence of temperature (interval), while 0 degrees Kelvin represents no thermal energy (ratio)
What is an independant variable?
What you manipulate or use to predict
What is a dependant variable?
What you measure (outcome)
How are independent variables used in experimental vs non experimental studies?
Experimental designs: Independent variable can CAUSE a change in the dependant variable
Non-experimental designs: Independent variable can be associated with or PREDICT the dependant variable
What is an extraneous variable?
Extraneous variable: another variable that’s not the IV or DV
What is a confounding variable?
Confounding variable: an extraneous variable that can potentially explain the relationship between the IV and DV
Example: age, reading ability, and year of school in children
IV: age
DV: reading ability
Confound: year of school
When the independent variable is categorical, what does that mean and what does it determine?
Also known as the grouping variable, often has two groups/levels (e.g., junior vs. senior staff, Australia vs. USA, attending vs. not attending open day). The IV determines the study type (experimental or non-experimental).
When the dependent variable is categorical, what does that mean?
Predicts category membership, such as the chance of passing vs. failing a test, or the likelihood of depression vs. no depression. It does not have to be limited to only two categories.