RMT examen
 Call Kai
 Learn
Learn Practice Test
 Spaced Repetition
 Match
Match Flashcards
 Knowt Play
1/337

Earn XP
Description and Tags
RMT examen.
Name | Mastery | Learn | Test | Matching | Spaced | Call with Kai | Chat |
|---|
No analytics yet
Send a link to your students to track their progress
338 Terms
research consumer vs producer . give two examples of the importance of the research consumer role. Why should we be critical?
-as a psychologist if you help a patient, look op therapy you are a research consumer -if you do an experiment yourself : research producer -examples or importance of research consumer: scare method for trouble teens ( will not work) ; or the example of the guy that stated people could predict the future
significane but low effect size not replicatble he actuallly just ran his experiment so many times until he found signficant effects.
-so be critical, not all published rsearch is correct or robust -there also is an replication crisis in psychology. veel onderzoek niet repliceerbaar
How science works
how do they comunicate, its based on what, what to they do?
-based on empericism -scintist test theories -works on fundemental and applied problems -is continuously evolving -they publish in scientific journals -communicate to the general public via journalist
empericism: what to they aim to do. how is it done
-based on data obtained through our senses, instruments assist our senses, both quantitative methods and qualitaive methods to collect emperical evidence
-empericists aim to do research in a systematic, rigorous (streng, zorgvuldig) and replicable manner
scientist test theories : what framework do we use? two different types
-we start with a theory, from this theory we form research questions(how can i test this), than we preregister our hypothesis( public resposotory bv open science framework) -we can than either find evidence that supports our hypothesis or does nog
this is conformitory ( we have a theory to start with) ( inductive)
you also exploratory( deductive)
example of testing a theory: research question, hypothesis. Monkeys
two competing theories: does the monkey bond to the mother because of comfort of food
research question: what theory is right hypothesis: if this one is right they will spend more time on the right ( kooi met eten en kooi met monkey knuffl die zacht is).
difference research question and hypothesis
research question: nog open, bv voorspelt campusveiligheid studentenhapiness hypothese: studenten diem eer tevreden zijn met de universiteit zullen hogere geluksscores rapporteren. ( bij hypthese maak je een voorspelling )
eigenschappen van goede theorien (3)
-supported by data, but not one study
falsifiable: can be disconfirmed, for example somebody says they saw aliens, but you dont see anything. Yes but they wont show up if you are here
-parimonious: if you have multiple theories, the simpliest one is the best !a theory cann never be ' proven' but can falisified for example you say' all swans are white' you cant count all the swans but if you see a black swan its falsified.
a theory can never be proven but can be falsified
scientist form a community: scientific norms (4)
-researchers have a certain way of working
universalism: everybody can do research, we evalua the research not the researcher -communality: by researchers but for the community ( not always the case) disintrestdness: not influenced by politics, idealism, ( not always the case) -organizes skeptisims: kritisch zijn.
fundemental vs applied research/ translation reserach and example
fundamental ( or basic) : try to advance knowledge of a certain phenomenom, trying to understand theorhethical principles. BV hoe beinvloed feedback inzet,, what part of the brain is active during medidation , applied research: plaktisch voorbeeld oplossen. Werkt dit in de echt wereld? Helpt een beloningssysteem om studentn meer taken in te dienen. Heeft het meditatieprogramma geholpen met betere concentratie bij onze studenten tijdens lessen. Translattional research zit een beetje tussenin, dus we nemen iets theorhethisch maar gaan ttoch al kijken of het praktisch zou kunnn werken maar nog in een gecontroleerde omgeving bv in labo, can meditatie helpen op de scores van unistudenten op de GRE score.
theories are continuously evolving
theories are continiously tested, modified, falsified? -research triggrs follow-up research.
publishing: the procss
manuscript are submitted to scientific journals -there they undergo a peer-review process -the reviewers dont know who the article wrote and they have a certain expertise on the subject -the editors: manages submission and makes first decision wether or not article could be published. they evaluatee strengt weakness: reject , revise and resubmit, accept
how much is published?
-not easy to get something published -acception rates are lower but peopl are publishing more.
predetory journals: what is it, and example
you pay the journal to get published -MDPI example: less rejection rates
research communication to
journalist commmunicate: but they can miss nuances or interpret it different -always check orginal research yourself!
why is research better than experience, intuition or authority arguments
-uses a comparison group -control for hirdt variables -try to evaluate information without bias
research vs experience
-experience has no comparison group/thirdt variables -experience is confounded: hard to tak in differenct factors that could also be cause to the affect BV rage room> you feel better. But what is you had done something else? ( comparison). Maybe its because you were active ( thirdt variable) Bv: blootlettting to cure ilnesses. Some people indeed got better afterwards but there was no control group, maybe its because of sometthing else. After testing if we found that only 20% recovers with it, 91%without the treament VB radical masectomy is beter dan andere behandleing tegen borstkanker: maar other treatments waren niet getest ( geen comparison)
research is probabilistic
just because your more likely to be aggresssive in this group doesnt mean it counts for everybody
Research vs. Intuition
-our intuition is biased
good story bias : rage room, sounds logical availabitily heuristic: when something is easily remembered, for example hearth desease vs cancer
We schatten iets waarschijnlijker in als we er gemakkelijk voorbeelden van kunnen herinneren.
confirmation bias:tend to believe info and ttheories thtat confirm our own beliefs and give more attention to these
we are bad at judging these biases: bias blind spot
research vs authoritiy figures
be carefull what authority figures say, couold have differnt conflicts of interest, could be authority own experience or intuition, could be authotrity owns research and he messed with the data
thats why you should cite your funder
scientific sources
based on research:
scientific sources: journal articles ( emperical/review articles) chapters in edited books, full-lengh books other sources: trade books(look for references), magazines,newpapers, wiki's
pyramid of evidnce
1: meta analysis, systematic reviews 2: randomized controllld trials: strong in causal claims 3: quasi xperimnts with control group: no random asignment 4:pre-post test design ( bv zelfde groep na en voor behandeling meten): non randomized, observation, surveys,.. no causal conclusion 5: case studies

present bias
Wat is het? → De neiging om vooral aandacht te geven aan situaties waarin een vermeende oorzaak én een uitkomst samen aanwezig zijn, en de andere mogelijke situaties te negeren. Voorbeeld: "Ik uitte mijn emoties en voelde me beter, dus emoties uiten werkt." Waarom is dit een bias? → Mensen focussen op het vakje oorzaak aanwezig + gevolg aanwezig en vergeten te kijken naar: oorzaak aanwezig + gevolg afwezig oorzaak afwezig + gevolg aanwezig oorzaak afwezig + gevolg afwezig Gevolg: → We overschatten vaak het verband tussen een oorzaak en een gevolg.
confirmation hypothesis testing
o setting up hypotheses in such a way that in advance, they already know it will be confirmed. This is an unconscious process.
"Welke voordelen heeft deze therapie?" Je bent onbewust al vertrokken vanuit het idee dat ze werkt.
variables: is something that varies, meaning is has two or more levels. what are all the different types of variables and what is not a variable, when do we use that?
-variables vs constants ( opposite of variable) : sometimes we want to keep something constant for example on focussing on male gender. -measured (depandant) vs manipulated( independant): with manipulated its decided wich level the variable will have
-independant variable is not always manipulated for example in survey its measured -conceptual (abstract)vs operational: we need to operationalise it into something than can be manipulated of measured
ways of describing a variable (3)
construct, conceptual variable : for example satisfaction with life -conceptual defintion: a person's cognitive eevaluation of his or her life -operational definition/operationalization: 5 vragen op vragnlijst on de satisfacton with life scale of lang een kind een saaie acivitetit kan doen
example operationlization of manipulated variable
see slide 6 and 7 for more examples
exposure to disinformation: asigning to two group to hear false info either one or two tiimes
3 claims : based on what researc.
-frequency claims:descriptive research, each claim is about one variable -association
claims: pos/neg ; lineair vs culvinar ( see slide 14) , absent (no assosation) ;inspect with scatterplots to see if lineair is appropiate different patterns can still have same correlation, ( see slide 16) You cant interpet a pearson is its not linear words: could be linked, they are more likely
-causal claims: experimental research
-pearson correlatie meet alleen sterke van lineaire relatie, als meerdere scatterplots zelfde r hbben is alleen hun lineaire relatie hetzelfd, terwijl sommige culvinair kunnen zijn.
claims and types of validity: frequency link to types of validity
frequency: construct validity, how well had the researcher measures each variable, stattistical: BI of the estimate(schattingn), are there other estimates of the same percentage? -inteernal: not important -
external: very important
claims and types of validity:association link to types of valiidty
construct: how well are both variables measured? And did they measure what they were suppose to? ( reliabiliy) statistical: hat is the effectsiz, how pricisze ( confidence inteerval), what do estimates from other studies say? -internal: not important but avoid making causal claims based on assosation -external:that what other situations may the association be generalized?
claims and types of validity:causal claims
construct: how well manipulad and measured statistical: effectsize, cofidence interval, what do other sttudies say? -internal: was it an experiment, temporal prresedeence, control for alternative explanation by random assingment?
-external: to what situations, populations,.; can we generealize this causation?
conditions for causality
-covarianc, temporal presednce, no alternative explanations: random asignment best way, that way you control for possible alternative explanations, thay way the groups are randomly different. for example: if you dont randomly assign maybe more motivatted people will pick a certain condition.
spurious associations : whatt is it.
we are often tempted to believe correlation are a sign of causality Correlatie ≠ Causaliteit Een correlatie tussen X en Y kan door 4 dingen verklaard worden:
Directionaliteitsprobleem → Veroorzaakt X Y, of veroorzaakt Y X? → Bv. depressie → weinig bewegen, of weinig bewegen → depressie?
Feedback relatie → X en Y beïnvloeden elkaar wederzijds → Bv. zelfvertrouwen ↑ prestaties, en prestaties ↑ zelfvertrouwen
Confounding → Een derde variabele Z veroorzaakt zowel X als Y → Bv. ijsverkoop en verdrinkingen correleren → maar hitte verklaart beide!
Selection bias → De steekproef creëert een kunstmatige samenhang die in de populatie niet bestaat → Bv. je onderzoekt alleen topsporters → vertekend beeld
balance between types of validiy
to study is perfect -balance internal vs external validity -external vs construct: shorter meeasurments reduce burdan improve external validity but longer is better construct validity.
ethical guidelines: the belmont report
3 principles to use in experiment
1respect for persons:informd consent, protect culnarabl groups
2beneficenc: balance between risk and benefits for partipants or society and protcting participants personal information
3: juistic: fair balance between people participating in study and people benifitting from study bv arme mensn nemen alle risico's in de studie maar rijke profiteren
apa guidelines: gneneral principls ( apply to psychologists) in research but also in practice
5 general principles:
<bnficnce and non malifinence: not cause harm, do good
<fideility(betrouwbaarheid) and responsiblity: upholding professional standard, but also in general not just in research, for example not sharing information from a client
<integritity: honest and transparent practice
< justice: no discrimination
<respect for peoplles right and dignity:
privacy, autonomi, waardighid, culturle verschillen. but these are not only in research
apa guidelines: for research (15)
standard 8: 1.Institutional Review Board 2.Informed consent (participation) 3.Informed consent (recording of audio and images) 4.Participants in research 5.Omitting informed consent 6.Incentives 7.Deception 8.Debriefing 9.Animal research 10.Reporting results 11.Plagiarism 12.Publication credit 13.Multiple publications using the same data 14.Sharing data 15.Reviewing
>
institutional review board
role: unsure ethical principles are adhered in rsearch procedure: ►Researchers submit application prior to data collection ►Data can only be collected after study is approved by IRB ►IRB approval is commonly required by funding agencies and scientific journals ►Some studies do not require ethical approval: when you use data that is already published for example
informed consent: what is in it and what problem
•Form describing procedures, risks, and benefits of research •Also describes how data will be treated (e.g., GDPR rules, will data be anonymous, confidential)
•Problem: participants do not always read informed consent forms •Majority of participants do not read informed consent form thoroughly •Less than 70% of participants could recall target phrase ("Some researchers wear yellow pants") from the consent form
deception: what is it, when do we use it
Deception = deelnemers misleiden of informatie achterhouden. Vormen: Omission → niet alles vertellen Commission → liegen Waarom? Om natuurlijk gedrag te krijgen en reactiveness te vermijden. Risico's: negatieve emoties minder vertrouwen in onderzoek Daarom: Debriefing achteraf is verplicht.
debriefing: what is it, when do we use it
•Required for studies that use deception •Often required for any study done in an academic context •Purpose? •Reestablish trust •Give information about study •Opportunity for participants to learn something from study
research fraud: 3 types
•Plagiarism: copying work •Fabrication: adding number so that data would confirm hypothesis. Adding data that never existed •Falsification: changing numbers on real data
questionnabl research questions:
Not reporting all dependent variables
Collecting extra data after first analysis
Not reporting all conditions = not reporting all levels of your dependent variable (≈ number 1)
Stopping data collection when desired result is reached = stopping when you found what you were looking for
Incorrectly rounding down p-values (e.g., p = .052 becomes p = 0.05)
Only reporting studies that "worked" (≈ number 1 and 2)
Leave-out data until desired results are reached
Hypothesizing After Results are Known (HARKing) = turning the empirical cycle upside down = you first have data and then you form a theory that supports the data (easier) G. Falsely claiming that certain variables did not influence results
Falsify data
prevalence quastionalbe research questions
first they found pretty high prevalnce but there were ambiguous question
so estimated between 1-11%
rearsons and solutions:fraud
Reasons for fraud: •Personality of researcher: seeking attention, ambitieus •Rational choice by researcher: more likely to get published •Social context: when there is very little control over de studies Solutions: •Regulation •Norms •Code of conduct: you need to sign before you you do research •Training •Mentoring:givng right example
-->best solution OPen science
wat is open science
"Open Science" is an umbrella term used to refer to the concepts of openness, transparency, rigour, reproducibility, replicability, and accumulation of knowledge, which are considered fundamental features of science. (Crüwell et al., 2019)
•Preregistration: submitting hypotheesis and way of data collection to public platform ( to avoid Harking)
. •Sharing data and analysis scripts (reproducability) ( niet zelfde als replicatie, daarbij ga je op andere steekproef/andere data) •More attention to replication studies (replicability)
•Open access publications: niet achter paywall
animal research
There are speciffic rules for it: BCLAS is an agency for this, they do checks.
If you want to work with animals you need to folllow a training.
The 3 r' s: what people should thing about before doing studies:
replacement: could i do this without testing on animals , reduction: with fewer animals refinement: refine it in such a way thay the impact on the animals in minimal as possible
You can also look at by core value's: weigting about social beneifts, animals welvare
social vs animal welfare principles weighting
social: no alternative method , expected benefit , sufficint value to jusify harm(belangrijk geneog zijn de vraag)
stijging na 1970
eerst lange daling geweest maar nu terug stijging door genetische modificatie
reliability:test-retest reiability:
measure variable at two times -corrrelate -you want a high pos correlation -assumes stability in construct: for example hapiness changes so not good choice here , personality traits would be good choice -you can vizualize this by a scatterplot (je visualizeert de scores van de verschillende mensen op de 2 momenten ;punten liggen dicht op een diagonale lijn)
krijgen personen dezelfde score als je het nog eens afneemt
reliability vs construct validity
reliability is a condion for validity
interrater reliability
-at least two raters, -typically used for observation and qualitative research -correlate scores of both raters -weer straks op en diagnoale lijn(pearson) -nominaal: gebruik cohens kappa rather than r
internal cosistency reliability
-useful for multi item scales measuring same construct -we expect items measuring the same construct correlate positively with each other -you take the average correlation of all the correlations of the items that measure the same
>than you get the average inter-item reliability
-cronbach alpha : does the same thing (0.70 or higher is good)
cronbach alpha: average intercorrelation internal consistency relibility
cronbach alpha assums equal factor loadings. λ1 = λ2 = λ3 = λ (je lamba's) -je hebt T je latent construct , dat beinvloed hoe je de items beantwoord maar de items wordn ook beinvloed door meetfout -Maar cronbach alpha neemt aan dat elke variabele dezelfde factor lading heeft, en dit is bijna nooit het geval. je kan dit checken met factor analyse. -alternatief: omega (w) (zie formules slide 14) -you estimate )
-if your assumption of equel factor loadings was met omega and cronbach alpha find the same -it not the same cronbach alpha is biased
face validity (subjective)
does the measure appear to be a good indicator of the construct -you could ask this to experts on the topic
content validity (subjective)
does the measure contain all relevant aspects bv iq test maar enkel wiskunde bevragen -you could show this again to experts. (more subjective)
criterion valiidty ( emperical)
= de mate waarin een test samenhangt met een relevante echte uitkomst of gedrag zoals theoretisch verwacht. Voorbeeld: hoge score op rijtest → minder ongelukken hogere depressiescore → meer kans op depressiediagnose Vaak getest met: correlaties met echte uitkomsten ; known-groups paradigm (groepen die theoretisch moeten verschillen vergelijken) BV angstvragenlijst, en je vergelijkt scores op een groep met angststoornis en controle groep -Idea = think about a relationship of the variable with a certain outcome (behavior, result, difference between groups), collect data and check whether data supports expected pattern

convergent validity (emperical)
-you expct there will a positive relationship with anoter variable. For example scales that measure hapiness should correlate high, if you score high on one you score high on the other (see exampl p 33)
discriminant validity (emperical
-you expect no relationship with other variable that measures a different construct. BV depressie schaal en IQ schaal. Nu het ding is soms hangen construct wel wat samen bv angst en depressie dus ga je waarschijnlijk wel correlatie tussen zien maar niet te hoog best.
evaluating reliability and validity
-cronbach alpha is often reported -other evidence for relibilitty or construct validity is often missing. -is often missing because it has been established in primal work.
surveey research: how can it be done?
Survey research can be done in multiple ways: •Online survey •Door-to-door survey •Experience sampling survey: small set of queestions repeatedly •Pen-and-paper survey •Telephone survey •Structured interview: in between qualitative and kwantitive
experience sampling
= survey methode waarbij deelnemers meerdere keren per dag in hun natuurlijke omgeving vragen beantwoorden over hoe ze zich op dat moment voelen, denken of gedragen. Doel: → ervaringen "in the moment" meten en recollection bias verminderen. Types: Signal-contingent = vragen op vaste/random tijdstippen via notificatie Event-contingent = vragen invullen na specifieke gebeurtenis Sterktes: hoge ecological validity minder memory bias en common mthod bias goed voor veranderingen binnen personen over tijd Zwaktes: hoge participant burden → dropout reactivity/testing effects (meten kan gedrag beïnvloeden) ( Bv als je telkens moet beantwoorden hoe gestresst je bent ga je miss meer stressen)
us de correlatie die je vindt is vaker een echt verband en minder een gevolg van dezelfde meetmethode.
Ezelsbrug
Common method bias = "de correlatie komt deels door de meetmethode, niet alleen door het construct."
Bijvoorbeeld:
stressvragenlijst ↔ depressievragenlijst → mogelijk common method bias
stressvragenlijst ↔ cortisolwaarde → veel minder common method bias, want verschillende meetmethoden.
common method bias
Common method bias = vertekening waarbij variabelen deels correleren doordat ze met dezelfde meetmethode werden gemeten (bv. zelfrapport op hetzelfde moment), en niet enkel door een echte relatie tussen de constructen. Voorbeeld: iemand in slecht humeur vult zowel stress als geluk negatiever in → artificieel sterkere correlatie. Bv je onderzoekt werktevredenheid en associatie met tevrednehid leiderschapstijl baas. Als je dat op zelfde moment meet en die persoon in juist in slechte bui ga je beide slecht invullen.
-kan bv oplossen door variabelen op verschillende tijdstippen meten. Verschillende meetmethoden gebruiken. Verschillende informanten gebruike
single vs multiitem measures pro’s and contras
PRO multi-item: o People usually avoid single item measures because it is harder to test things such as reliability or construct validity ➔ multi-item measures are better for this o The longer the measure, the better the reliability seems to be • PRO single-item: o Single item measures have a lower drop-out level = the shorter the measure, the easier it is for the participants o Single item is valid way to assess the construct you're interested in, because you only measure one thing
-its an urban, legend that a single item is bad, can have good reliability and validity (keuze hangt af van je onderzoeksdoel)
should you develop your own scale or use existing scale?
-existing is preffered but you can develop your own scale but than you need to validitate it, writing well-worded questioni, encouraging accurate responsnes, choosing right question format
questions types
•Open versus closed questions •Closed questions: •Dichotomous versus polytomous items •Different measurement levels (nominal, ordinal, interval, ratio) •Different scale types (forced choice ( to limit social desirebility) likert rating scale, visual analogue scale, semantic differential scale, Guttman scale
liketscales
-always bipolar -•How many answer options are needed? •Few answer options: may be too coarse to pick up individual differences •A lot of answer options: Potentially better reliability, but also complex for respondents(difference between 11 of 12th option?) •Even or uneven number of answer options? •Why do people choose the middle answer option? This is not always clear! •Recommendation: 6-7 answer options
visual analogue scale
indicate on the line how you feel -measures intensity of experiences
-twee uiterste maar niet perse altijd biopolair
bv no pain en unbearable pain is niet elkaars tegenovergestelde.

sementic differential scale
you aquare both ends on the scale and there are opposites adjectives: Voorbeeld met les evalueren Likert "The lecture was clear." strongly disagree → strongly agree Semantic differential Confusing 1 2 3 4 5 Crystal clear kertschaal = mate van akkoord met een uitspraak. Semantic differential schaal = positie tussen twee tegenovergestelde adjectieven.
guttman scale
you need to check off if you agree with the statement -they will increase in intensity -score,the amount of statemets you agree with.
writing well worded question
pay attention to: -leading: questions , for example how satified are you with the amazing food in the restaurant
Double barraled: more questions in one question, how satisfied are you with the warm meals and the sandwiches
Double negations: how disatified are you with the lack of quality. To complex.
Ordering might sometimes have an effect: what are potential stressors in your life, how stressed are you now? how to deal with this? you can randomize the order for every participant.
encouraging accurate answers: what ways to people someetimes answer items, what problems ?
•How much can we rely on self-reports?
•Reporting more than we know in reality is often a problem ( bv 2 dezelfde producten laten proeven, welke vind je beter?)
•How accurate is our memory of events, ( recollection bias)
•However, some variables can only be measured with self-reports
•Respons biases
>•Acquiescence:aways selecting same answer because you dont pay attention •
>Fence sitting: you always choose the middle option
>Social desirability
>•Faking bad (malingering)
misinterpriteting questions
-unstirutional miscrophehension: do not read instructions -sentential: they interpret it different -lexical: people dont understanding a word
how to detect low quality data: (9)

is it really low quality data? and what to do with it?
You can check various things in your own dataset to what extend that might be problems (low quality data) -> you could say that if people meet certain criteria, if the data seems low quality for that individual, than you can maybe delete that person from the dataset as long as you're being transparent about it in your article. The only problem is that you can never be completely sure that it's respons bias and not actual responses of the person
observations vs selt report what iss bettter?
Often seen as more reliable than self reports.
For example would you help? In self report ( hypothethical) in observation ( real behaviour) could be diffrecned -less influenced by biases like social desirebility
But there are not that many studies that use observations.
some problems with observations ( +horse example)
Observer bias: observers see what they expect to see and would like to see confirmed
• Observer effect: participants behave in line with expectations of the observer o Illustration: clever Hans (the horse). This dates back from the 19th century. Someone claimed he had a very intelligent horse who could solve mathematical questions. People would ask the horse 'how much is 3+5?' and the horse would stamp 8 times with his hoof —> they found out that the horse could not do mathematics, but it was actually observer effect. The horse was observing his owner's behavior and reacted to that (stopped after 8 times, because he saw a change of behavior in his owner) -> so the horse was acting to being observed and changes its behavior based on what It saw during the observation
2. Klaslokaal
Onderzoek naar aandacht in de les.
Leerlingen weten dat ze geobserveerd worden.
Ze letten beter op dan normaal.
3. Gezond eten
Je onderzoekt eetgedrag.
Mensen weten dat hun maaltijden geregistreerd worden.
Ze eten tijdelijk gezonder dan gewoonlijk.
• Reactivity: participants react to being observed and change their behavior
verschil tussen observer effect en reactivity
Observer effect De deelnemer reageert op de observator en diens verwachtingen. Voorbeeld: Hans ziet signalen van zijn eigenaar. Proefpersoon probeert te doen wat de onderzoeker lijkt te willen. Reactivity De deelnemer reageert op het feit dat hij geobserveerd wordt.
reliable and valid oservations
Unobtrusive observations: observing people who don't know they are being observed (usually done with children —> behind a window)
• Wait it out —> we know people change behavior when they know they are being observed. We could give people time to adjust to the fact they're being observed and start later with the real observation.
• Measure the behavior's results = if you want to observe how much alcohol people consume and you observe them in their house, people will not react as they would normally. You could go and check when they put out the garbage to see how many empty bottles are in the trash
• Using a codebook = we upfront describe what behavior we want to observe, what an indicate for the behavior is,…
• Interrater reliability = use multiple observers
• Blind and double-blind design: o Blind = the participants can't change their behavior because they don't know about the hypotheses that have been made o Double-blind = not only the participants, but also the observers don't know about the hypotheses (so they can't change their behavior or be influenced by it)
how could we measure stress?and what is the problem with measuring psychological constructs?
by sweat ( but with a baseline first) -queesinnaire: but lott of biases , inaccurate data -measures often dont have a 1 to 1 relationship with construct.
some key terms extrne validiteit
•Population and population-of-interest (N) •Census: testing all people in pop •Sampling frame: people you invite to our study •Sample (n) •Representative vs non-representative sample •Probability sampling versus biased sampling
-->what mattrs if not really how good your sample is but how you select people in your sample
key issue externe validitei t
can we generaliz to our population of interest, what mattters is how we collect our sample not how big our sample is. -can we generalize to the population of interest with our sample? -external validity: how good we can generalize to a population, setting, and time
representative vs non representative sample
Representative vs non-representative o Representative = the individuals in your sample have characteristics that are similar in the population o Non-representative = for example: your population of interest is people between 18 and 50 years old and your sample only contains 18-year-olds = not representative
probability sampling vs biased sampling
Probability sampling versus biased sampling o Probability = uses probability = you select people at random from the population = higher likelihood that your sample will be representative of the population o Biased = your sample will be biased in a way and not be representative of population (= non probability)
sampling bias and sampling error , synonyms for biased sample

ways a sample can be biased
snowball sampling, self seleced sample(sampling those who voleneer ) , convience sampling(sampling only those who are easy to contact ) , purposive sampling.
probability sampling (overkoepelende term)
-stonger external validty
use random selection.
simle random sample
we get a list of every member of population, everybody gets a number, randomly generator n numbrs. -requires list of all members
cluster sample
We divide population in clusters/groups (e.g., schools —> we don't have a list of all school children, but we do have a list of all schools) o Then, we randomly select clusters (let's say we randomly select 100 of the list of 1000 schools) —> every member of the population has an equal chance of being invited to the study, but now we can base it on the cluster instead of on the person o Sample all members of selected clusters ( sample= uitnodigen) -->(je kan nog steeds non response bias krijgen dan)
stratified random sample
Procedure:
o Divide population in subgroups (strata)
o Then, we randomly select members within each subgroup • Example: You want to do a study on 200 psychology students. Let's say that 20% of the students are male and 80% are female. We could divide the population based on gender and then randomly select participants in each group. You have to select participants in such a way that your sample mirrors the real situation in the population. This means that a sample of 10 individuals would have to consist of 8 female students and 2 male students
o By doing this, we are making sure in advance that our sample will be representative of the population —> same in the sample as in the population (might not be the case when you do simple random sampling)
o Size of subgroups in sample is proportional with size of subgroups in population, (it mirrors the size) example: ➢ Population: 200 students (80% women; 20% men) ➢ Sample: 10 students (8 women; 2 men)
oversampling
-same as stratified random sampling but the siz of the strata does not have to be the same as in population.
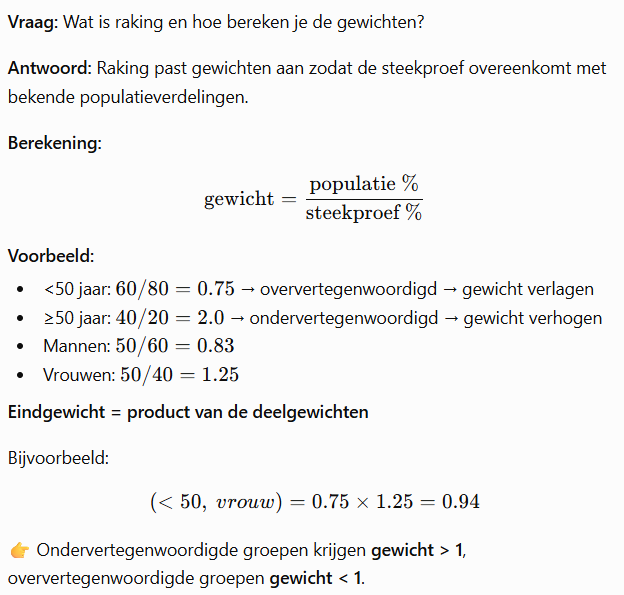
you devide people in to strata Randomly select members within each subgroup •Size of subgroups in sample is not proportional with size of subgroups in population, example: •Population: 200 students (80% women; 20% men) •Sample: 10 students (5 women; 5 men) Weighting (also called raking) can be used to correct differences between sample and population proportions during analyses weight indicates how important/much weight we should give to the particular observation when doing our analyses
In this example, we could give the female participants a bigger weight, because we make a correction of the oversampling of the males (see powerpoin
Why is this used? ➔ for some statistical techniques, it is important that you have enough participants in each group (for example when you do research on gender differences = might be interesting to have at least 10 male and 10 female participants) • Problem = now you have a sample that is not representative of the population. We have to take this into account and we can do this during the analyses by weighting • Weighting (also called raking) can be used to correct differences between sample and population proportions during analyses —> we give every individual a weight and this
systematic sampling
Systematic sampling = probability sampling methode waarbij je na een willekeurig startpunt op een lijst personen tussen 1 en k Formule: k= N/n N = populatiegrootte n = gewenste samplegrootte Voorbeeld: bij N=100 en n=20 → k=5 dan pak je dus een random nummer tussen 1 en 5 en dan vervolgens pak je elke 5de volgende case. Belangrijk: de lijst mag niet geordend zijn volgens een relevante eigenschap, anders ontstaat bias. -other example microphone recorded fragments of 30 s, every 15 minutes , is also systtematic sample because we want a audio fragment that is representative of the whole day
Multistage sampling
•Combination of multiple sampling techniques •Example: •Start with cluster sample to select cities in Belgium •Use simple random sampling to select streets in selected cities •Use systematic sampling to select street numbers in selected streets •Benefit = efficiency, lower costs, less transportation.
convience sampling ( biased)
select participants because they are easy to contact or convince -is often very biased -see examles pagina 49
psychology studentes in psychological experiemnetns ( course credit)
telephone surveys: was used a lott in the past but not anymore, because people that use telephone are ot the same than people whithout landline.
would you let your kid sit in a cat seat: on a website that sells car seats.
purposive sampling ( biased)
Wat? Onderzoeker selecteert bewust deelnemers met een specifiek kenmerk dat relevant is voor de onderzoeksvraag.
Selectie is niet random. Belangrijke nuance Het is niet fout om enkel een bepaalde doelgroep te kiezen (bv. mannen, ontslagen werknemers, depressieve patiënten). Het probleem is dat deelnemers binnen die doelgroep meestal niet willekeurig geselecteerd worden. Voorbeeld Onderzoek naar stress bij mannelijke studenten. Doelgroep = mannelijke studenten ✔️ Flyers uitdelen op één campus → niet elke mannelijke student heeft dezelfde kans om geselecteerd te worden ✖️ Gevolg Efficiënt voor specifieke doelgroepen. Maar representativiteit en generaliseerbaarheid kunnen beperkt zijn door de non-random selectie
snowball sampling (biased)
•Select certain people into sample •Ask every person in sample to recruit additional participants •Can be usefull for difficult to reach populations •Example: •Ask AA-meeting attendees to participate in study on alcohol abuse and ask them to share survey with other people who have abused alcohol
quota sampling
Quota sampling Verdeel populatie in subgroepen (strata). Selecteer binnen elke groep niet-random deelnemers tot een vooraf bepaald quota bereikt is. Lijkt op gestratificeerde steekproef, maar zonder random selectie. Proportional quota Verhoudingen in steekproef volgen populatie. Non-proportional quota Verhoudingen wijken bewust af van populatie (oversampling). Bv voor meer statistisch power. Voordeel Zeker dat elke groep voldoende vertegenwoordigd is. Nadeel Geen random selectie → risico op bias en minder generaliseerbaarheid
when is external validity important?
•Crucial for studies making frequency claims •Less important for studies making (causal) association claims •When is a biased sample a problem? •Only when the characteristic that is making the sample biased is relevant to what you are measuring.
for example gender is known to be linked to creativity, than its a problems
how to evaluate external validity
•Look at the sampling technique used and think about the populations, settings, and times to which the results can be generalized •Look at the claims the authors make in the article. To what populations, settings, and times are they generalizing? Is this warranted? •Have the results been replicated?
weird samples
•Psychological studies often use psychology students as samples •WEIRD samples (White, Educated, Industrialized, Rich, Democratic) represent 80% of study participants in the literature, but only 12% of the world's population •Assumption: psychological process being studies is universal •This assumption is often false…
online paid panels
they often rely on online paid samples because diffecult to get a good sample -instead of finding a sample yourself, you can pay companies so that they look for a good sample of your research.7 -advantages: efficient -dangers: bots, some people do it to get money (likely different than a broader pop) often you get invalid data, because a lott of peopl who participate may dontt fit the criteria or pay low attention, or just click thing randomly
=self selection bias, and non representative sample