Research Class 9 Part 2
1/91
There's no tags or description
Looks like no tags are added yet.
Name | Mastery | Learn | Test | Matching | Spaced | Call with Kai | Chat |
|---|
No analytics yet
Send a link to your students to track their progress
92 Terms
Which of the following are categories of statistical analysis?
descriptive and inferential
Which of the following refer to the purpose of descriptive analysis?
Organize the data and its distribution
Synthesize the data and its distribution
Describe the characteristics of the data and its distribution
Which of the following are descriptive statistical categories?
Univariate
Bivariate
for each of the questions, answer with which level of measure you can use for the following
frequency counts
Nominal, categorical, interval, ratio
Measures of central tendency
interval, ratio
Measures of variability
interval, ratio
bar charts
Nominal, categorical
Histograms
interval, ratio
pivot table
nominal, categorical
correlation
interval, ratio
Inferential statistics advance data analysis, beyond describing each variable or variables in association with each other, to ___ relationships between or among variables with the goal to generalize the findings from the sample population back to the larger target population.
predict
Inferential statistics involve the calculation of probability to make reasonable ___ of the population parameters from the sample.
estimates
In inferential statistics, the objective of ___ is to determine the probability of getting the calculated study findings from the sample data out of 100% all probabilities.
hypothesis testing
When an outcome (DV) from the data occurs with ___, then that is considered to be common or frequent and therefore likely due to chance alone, and NOT likely due to the IV
high probability
In other words, it happened so frequently that by chance alone it would occur on its own, and the IV had ___ with the outcome (DV).
nothing to do
When an outcome (DV) from the data occurs with ___, then that is rare, and is considered not likely due to chance alone, but likely due to the IV.
low probability
This principle of probability is essential to test a ___ statistically.
hypothesis
___ is an expression of the chance that a certain outcome will occur.
Probability
The probability of the occurrence of one outcome can be expressed as a ___ of all possible outcomes.
proportion
Proportions, and therefore probabilities, can be written as ___, decimals, or percentages.
fractions
Simple random sampling or independent random sampling satisfies two requirements
Each element has an equal chance of being selected.
There is a constant probability of being selected.
Simple random sampling does not guarantee the sample is ___ of population
representative
Simple random sampling does ensure that any difference between the sample’s attributes and the population’s attributes happened by ___ alone and not by researcher or participant bias.
chance
Both the research samples and the target populations can be presented as ___
frequency distributions
Frequency polygons (smoothed to curved) are the models of those distributions. The area ___ the curve represents 100% of all cases.
under
___ of the area under the curve represent the proportions (out of 100%) of all cases under the curve.
sections
Those proportions provide us with ___
probabilities
The normal distribution is a theoretically perfect ___ and as such, the exact probabilities of sections or proportions of the area under the curve have been calculated.
bell-shaped curve
The normal distribution of ___ proportions under the curve for sections are determined by the number of standard deviations from the mean.
z-score
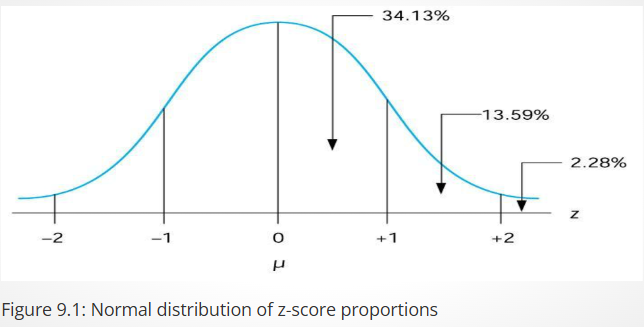
What is the percent probability of scores within 1 SD above and below the mean?
68.26%.
What is the percent probability of scores within 2 SDs above and below the mean?
95.44%.
What scores are considered extreme scores in descriptive statistics for continuous levels of measure?
Scores that are +/– s SDs from the mean.
The X-axis of the normal curve is measured in ___ (where z = +1 is one standard deviation from the mean).
z-score values
All z-score values are associated with ___ or sections of area under the curve. These proportions are presented as probabilities in the unit normal table.
proportions
We can use the ___ to find probabilities between two z-scores. We commonly want to find probabilities between two X-scores.
unit normal table
Raw X scores can be ___ to z-scores so that we can find the probabilities of any X-score occurring.
converted
We can rarely measure all members of a population for anything. Therefore, we take a ___ of the population.
sample
The sample is rarely normally distributed on any variable because samples cannot be ___ representations of a population.
perfect
___ is the discrepancy, or amount of error, between a sample statistic and its corresponding population parameter.
Sampling error
If we take numerous samples from the same population, the distribution of scores on a curve will all be ___
different
Imagine taking numerous samples from a known population. Each sample would have its own ___, which would be different from the population mean, due to chance error alone.
mean
Imagine making a new distribution from all those sample means.
The ___ is the collection of sample means for all the possible random samples of a particular size (n) that can be obtained from a population.
distribution of sample means
A ___ is a distribution of statistics obtained by selecting all possible samples of a specific size from a population.
sampling distribution
A sampling distribution is the ___ of the sample means.
distribution
The distribution of sample means will approach the shape of a ___ curve.
normal
what is the central limit theorem
Any shape of a population distribution (even flat shapes) can generate samples with means that (in their own distribution) form a normal distribution
This is so ___ to hypothesis testing that a mathematical theory was established to describe it for all populations.
fundamental
The theory proposes that for any population, ___ of size (N) will result in a distribution of sample means that approaches a normal distribution (which provides a link to the probabilities needed for inference)!
repeated samples
Because the distribution of the sample means takes on the shape of the normal curve, we now have a connection between any ___ sample and the normal distribution.
random
From the normal distribution, we can ___ the probabilities for any specific sample.
determine
On the normal curve below, with a universal mean of 500 and 1 SD = 20, how many SDs away from the mean is the score 560?
3
The central limit theorem describes ___ of the distribution of the sample.
characteristics
The distribution of the sample means characteristics are:
The shape of the curve approaches a ___ distribution.
The “mean of the means” (grand mean) is equal to the population mean from which they were drawn.
The variation has the standard deviation of the distribution of the sample means which is called the standard error.
The standard error measures exactly how much difference should be expected, on average, between a sample mean and the population mean.
normal
Standard error is directly related to the population standard deviation and ___ related to sample size.
inversely
N is in the denominator, therefore as sample size increases, standard error ___.
decreases
This is because if the population standard deviation is ___ (in the numerator) standard error will be large.
large
recall: Inferential statistics make ___ about the target population from the sample population.
predictions
Recall: In quantitative research, we test a prediction about the sample population to make a ___ from the sample population back to the target population with any random sample and the normal distribution.
generalization
From the ___ we can determine the probabilities of scores for any specific sample.
normal distribution
A ___ makes an inference about the target population based upon the test on a sample population, hence the term “inferential statistics.”
hypothesis
A ___ is a statistical method that uses sample data to evaluate a hypothesis about a population parameter.
hypothesis test
A researcher begins with a ___ population (as they exist before treatment).
known
The ___ is to determine what happens (DV) to the population after treatment (IV) is administered it is the change in the mean that is the research question
goal
STARTING FROM TEXT
The most basic way to illustrate data is through the creation of a ___
frequency distribution
A frequency distribution is a method of ___, and representing, how often certain scores occur.
tallying
In the creation of a frequency distribution, scores are usually grouped into ___, or ranges of numbers.
class intervals
As you can see from the above table, a class interval is a ___ of numbers, and the first step in the creation of a frequency distribution is to define how large each interval will be.
range
A ___ is a visual representation of the frequency distribution in which the frequencies are represented by bars.
histogram
A ___ is a continuous line that represents the frequencies of
scores within a class interval,
frequency polygon
Once you have created a frequency distribution and have visually represented those data using a histogram or a frequency polygon, another option is to create a visual representation of the cumulative frequency of occurrences by class intervals. This is called a ___
cumulative frequency distribution
A cumulative frequency distribution is based on the same data as a frequency distribution, but it has an added column ___
Cumulative Frequency
A ___ is identical to a column chart, but in this chart, categories are orga- nized on the y-axis and the range of scores is shown horizontally on the x-axis.
bar chart
A ___ should be used when you want to show a trend in the data at equal intervals.
line chart
Excel offers one other correlation tool, the ___ function, which calculates the correlation coefficient
PEARSON
Example of Hypothesis Testing
First, state the null and research hypothesis
The null hypothesis states that there is no relationship between the quality of the marriage and the quality of the relationship between parents and children.
The research hypothesis is a two-tailed, nondirectional research hypothesis because it posits that a relationship exists between the two variables but not the direction of that relationship.
Remember that correlations can be positive (or direct) or negative (or indirect), and the most important characteristic of a correlation coefficient is its absolute ___ and not its sign (positive or negative).
value or size
The null hypothesis is H(0) : p(xy) = 0
The Greek letter p, or rho, represents the ___ estimate of the correlation
coefficient.
population
The research hypothesis states that there is a relationship between the two values and that the relationship differs from a value of zero.
The equation is….
H1 = r(xy) ≠ 0
The second step is to set the level of ___ (or the level of significance or Type I error) associated with the null hypothesis.
risk
The level of risk or probability of a ___ or level of significance is .05 (STEP 2)
Type I error
next, select the appropriate ___
test statistic
We determined that the appropriate test is the ___
correlation coefficient
In this instance, we do not need to compute a test statistic because the sample ___ (r(xy) = .44) is the test statistic
r value
In step five, determine the value needed for ___ of the null hypothesis using the appropriate table of critical values for the particular statistic.
rejection
Our first task here is to determine the ___, which approximates the sample size.
degrees of freedom (df)
Using this number (df = 28), the level of risk you are willing to take (.05), and a two-tailed test (because there is no direction to the research hypothesis), the ___ is .381 (using df= 25 because 28 isn’t shown in the table).
critical value
So, at the .05 level, with 28 degrees of freedom for a two- tailed test, the value needed for rejection of the null hypothesis is ___
.381
In step six, ___ the obtained value and the critical value.
compare
The ___ value is .44, and the critical value for rejection of the null hypothesis that the two variables are not related is .381.
obtained
in 7 you make a decision
If the obtained value (or the value of the test statistic) is more extreme than the critical value (or the tabled value), the null hypothesis cannot be ___
accepted
If the obtained value does not exceed the critical value, the ___ is the most attractive explanation.
null hypothesis
In this case, the obtained value (.44) does ___ the critical value (.381)—it is extreme enough for us to say that the relationship between the two variables (quality of marriage and quality of parent-child relationships) did occur in our sample due to something other than chance.
exceed