PSYC2063 WEEK 1
 Call Kai
 Learn
Learn Practice Test
 Spaced Repetition
 Match
Match Flashcards
 Knowt Play
1/4

There's no tags or description
Looks like no tags are added yet.
Name | Mastery | Learn | Test | Matching | Spaced | Call with Kai | Chat |
|---|
No analytics yet
Send a link to your students to track their progress
5 Terms
WHY THIS COURSE EXISTS?
There are more graphs than ever before
People use graphs to send a message, even if it's not really what the graph shows
'scientific' claims are everywhere
We are prone to confirmation bias
There is more information available than ever before
Misinformation & disinformation
Advances in technology enable truly perplexing and impenetrable graphs
People make mistakes
A small number of scientists commit fraud
People gather statistics; statistics are not facts; they are interpretations
MEAN, MODE, MEDIAN
Mean = the average value
Median = the middle value
Mode = the most frequent value
VARIABLES
X-axis = horizontal
Y-axis = vertical
IV = the variable being manipulated (usually x)
DV = the variable being measured (usually y)
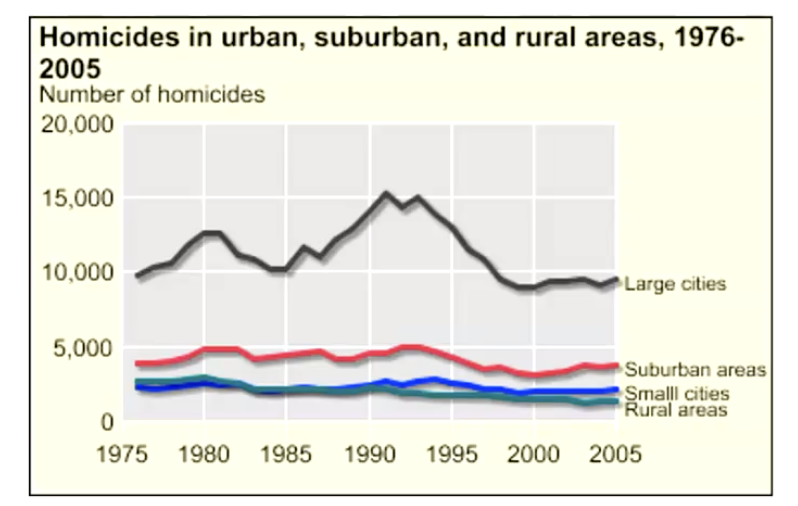
GRAPH 1
The graph shows number of homicides but doesn't account for the number of people living in that area
Can't make conclusion about which area is safer
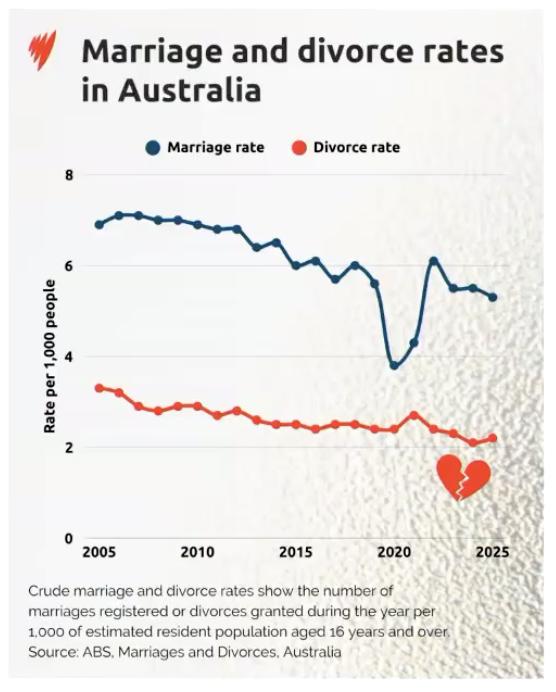
GRAPH 2
Doesn't take into account COVID-19
You could continue to get divorced vs married during COVID
Peak in marriage rates after decline
You would expect the peak to be larger
Both declining
Marriage rates declining more rapidly
The cost of living is increasing